

Lost Productive Time and Cost Due to
Common Pain Conditions in the US WorkforceThis section is compiled by Frank M. Painter, D.C.
Send all comments or additions to: Frankp@chiro.org


FROM: JAMA 2003 (Nov 12); 290 (18): 2443–2454 ~ FULL TEXT
OPEN ACCESS Walter F. Stewart, PhD, MPH; Judith A. Ricci, ScD, MS; Elsbeth Chee, ScD; David Morganstein, MS; Richard Lipton, MD
AdvancePCS Center for Work and Health,
Hunt Valley, Md, USA.
The American productivity audit surveyed 29,000 working adults to quantify the impact of reduced performance at work due to pain. Researchers questioned respondents regarding the cost implications of reduced performance were due to headaches, arthritis, back pain and other musculoskeletal pain. Respondents were also asked if the common pain conditions had caused them to lose concentration, repeat jobs, do nothing or feel fatigued at work. The cost of lost productive time in the US workforce was found to be $61 billion, and 76% of that cost was attributed to health–related reduced performance. This is consistent with prior studies that concluded loss of productive time is more significant than absenteeism. The data revealed that 1.1% of the workforce were absent one or more days per week because of common pain conditions.
Context: Common pain conditions appear to have an adverse effect on work, but no comprehensive estimates exist on the amount of productive time lost in the US workforce due to pain.
Objective: To measure lost productive time (absence and reduced performance due to common pain conditions) during a 2–week period.
Design and setting: Cross-sectional study using survey data from the American Productivity Audit (a telephone survey that uses the Work and Health Interview) of working adults between August 1, 2001, and July 30, 2002.
Participants: Random sample of 28 902 working adults in the United States.
Main outcome measures: Lost productive time due to common pain conditions (arthritis, back, headache, and other musculoskeletal) expressed in hours per worker per week and calculated in US dollars.
Results: Thirteen percent of the total workforce experienced a loss in productive time during a 2–week period due to a common pain condition. Headache was the most common (5.4%) pain condition resulting in lost productive time. It was followed by back pain (3.2%), arthritis pain (2.0%), and other musculoskeletal pain (2.0%). Workers who experienced lost productive time from a pain condition lost a mean (SE) of 4.6 (0.09) h/wk. Workers who had a headache had a mean (SE) loss in productive time of 3.5 (0.1) h/wk. Workers who reported arthritis or back pain had mean (SE) lost productive times of 5.2 (0.25) h/wk. Other common pain conditions resulted in a mean (SE) loss in productive time of 5.5 (0.22) h/wk. Lost productive time from common pain conditions among active workers costs an estimated 61.2 billion dollars per year. The majority (76.6%) of the lost productive time was explained by reduced performance while at work and not work absence.
Conclusions: Pain is an inordinately common and disabling condition in the US workforce. Most of the pain-related lost productive time occurs while employees are at work and is in the form of reduced performance.
From the FULL TEXT Article:
BACKGROUND
Pain is a common human malady that spares no group and often impairs function. Pain occurs in a variety of forms, including monophasic events (eg, due to injury), chronic episodic conditions (eg, migraine headache), and chronic persistent problems (eg, persistent pain from arthritis). The broad-based impact of pain, especially among working-age populations, is likely to have significant cost implications. A number of studies have described the impact of pain disorders (migraine, [1–10] tension-type headache, [11, 12] back pain, [13–18] arthritis, [19–23] and general musculoskeletal disorders) [24, 25] on work.
Although these and other pain conditions have a profound impact on the ability to work, available research has substantial limitations. Most studies focus on a single pain disorder and do not provide composite estimates across a range of common pain disorders. [1–13, 15–19, 21–26] Many studies on the work-related impact of pain focus on lost time due to absenteeism [7–11, 13–28]; few have estimated the pain-related impact of reduced performance while at work. [1–6, 12, 29] This limitation is important because increasing evidence indicates that reduced work performance due to pain, not absenteeism, is the dominant cause of lost productive time. [1–6, 12, 29–34] Some studies focus on specific employers [2, 7] or other populations limited in generalizability in other ways. [4, 27, 29] Finally, no study has quantified lost time due to common pain conditions capturing both absenteeism and health-related reduced performance on days at work in a representative sample of the US workforce and then translated those estimates into economic terms.
The American Productivity Audit provides an opportunity to better understand the impact of pain on the US workforce. The American Productivity Audit captures a large, representative national sample of the US workforce and assesses lost productive time due to health conditions, with a specific focus on common pain conditions. Survey respondents report time absent due to pain overall and due to specific pain conditions and reduced performance while at work due to pain overall and due to specific pain conditions. We estimate pain-related lost productive time and the associated costs due to headache, back pain, arthritis, and other musculoskeletal pain in the US workforce in aggregate and individually for each pain disorder.
Methods
The American Productivity Audit is a national survey of the US workforce [35] completed using the Work and Health Interview (W.F.S., unpublished data, 2003). [36, 37] The survey was completed by IMR, a survey and clinical research division of AdvancePCS. The Work and Health Interview captures data on work absence, reduced performance while at work, and health-related causes of work absence and reduced performance. The study protocol and the informed consent statement were approved by the Essex institutional review board.
Work and Health Interview
The structure, development, and validation of the Work and Health Interview is described in detail elsewhere (W.F.S., unpublished data, 2003). [36, 37] In brief, the Work and Health Interview, a computer-assisted telephone interview, comprises 8 modules. The first 3 modules capture detailed data on employment status, usual work time, and the presence of 22 health conditions. In particular, specific questions were asked about headache or pain in the back, feet, hands, wrists, or other places in the past 2 weeks, and about arthritis or pain in 1 or more joints in the past 12 months. The question regarding arthritis and joint pain was followed by a question about the specific location of the pain and the frequency with which it occurred in the past 2 weeks. A job visualization module ensures that respondents focus on general descriptions of their work before answering questions about reduced work performance due to pain. Questions were asked about tasks and activities performed at work, the time allotted to each, and those deemed most important. Participants also characterized occupations in terms of job demand and job control. [38]
Two modules quantify lost productive time. A missed workday module quantifies the number of missed workdays and health-related cause(s). The module on lost productive time for days at work asks about missed hours (ie, partial workdays) and reduced performance on days at work not feeling well, and health-related cause(s). Not feeling well was broadly defined during the interview as a health condition that either comes and goes or as an ongoing health condition. Validation of the lost productive time metric have been described in detail elsewhere (W.F.S., unpublished data, 2003). [37, 38]
The respondent ascribed the cause(s) of work absence(s) and of reduced performance while at work. If an individual reported lost productive time (ie, either time absent from work or reduced performance) in the previous 2 weeks and reported having more than 1 pain condition (during the first part of the interview), they were reminded of the pain conditions that they had reported. They were then asked to select the primary reason for their time absent from work or reduced performance while at work. At the end of the interview, information on salary was obtained.
Household Sampling and Selection of Household Members
Households were selected as a random sample of residences with telephones in the 48 contiguous states and the District of Columbia. Genesys Sampling Systems (Fort Washington, Pa) provided a probability sample of residential telephone numbers and households were called on different days of the week and at different times of the day.
Respondents were deemed eligible if they(1) were aged 18 to 65 years;
(2) were a permanent member of the household;
(3) responded yes to the Current Population Survey (CPS)39 question on employment status: "Last week, did you do any work for either pay or profit?"; and
(4) were employed in current job at least 14 days.A 1 in 10 random sample of adults who responded no to the CPS question was also selected to participate if the respondent was aged 18 to 65 years and a permanent member of the household.
If more than 1 eligible adult was a member of the household, we selected the person whose next birthday would occur closest to the day of the interview. This procedure approximates a probability-based selection method without the need to enumerate all eligible members of the household. [40] Verbal informed consent was obtained before initiating the interview. Once an interview was completed, the interviewer requested to speak with the next eligible member of the household who would have a birthday. Up to 2 eligible members per household were interviewed to optimize the efficiency of the sampling strategy. [41]
Data Collection and Benchmarking
Data collection began on August 1, 2001, and continued for 1 year. Approximately 2,500 interviews were completed each month. The sample included individuals who worked for pay or profit in the past 7 days (ie, occupation-eligible) and a 10% random sample of individuals who did not work for pay or profit in the past 7 days (ie, occupation ineligible). Details on the participation are described elsewhere. [35, 42] A total of 33 996 respondents agreed to participate in the survey (ie, gave a complete or partial interview) and 30,523 completed the full interview. Of this number, 28,902 (92.2%) were occupation-eligible. Overall participation was estimated at 66.2%. [35, 42]
A 2–step weighting method was used to account for selective participation. One weight was applied to individual participants as the inverse of the number of telephone lines available for incoming calls to account for the unequal probability of selecting households. Second, a population-weighting adjustment accounted for selection bias due to incomplete coverage of the US population and to ensure that estimates of certain sample demographic subgroup totals conformed to known values for these totals. The CPS was used as the external reference database because it provided high precision estimates on a nationally representative sample of the US workforce. A raking method was used for population weighting adjustment, benchmarking to 4 variables (age, sex, region, and a composite of work status and number of missed work hours) common to both the American Productivity Audit and the CPS. Raking used an iterative proportional fitting procedure to ensure that the weights assigned to individual respondents lead to marginal distributions on auxiliary variables that were equivalent in the American Productivity Audit and the CPS. [43] Wesvar statistical software (Version 4, Westat, Rockville, Md) was used to perform the raking adjustments.
Analysis
Analysis was restricted to the 28,902 occupation-eligible respondents who completed the interview. Analyses were first completed to describe variation in health-related lost productive time among workers by selected characteristics. The method for estimating lost productive time from Work and Health Interview data is described in detail elsewhere. [37, 42] Lost productive time for a personal health reason was the sum of hours per week absent from work for a health-related reason (absenteeism) and the hour equivalent of health-related reduced performance on days at work ("presenteeism"). Absenteeism included missed workdays and reduced work hours on days at work during the recall period. Reduced performance at work was quantified based on responses to 6 questions.
For 5 of the 6 questions, respondents were asked how often, on average during the recall period, they lost concentration, repeated a job, worked more slowly than usual, felt fatigued at work, and did nothing at work on days when they were at work not feeling well. Response options were all of the time, most of the time, half of the time, some of the time, and none of the time. A sixth question asked respondents about the average amount of time it took them to start working after arriving at work on days not feeling well during the recall period.
The aggregate measure of reduced performance was then derived in 4 steps:(1) convert the categorical response options for 5 of the 6 questions into percentages as follows: all of the time (100%), most of the time (75%), half of the time (50%), some of the time (25%), and none of the time (0%);
(2) average the responses to the 5 categorical behavior questions to yield the average percentage of lost productive work time and multiply this percentage by the number of hours worked per day to yield its hour equivalent;
(3) add the hours of lost productive work time to the reported average amount of time it took to start working after arriving at work; and
(4) divide by the number of weeks per recall period for the hours per week of lost productive time on days at work.Respondents attributed the cause of their health-related lost productive time to specific health conditions. In this study, we targeted the common pain conditions that affect both men and women in the workplace. These included arthritis, back pain, headache, and other musculoskeletal pain. We did not include a number of less common conditions in our estimate of pain-related lost productive time (eg, pain associated with cancer or cancer treatment, diabetic neuropathy) or conditions that do not affect both men and women (eg, menstrual pain).
Lost labor costs were estimated by translating hours of lost productive time into lost dollars using self-reported annual salary or wages. Lost dollars were calculated by multiplying lost hours by hourly earnings. Data were first summarized to describe the percentage of workers with lost productive time (ie, absenteeism and health-related reduced performance on days at work) due to pain in the previous 2 weeks. We estimated the percentage of all workers with pain-related lost productive time in the previous 2 weeks, and the percentage with 2 h/wk or more of pain-related lost productive time in the previous 2 weeks. Estimates were derived for any pain and separately for each of the 4 common pain condition categories (ie, headache, back pain, arthritis, musculoskeletal pain).
We describe variation in the proportion of all individuals in a defined group who reported 2 h/wk or more of lost productive time due to pain. Two or more hours was selected as a meaningful threshold for lost productive time. In this population-level analysis, crude proportions were derived. To determine if 2 h/wk or more of pain-related lost productive time varied by demographic and other features, we analyzed data using a generalized linear model framework (SAS Proc GENMOD). The log of the expectation of each binary response variable (ie, ≥2 h/wk of pain-related lost productive time vs no time) was modeled as a linear function of the explanatory variable. Log link was used so that parameters could be interpreted as prevalence ratios (ie, proportion with ≥2 h/wk of pain-related lost productive time in one group divided by the same measure in the reference group) rather than as odds ratios. We also restricted analysis to those who reported an episode of pain-related lost productive time in the previous 2 weeks and described variation in mean lost productive time by covariates among these individuals. Variation in lost productive time was modeled using linear regression (SAS Proc GLM).
Variation in lost productive time was evaluated in relation to a number of covariates considered to be relevant to employers and policy makers. These factors included sex, age (18–29, 30–39, 40–49, or 50–65 years), race (white, black, or other), education (< high school diploma, high school diploma or GED, some college or associate degree, bachelor degree, or graduate degree), annual salary (<$10 000, $10 000–$19 999, $20 000–$29 999, $30 000–$39 999, $40 000–$49 999, or ≥$50 000), type of occupation (white collar or blue collar), composite job-demand and job-control category (high demand-high control, high demand-low control, low demand-high control, or low demand-low control) based on Karasek et al,38 duration of time at job (<0.5, 0.5–0.9, 1–1.9, 2–2.9, 3–4.9, 5–9.9, 10–19.9, or ≥20 years), month of interview (January–February, March–April, May–June, July–August, September–October, or November–December), health insurance (insured or not insured), and number of nonpain health conditions reported in previous 2 weeks (0–1, 2, 3, or ≥4).
Nonpain health conditions were defined as all health conditions reported in the previous 2 weeks excluding the pain conditions targeted by this research (ie, headache, arthritis, back pain, or other musculoskeletal pain). We also included geographic region (Northeast, South, Midwest, or West) as a broad-based surrogate for possible sociocultural differences in views on work. Occupations coded according to the 1998 Standard Occupational Classification System (Bureau of Labor Statistics, US Department of Labor) were dichotomized as white collar or blue collar according to US Office of Personal Management definitions. [44] White collar jobs included professional, administrative, or support-type occupations; blue collar jobs included trade or labor occupations. [44]
Imputation procedures for missing values in benchmarking and weighting variables and annual salary are described elsewhere. [42] SAS statistical software was used for all analysis (Version 8.2, SAS Institute Inc, Cary, NC).
Results
A profile of participants is described elsewhere [35] and available on request. Fifty-six percent of participants were women. Respondents were equally distributed across 4 age groups (18–29, 30–39, 40–49, and 50–65 years), a majority were white (77.0%), 67% were formally educated beyond high school, 83% were working more than 30 h/wk, and 51% earned less than $40,000 per year. The most common occupational category was office or administrative support (16.4%), which was followed by sales (9.3%), and education/training/library occupation (7.6%). Benchmarking (ie, reweighting in reference to the CPS) resulted in several significant distributional changes. Compared with the participation sample, reweighting primarily influenced the percentage distribution by sex, age (ie, more adults aged 18–29 years and fewer adults aged 40–49 years), and geographic region. For the latter, weighting was increased for underrepresentation in the West and decreased for overrepresentation in the South.

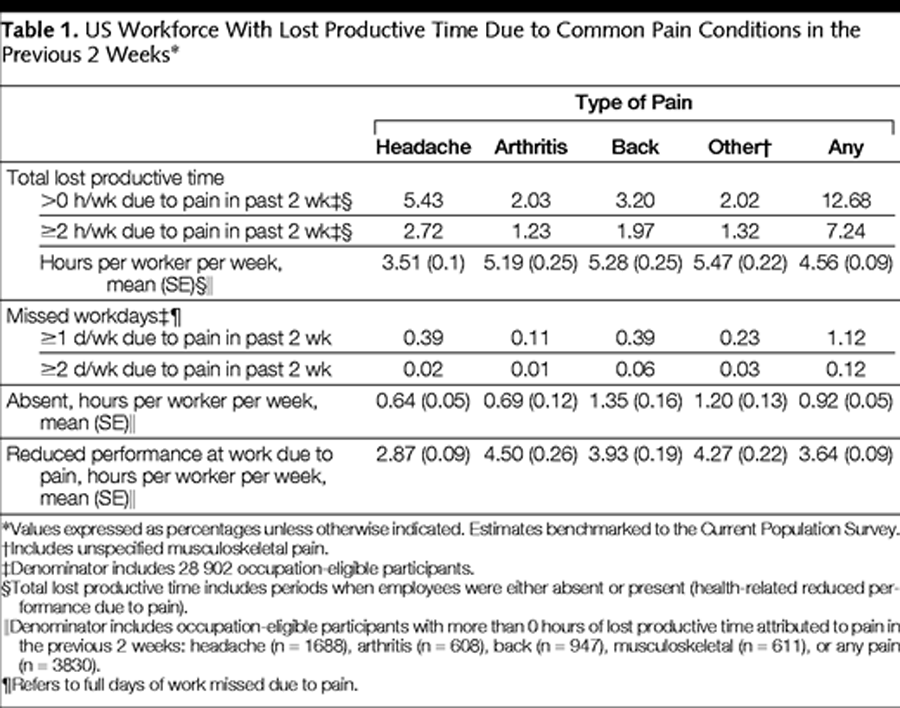
Table 1 A total of 52.7% of the workforce reported having headache, back pain, arthritis, or other musculoskeletal pain in the past 2 weeks. Overall, 12.7% of the workforce lost productive time in a 2–week period due to a common pain condition; 7.2% lost 2 h/wk or more of work. Headache was the most common pain condition resulting in lost productive time, affecting 5.4% (2.7% with ≥2 h/wk) of the workforce (Table 1), which was followed by back pain (3.2%), arthritis (2.0%), and other musculoskeletal pain (2.0%). Among those who lost productive time due to a pain condition, an average of 4.6 h/wk was lost (Table 1). The mean lost productive time was lowest for headache (3.5 h/wk) and highest for other musculoskeletal pain (5.5 h/wk). Absence days were uncommon. A total of 1.1% of the workforce was absent from work 1 or more days per week from 1 of the 4 pain conditions; 0.12% were absent 2 d/wk or more. Headache and back pain were dominant causes of missed days of work. Overall, lost productive time due to health-related reduced performance on days at work accounted for 4 times more lost time than absenteeism. The ratio of lost productive time due to health-related reduced performance on days at work compared with absenteeism varied among categories of pain disorders: headache, 4.5 h/wk; arthritis, 6.5 h/wk; back pain, 2.9 h/wk; and other musculoskeletal pain, 3.6 h/wk.
Variation in Lost Productive Time
Table 2
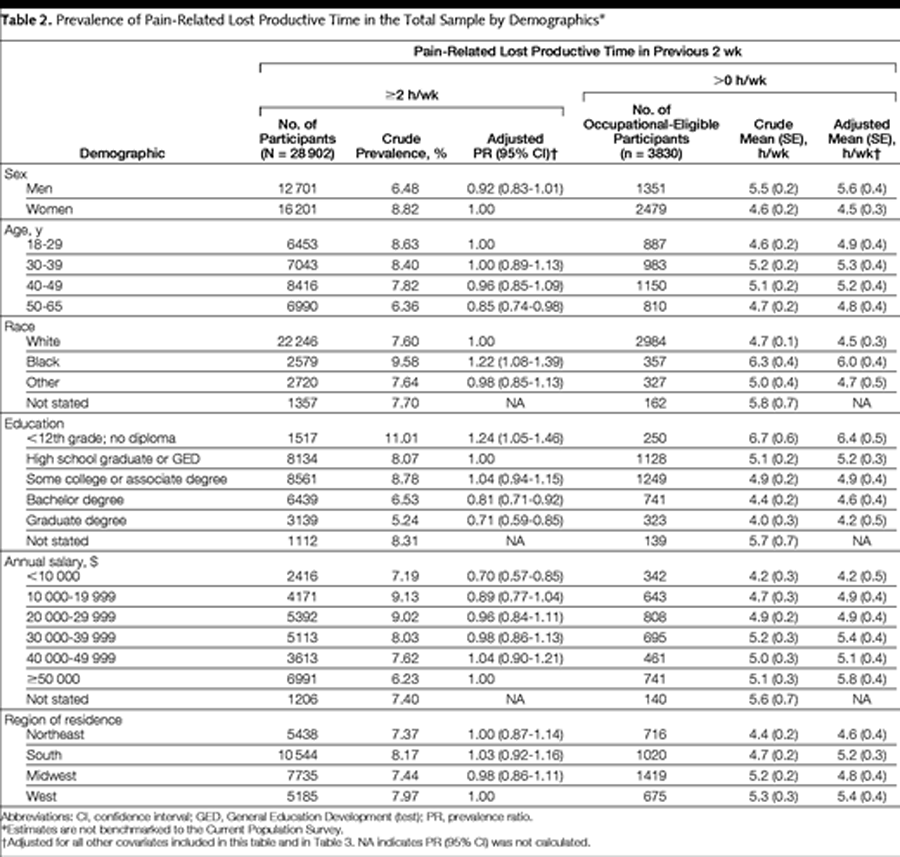
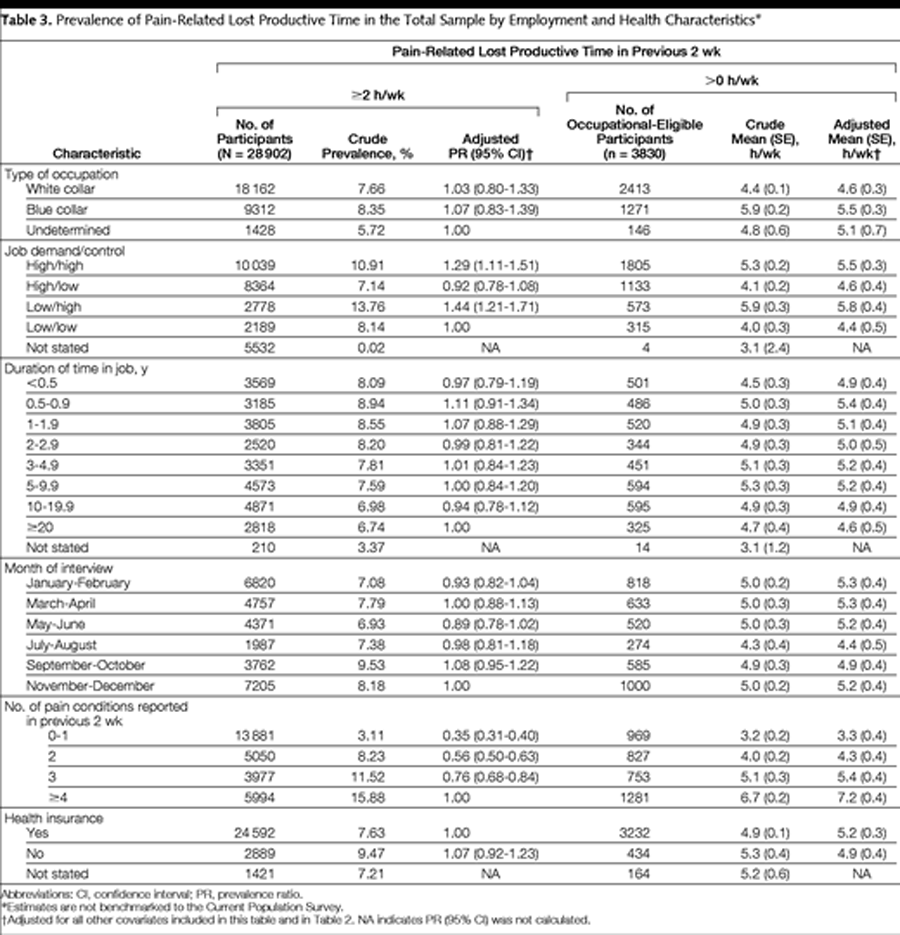
Table 3 Factors that determine variation in lost productive time were examined in the total workforce (estimated percentage who lost ≥2 h/wk of productive time due to pain) and among the subsample of the workforce with some pain-related lost productive time (estimated mean lost productive time in hours per week) (Table 2 and Table 3). For the first method, the prevalence measure is a composite of the prevalence of the pain condition in the population in general and the frequency of pain episodes that actually have an impact on work function.
No difference in the proportion of the workforce losing 2 h/wk or more due to pain was observed by sex, age, region of residence, type of occupation (ie, blue collar or white collar), duration of time in job, month of interview, or health insurance status after adjusted prevalence ratios were examined (Table 2 and Table 3). On the other hand, blacks exhibited a 20% excess prevalence of 2 h/wk or more of pain-related lost productive time compared with whites (P = .002), and a small difference was observed by annual salary (ie, overall P = .002; prevalence ratio [PR] for lowest income group compared with the highest income group was 0.70 [95% confidence interval {CI}, 0.57–0.85]). The largest differences were observed by education (P<.001) in which the prevalence of 2 h/wk or more of pain-related lost productive time was inversely related to level of educational attainment. Compared with those with a high school diploma, the PR was 1.24 (95% CI, 1.05–1.46) for those without a high school degree and 0.71 (95% CI, 0.59–0.85) for those with a graduate degree.
Job demand-control category also significantly improved the fit of the model (P<.001). Individuals with high control jobs (ie, high demand-high control and low demand-high control) were 30% to 40% more likely to have lost 2 h/wk or more of lost productive time due to pain compared with those with low demand-low control jobs (Table 3). Finally, a strong statistically significant gradient (P = .01) was observed in relation to the number of other health conditions reported to occur in the previous 2 weeks (ie, responses to specific questions about health conditions). Compared with those with 4 or more pain conditions, the proportion losing 2 h/wk or more of pain-related lost productive time was significantly lower among those with 3 pain conditions (PR, 0.76; 95% CI, 0.68–0.84), 2 (PR, 0.56; 95% CI, 0.50–0.63), and 1 or no (PR, 0.35; 95% CI, 0.31–0.40) other pain condition (Table 3).
Among those with some productive time lost due to pain, no difference in mean lost productive time per week was observed by age, region of residence, type of occupation (ie, white collar or blue collar), duration of time in job, month of interview, or health insurance status (Table 2 and Table 3). Crude mean (SE) lost productive time was significantly higher (P<.001) for males (5.5 [0.2] h/wk) than females (4.6 [0.2] h/wk) and for blacks (adjusted mean [SE], 6.0 [0.4]; P<.001) compared with whites (adjusted mean [SE], 4.5 [0.3]) (Table 2). A statistically significant gradient (P<.01) of increasing mean lost productive time was observed in relation to decreasing education. In contrast, a more modest, but statistically significant (P = .049) gradient of increasing mean lost productive time was observed in relation to increasing salary (Table 2). Other notable differences were observed for job demand/control (P<.001) and number of other health conditions (P<.001) in a manner that mirrored the PRs. Individuals in high-control jobs had higher mean pain-related lost productive time per week than those in low-control jobs. Mean pain-related lost productive time per week was directly related to number of other reported health conditions (Table 3).
Sex- and Age-Specific Occurrence by Pain Condition
Table 4
Table 5
Table 6 Although we did not find substantial overall differences by sex and age in the proportion of the workforce affected by significant pain episodes (ie, ≥2 h/wk of pain-related lost productive time), differences were observed for specific pain-related conditions. In males and females, headache was dominant at a younger age, peaking between ages 25 and 29 years and declining thereafter (Figure 1). The proportion of the workforce with 2 h/wk or more of headache-related lost productive time was approximately 2 times higher in females than males. In contrast, the prevalence of 2 h/wk or more of lost productive time due to arthritis pain increased with increasing age in both males and females.
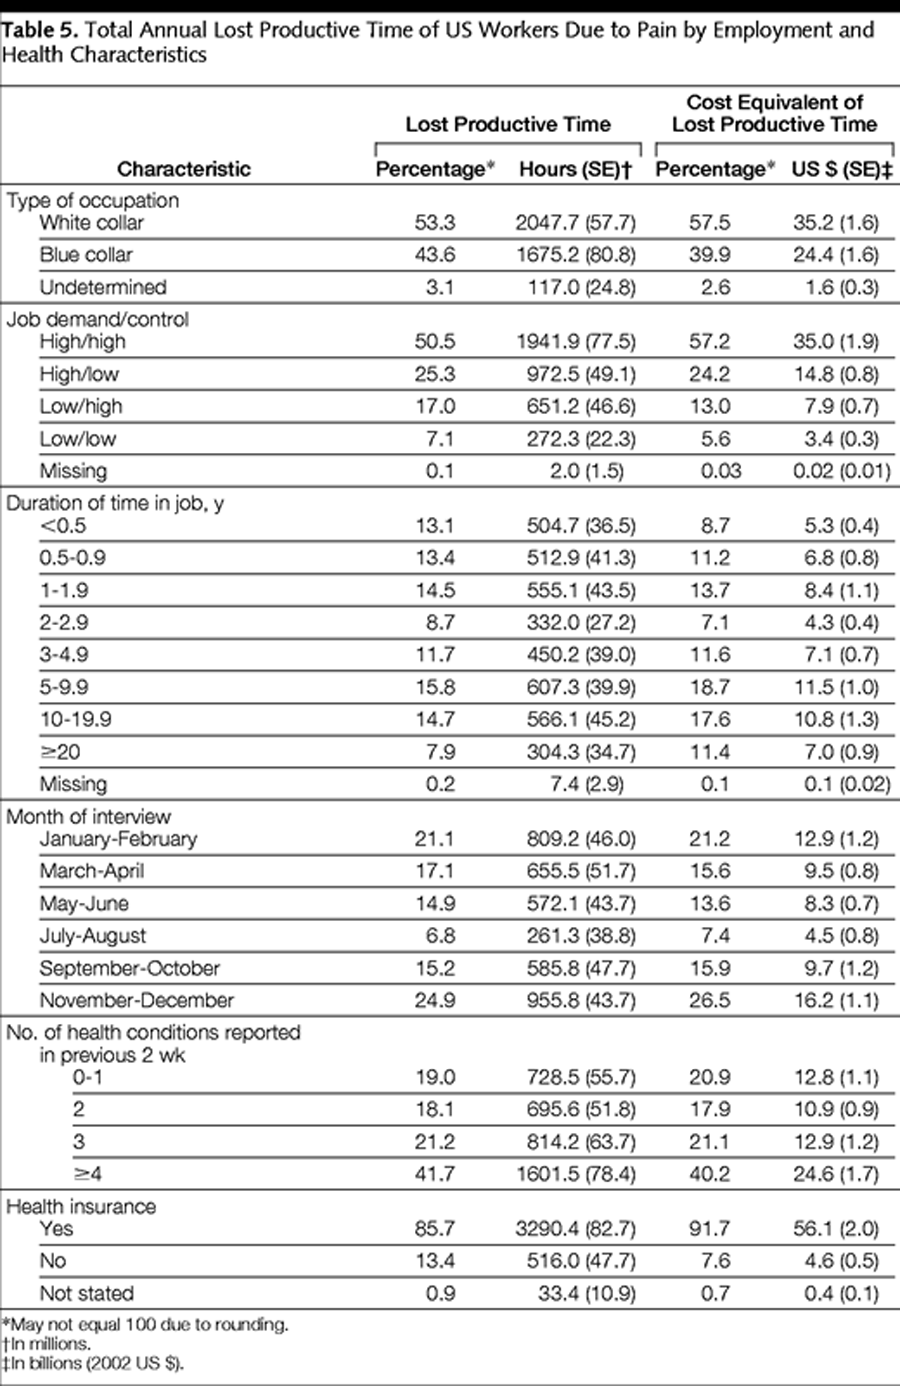
Cost of Lost Productive Time in the US Workforce
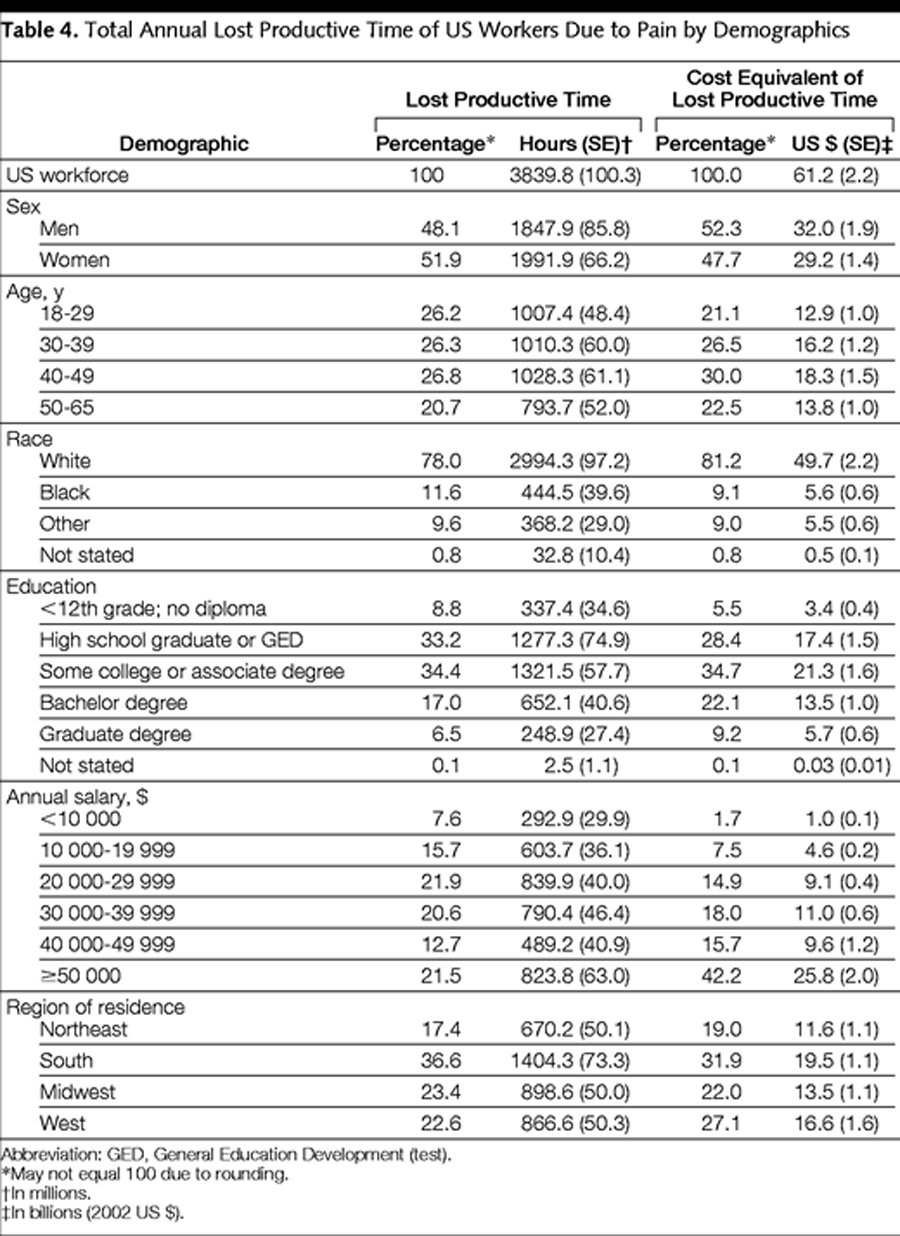
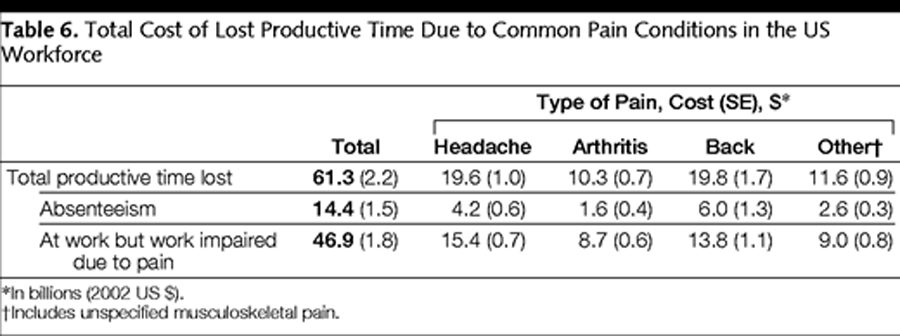
The percentage distribution of lost productive time (in hours) and lost productive time costs (in dollars) are summarized by demographic (Table 4) and other factors (Table 5). We estimated the cost of total lost productive time attributed to common pain conditions in the US workforce in hours and dollars because of the influence of salary on cost estimates. Differences between the lost productive time distributions expressed in hours and in dollars are explained by variation in the average hourly cost of labor by various subgroups. For example, individuals with an annual salary of $50 000 or more account for only 22% of the lost productive time in hours but 42% of the lost productive time cost in dollars. These estimates are limited to workers actively engaged in work and amount to $61.2 billion per year (Table 6). A total of 76.6% of this cost occurs while employees are at work and is explained by health-related reduced performance. The pain-related reduced performance on days at work component of the lost productive time cost varies somewhat by condition with a low of 69.7% for back pain and a high of 84.4% for arthritis.
Comment
Overall, the estimated $61.2 billion per year in pain-related lost productive time in our study accounts for 27% of the total estimated work-related cost of pain conditions in the US workforce. [35] Lost productive time varied to some degree in the workforce. First, little or no variation was observed by age. In large part, the lack of differences by age was due to the counterbalancing effects of different pain conditions. Headache, common at younger ages (ie, 18–34 years), rapidly declines in prevalence thereafter. In contrast, the other 3 pain conditions are either more common with increasing age (eg, arthritis) or peak at a later age than headache (eg, back pain).
The relatively strong inverse relationship with education that we found in our study may be explained by several factors. First, for some conditions like migraine, [45] prevalence is inversely related to education. Potentially hazardous work conditions, physically demanding work, or other risk factors may be more common among those with a lower education level and lead to restricted activity days, an established finding for back pain. [17] Second, access to medical care and, more generally, health literacy are known to vary by education level [45] and influence access to treatment and quality of care. [47] Third, our finding could be confounded by factors associated with common pain disorders as well as with lost productive time. Depression is one such confounder that may be particularly important because it is strongly and inversely related to education in the workforce42 and often co-occurs with a number of pain conditions including back pain [42] and migraine. [48]
Our method of estimating the impact of pain on work productivity differs in several respects from previous studies. First, our focus is on individuals who experienced a recent episode of pain that impaired their ability to work. Most other studies have captured more general information (eg, frequency of episodes and average effect) over longer recall periods to estimate the effect of pain. We used a 2–week period to ensure accurate recall of episodes of health problems that impair work function. In a previous study, [37] we showed that recall of health-related lost productive time was underestimated with a 4–week recall period and possibly overestimated due to telescoping with a 1–week recall period.
Second, in our study, pain was denoted as a primary cause of lost productive time only if the respondent made the specific attribution. In previous studies, those with a specific pain condition are identified first, and subsequently, the impact of the condition on work is assessed. This method is prone to overestimation bias in 2 ways: respondents report lost productive time for a specific cause, which may result in their overattributing lost productive time to that cause; or all work lost during a recall interval when the pain condition was present is attributed to that condition. In contrast, our method may be prone to underestimate lost productive time due to selected conditions deemed socially undesirable as a cause for missing work (eg, headache).
Third, we did not use diagnostic questions to identify individuals with different pain conditions. We used recall prompts at the beginning of the interview by asking whether specific health conditions occurred in the previous 2 weeks or 12 months (ie, for chronic diseases). Later in the interview, health-related lost productive time was assessed and the respondent was asked to attribute a cause. In general, our method is likely to be accurate in identifying episodes of lost productive time in which pain is the cause. It is also likely to be accurate for conditions such as headache in which a diagnosis is not required. On the other hand, respondents may understate the extent to which back pain or other musculoskeletal pain is caused by arthritis unless they have received a medical diagnosis for arthritis.
No study to date provides information on the work impact of all common pain conditions. A few studies have quantified lost productive time and projected these costs to the US workforce. Hu et al, [5] using data from several population-based studies, estimated the work-related costs from migraine in the United States to be $13 billion. Schwartz et al [28] concluded that the lost work time from tension-type headache was similar to the costs from migraine headache and that health-related reduced performance at work, which was roughly measured, accounted for 70% of the overall work-related lost productive time from all headaches. Together, these studies suggest that the total lost productive time cost from headache is $26 billion compared with our estimate of $19.6 billion. The differences we have cited between our methods and the more traditional methods used in these 2 previous studies may account for our lower cost estimate. In addition, as migraine and tension-type headache are comorbid, estimates of migraine alone or tension-type headache alone may inadvertently capture lost productive time due to the other disorder.
Consistent with other studies, [5, 6, 9, 26, 27, 30–34] reduced performance while at work was the dominant source (ie, 80% of the lost productive time and 76.6% of the lost productive time-related cost) of pain-related lost productive time in the US workforce. In previous studies of headache disorders, including daily diary studies of migraine, health-related reduced performance on days at work is a more significant cause of lost work time than absenteeism.3 In addition, our previous analysis [35] indicates that on any given day relatively few workers are absent from work. Given that pain conditions are highly prevalent in the workforce and that work performance is impaired in a substantial minority of workers with common conditions, it is not surprising that a majority of the pain-related lost productive time we observed results from reduced performance while at work. Nonetheless, employers may challenge the validity of this finding. Few employers document health-related lost productive time while at work, making it largely invisible and, as a consequence, intangible and subject to doubt.
Respondents were asked to attribute their lost productive time to a primary condition. However, pain conditions often co-occur. While we were not able to identify the extent to which different pain conditions co-occurred, we did examine this question in an independent national survey of 12,416 individuals. In this survey (conducted in 2002), the interview and sampling methods were the same as those as described herein with one exception. We asked separate questions about pain conditions occurring in the last 2 weeks. Of the 32% of respondents reporting 1 of the 4 pain conditions in the past 2 weeks, 16.4% reported only 1 condition (5.0% headache, 4.6% arthritis, 4.3% back pain, 2.5% musculoskeletal), 9.6% reported 2 pain conditions, 4.5% reported 3 conditions, and 1.5% reported all 4. The most common co-occurring conditions were arthritis and back pain (4.7%), headache and back pain (4.5%), and arthritis and musculoskeletal pain (4.3%). The least common was headache and musculoskeletal pain (2.4%).
Our estimate of $61.2 billion per year in pain-related lost productive time does not include costs from 4 other causes. First, we did not include lost productive time costs associated with dental pain, cancer pain, gastrointestinal pain, neuropathy, or pain associated with menstruation. Second, we do not account for pain-induced disability that leads to continuous absence of 1 week or more. Third, we did not consider secondary costs from other factors such as the hiring and training of replacement workers or the institutional effect among coworkers.49 Taking these other factors into consideration could increase, decrease, or have no net effect on health-related lost productive time cost estimates. Fourth, we may be prone to underestimating current lost productive time among those with persistent pain problems (eg, chronic daily headache). To the extent that these workers remain employed, they may adjust both their performance and perception of their performance over time. The latter, a form of perceptual accommodation, makes it difficult to accurately ascertain the impact of a chronic pain condition on work in the recent past through self-report.
An accurate estimate of work impact would require that individuals compare their recent work performance with that before the onset of the chronic pain condition. Analyses are under way using other data (ie, quality of life, changes in work performance since onset of a chronic illness) to examine the potential underestimation of lost productive time linked to accommodation from chronic pain and other conditions. Finally, in estimating lost productive time costs, we have assumed that there is a monetary equivalence between an hour of work absence and reduced performance. The validity of this assumption is likely to vary by work setting, position, percentage-reduced performance, degree of interdependence and exchangeability of workers, and other factors.
Our estimates of lost productive time due to pain should be interpreted in light of the possible beneficial and adverse effects of current pain treatment. Unfortunately, constraints on interview time did not allow us to collect detailed treatment data. This issue is currently being addressed in a supplemental study. The opportunity for employers can be defined by the gap between lost productive time due to pain given current use of treatments and lost productive time due to pain given optimal use of treatments. The magnitude of this gap is difficult to quantify. Certainly, its aggregate economic burden, as estimated in this study, is enormous, but we cannot state how much of the burden can be mitigated. National survey data that provide detailed data on use of treatments are limited. Of the common pain conditions, sufficient details have only been reported on migraine headaches.
Recent data indicate that only 41% of individuals who have migraine headaches in the US population ever receive any prescription drug for migraine. [50] Only 29% report that satisfaction with treatment is moderate, especially among those who are often disabled by their episodes. [51] Randomized trials demonstrate that optimal therapy for migraine dramatically reduces headache-related disability time in comparison with usual care. [52, 53] This study provides a measure of the scope of the problem, but the benefits of optimal intervention will have to be assessed separately for each condition.
In conclusion, pain is costly to employers. Our estimate of the cost of pain to the US workforce must be translated into a form that is relevant to employers. To this end, we have modeled lost productive time for employers using a direct adjustment procedure. Stratum- and condition-specific estimates of prevalence and mean lost productive time per week are estimated from the American Productivity Audit and applied to the age and sex distribution of the employer's workforce. Lost productive time (in hours) is translated to dollars using age- and sex-specific wage data. This is a first step to provide employers with a more concrete understanding of the costs they face from health conditions in their workforce and to begin to consider how health care dollars can be more effectively targeted to population-specific needs. Helping employers understand the cost of health-related lost productive time may encourage them to make more effective use of the health care dollars they invest in their workforce. As the primary purchaser of health care, employers are well positioned to demand programs that reduce the impact of common treatable pain conditions in the workplace.
References:
Stewart WF, Lipton RB, Simon D. Work-related disability: results from the American Migraine Study. Cephalalgia.1996;16:231-238
Michel P, Dartigues JF, Londoulsi A, Henry P. Loss of productivity and quality of life in migraine sufferers among French workers: results from the GAZEL cohort. Headache.1997;37:71-78
Von Korff M, Stewart WF, Simon D, Lipton RB. Migraine and reduced work performance: a population-based diary study. Neurology.1998;50:1741-1745
Dasbach EJ, Carides GW, Gerth WC, Santanello NC, Pigeon JG, Kramer MS. Work and productivity loss in the rizatriptan multiple attack study. Cephalalgia.2000;20:830-834
Hu XH, Markson LE, Lipton RB, Stewart WF, Berger ML. Burden of migraine in the United States: disability and economic costs. Arch Intern Med.1999;159:813-818
Gerth WC, Carides GW, Dasbach EJ, Visser WH, Santanello NC. The multinational impact of migraine symptoms on healthcare utilisation and work loss. Pharmacoeconomics.2001;19:197-206
Schulman EA, Cady RK, Henry D. et al. Effectiveness of sumatriptan in reducing productivity loss due to migraine: results of a randomized, double-blind placebo-controlled clinical trial. Mayo Clin Proc.2000;75:782-789
McCunney RJ. Health and productivity: a role for occupational health professionals. J Occup Environ Med.2001;43:30-35
tang PE, Osterhaus JT. Impact of migraine in the United States: data from the national health interview survey. Headache.1993;33:29-35
Stang P, Cady R, Batenhorst A, Hoffman L. Workplace productivity: a review of the impact of migraine and its treatment. Pharmacoeconomics.2001;19:231-244
Rasmussen BK, Jensen R, Olesen J. Impact of headache on sickness absence and utilisation of medical services: a Danish population study. J Epidemiol Community Health.1992;46:443-446
Schwartz BS, Stewart WF, Simon D, Lipton RB. Epidemiology of tension-type headache. JAMA.1998;279:381-383
Hildebrandt VH. Back pain in the working population: prevalence rates in Dutch trades and professions. Ergonomics.1995;38:1283-1298
Dartigues JF, Michel P, Lindoulsi A, Dubroca B, Henry P. Comparative view of the socioeconomic impact of migraine versus low back pain. Cephalalgia.1998;18(suppl 21):26-29
Rizzo JA, Abbott III TA, Berger ML. The labor productivity effects of chronic backache in the United States. Med Care.1998;36:1471-1488
Guo HR, Tanaka S, Halperin WE, Cameron LL. Back pain prevalence in US industry and estimates of lost workdays. Am J Public Health.1999;89:1029-1035
Cole DC, Ibrahim SA, Shannon HS, Scott F, Eyles J. Work correlates of back problems and activity restriction due to musculoskeletal disorders in the Canadian national population health survey (NPHS) 1994-5 data. Occup Environ Med.2001;58:728-734
. Fautrel B, Guillemin F. Cost of illness studies in rheumatic disease. Curr Opin Rheumatol.2002;14:121-126
Yelin E. Arthritis: the cumulative impact of a common chronic condition. Arthritis Rheum.1992;35:489-497
Greenberg PE, Finkelstein SN, Berndt ER. Calculating the workplace cost of chronic disease. Business Health.1995;13:27-30
Yelin E, Callahan LF. The economic cost and social and psychological impact of musculoskeletal conditions: National Arthritis Data Work Groups. Arthritis Rheum.1995;38:1351-1362
Coyte PC, Asche CV, Croxford R, Chan B. The economic cost of musculoskeletal disorders in Canada. Arthritis Care Res.1998;11:315-325
Merkesdal S, Ruof J, Schoffski O, Bernitt K, Zeidler H, Mau W. Indirect medical costs in early rheumatoid arthritis: composition of and changes in indirect costs within the first three years of disease. Arthritis Rheum.2001;44:528-534
Lee P. The economic impact of musculoskeletal disorders. Qual Life Res.1994;3(suppl 1):S85-S91
Yelin EH. Musculoskeletal conditions and employment. Arthritis Care Res.1995;8:311-317
Cull RE, Wells NEJ, Miocevich ML. The economic cost of migraine. Br J Med Econ.1992;2:103-115.
Osterhaus JT, Guterman DL, Piachetka JR. Healthcare resource and lost labour costs of migraine headache in the US. Pharmacoeconomics.1992;2:67-76
Schwartz BS, Stewart WF, Lipton RB. Lost workdays and decreased work effectiveness associated with headache in the work place. J Occup Environ Med.1997;39:320-327
Lerner D, Reed JI, Massarotti E, Wester LM, Burke TA. The Work Limitations Questionnaire's validity and reliability among patients with osteoarthritis. J Clin Epidemiol.2002;55:197-208
Cockburn IM, Bailit HL, Berndt ER, Finkelstein SN. When antihistamines go to work. Business Health.1999;17:49-50
Crystal-Peters J, Crown WH, Goetzel RZ, Schutt DC. The cost of productivity losses associated with allergic rhinitis. Am J Manag Care.2000;6:373-378
Greenberg PE, Stiglin LE, Finkelstein SN, Berndt ER. The economic burden of depression in 1990. J Clin Psychiatry.1993;54:405-418
Henke CJ, Levin TR, Henning JM, Potter LP. Work loss costs due to peptic ulcer disease and gastroesophageal reflux disease in a health maintenance organization. Am J Gastroenterol.2000;95:788-792
Kessler RC, Almeida DM, Berglund P, Stang P. Pollen and mold exposure impairs the work performance of employees with allergic rhinitis. Ann Allergy Asthma Immunol.2001;87:289-295
Stewart WF, Ricci JA, Chee E, Morganstein D. Lost productive work time costs from health conditions in the US: results from the American Productivity Audit. J Occup Environ Med.In press.
Ricci JA, Stewart WF, Leotta C, Chee E. A comparison of six phone interviews designed to measure health-related lost productive work time. Value Health.2001;4:460.
Stewart WF, Ricci JA, Leotta C. Health-related lost productive time: Recall interval and bias in cost estimates. J Occup Environ Med.In press.
Karasek R, Gordon G, Pietrokovsky C, Frese M, Pieper C. Job Content Instrument: Questionnaire and User's Guide, Version 1.1. Los Angeles: University of Southern California; 1986.
Bureau of Labor Statistics, Bureau of the Census. Current Population Survey. Available at: http://www.bls.census.gov/cps/cpsmain.htm. Accessibility verified September 30, 2003.
Groves RM, Lyberg LE. An overview of non-response issues in telephone surveys. In: Groves RM, Biemer PB, Lyberg LE, et al, eds. Telephone Survey Methodology. London, England: John Wiley & Sons Ltd; 1988:208.
Clark RG, Steel DG. The effect of using household as a sampling unit. Int Stat Rev.2002;70:289-314.
Stewart WF, Ricci JA, Chee E, Hahn SR, Morganstein D. Cost of lost productive work time among US workers with depression. JAMA.2003;289:3135-3144
Brick JM, Kalton G. Handling missing data in survey research. Stat Methods Med Res.1996;5:215-238
US Office of Personal Management. Federal Civilian Workforce Statistics: Occupations of Federal White-Collar and Blue-Collar Workers, as of September 39, 1999. Available at: http://www.opm.gov/feddata/ocwcbc99.pdf. Accessibility verified September 30, 2003.
Stewart WF, Lipton RB, Celentano DD, Reed ML. Prevalence of migraine headache in the United States: relation to age, income, race, and other sociodemographic factors. JAMA.1992;267:64-69
Gazmararian JA, Baker DW, Williams MV. et al. Health literacy among Medicare enrollees in a managed care organization. JAMA.1999;281:545-551
Ad Hoc Committee on Health Literacy for the Council on Scientific Affairs, American Medical Association. Health literacy: report of the Council on Scientific Affairs. JAMA.1999;281:552-557
Lipton RB, Hamelsky SW, Kolodner K, Steiner TJ, Stewart WF. Migraine, quality of life and depression: a population-based case-control study. Neurology.2000;55:629-635
Berger ML, Murray JF, Xu J, Pauly M. Alternative valuations of work loss and productivity. J Occup Environ Med.2001;43:18-24
Lipton RB, Diamond S, Diamond M, Reed M, Stewart WF. Migraine diagnosis and treatment: results from the American Migraine Study II. Headache.2001;41:638-645
Stewart W, Lipton R. Need for care and perceptions of MIDAS among headache sufferers. CNS Drugs.2002;16(suppl 1):5-11
Cady RC, Ryan R, Jhingran P, O'Quinn S, Pait DG. Sumatriptan injection reduces productivity loss during a migraine attack: results of a double-blind, placebo-controlled trial. Arch Intern Med.1998;158:1013-1018
Dasbach EJ, Carides GW, Gerth WC. et al. Work and productivity loss in the rizatriptan multiple attack study. Cephalalgia.2000;20:830-834

Return to COST EFFECTIVENESS
Return to COST EFFECTIVENESS JOINT STATEMENT
Since 5-14-2003
| Home Page | Visit Our Sponsors | Become a Sponsor |
Please read our DISCLAIMER |