

Variations in Patterns of Utilization and Charges
for the Care of Low Back Pain in North Carolina,
2000 to 2009: A Statewide Claims' Data AnalysisThis section is compiled by Frank M. Painter, D.C.
Send all comments or additions to: Frankp@chiro.org


FROM: J Manipulative Physiol Ther. 2016 (May); 39 (4): 252–262 ~ FULL TEXT
OPEN ACCESS Eric L. Hurwitz, DC, PhD, Dongmei Li, PhD, Jenni Guillen, MS,
Michael J. Schneider, DC, PhD, Joel M. Stevans, DC, Reed B. Phillips, DC, PhD,
Shawn P. Phelan, DC, Eugene A. Lewis, DC, MPH, Richard C. Armstrong, MS, DC,
Maria Vassilaki, MD, MPH, PhD
Office of Public Health Studies,
University of Hawaii at Manoa,
Honolulu, HI.
ehurwitz@hawaii.edu
Thanks to JMPT for permission to reproduce this Open Access article!
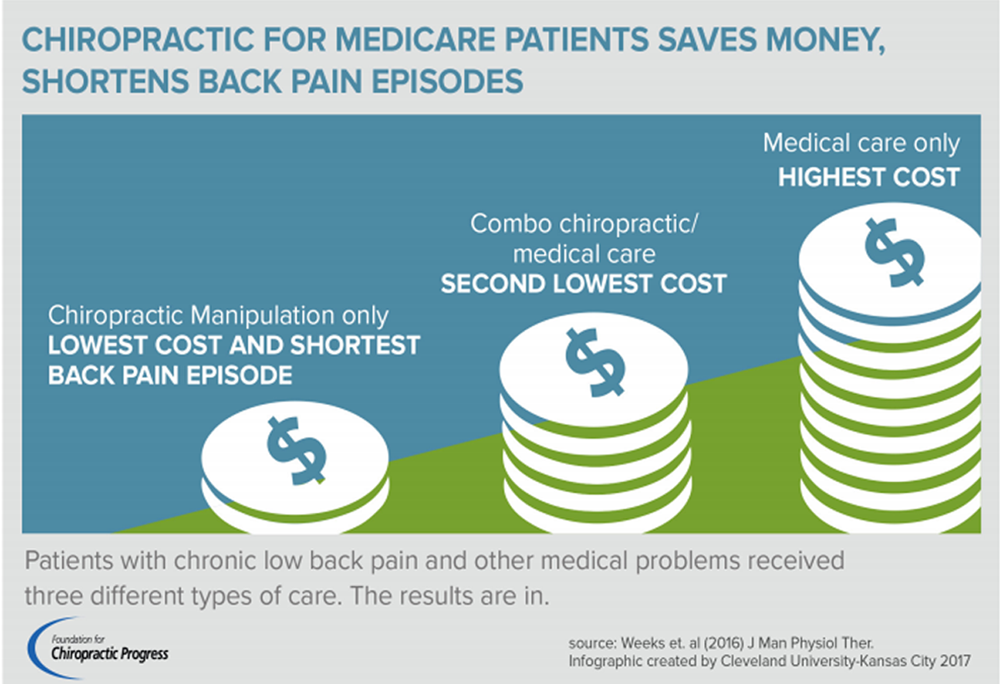
FROM: Weeks ~ JMPT 2016 (Feb) Hurwitz ~ JMPT 2016 (May)OBJECTIVES: The purpose of the study was to compare utilization and charges generated by medical doctors (MD), doctors of chiropractic (DC) and physical therapists (PT) by patterns of care for the treatment of low back pain in North Carolina.
METHODS: This was an analysis of low-back-pain-related closed claim data from the North Carolina State Health Plan for Teachers and State Employees from 2000 to 2009. Data were extracted from Blue Cross Blue Shield of North Carolina for the North Carolina State Health Plan using International Classification of Diseases, 9th Revision diagnostic codes for uncomplicated low back pain (ULBP) and complicated low back pain (CLBP).
RESULTS: Care patterns with single-provider types and no referrals incurred the least charges on average for both ULBP and CLBP. When care did not include referral providers or services, for ULBP, MD and DC care was on average $465 less than MD and PT care. For CLBP, MD and DC care averaged $965 more than MD and PT care. However, when care involved referral providers or services, MD and DC care was on average $1600 less when compared to MD and PT care for ULBP and $1885 less for CLBP. Risk-adjusted charges (available 2006-2009) for patients in the middle quintile of risk were significantly less for DC care patterns.
There are more articles like this @ our:
Cost-Effectiveness of Chiropractic PageCONCLUSIONS: Chiropractic care alone or DC with MD care incurred appreciably fewer charges for ULBP than MD care with or without PT care. This finding was reversed for CLBP. Adjusted charges for both ULBP and CLBP patients were significantly lower for DC patients.
KEYWORDS: Chiropractic; Health Services; Healthcare Costs; Low Back Pain; Medical Care; Utilization
This is one of 3 of the Cost-Effectiveness Triumvirate articles.
From the FULL TEXT Article:
Introduction
1] reported 14.8 million cases in 1997 and 21.9 million in 2006, a 67.6% increase in 6 years. The Centers for Disease Control and Prevention reported that back or spine problems are the second most common cause of disability in the United States, and noted a 7.7% increase in disability cases due to an aging population. [2, 3] Overall, 1% to 2% of adults in the United States are disabled due to back pain. [4] With spine-related disability increasing, the implications on healthcare policy, spending, and identification of cost effective treatment strategies are enormous.
The rise in prevalence of back pain and increased utilization of healthcare services are driving the costs of the back pain epidemic upward. Martin et al [5] compared the medical costs of 22,258 participants with and without spine problems from 1997 to 2005, adjusting for age and gender. Those with spine problems exhibited a 65% higher increase in medical expenditures from $4,695 in 1997 to $6,096 in 2005 per person. Martin et al also reported that the largest proportion of increasing per user medical expenditures for spine-related problems were forinpatient hospitalizations (37%),
outpatient costs (18%),
prescription drugs (139%), and
emergency room visits (84%). [1]Patients with back pain are most often seen by medical doctors (MD), doctors of chiropractic (DC), physical therapists (PT) and medical specialists to which they are referred. [6] Annual expenditures for MD, DC, and PT care combined have been estimated to range from $84.1 billion to $624.8 billion for low back problems in the United States. [7] Increased costs can be attributed to inflation, an increase in the numbers of office visits to each of these providers, and increases in annual per user expenditures as a result of the mix of services (imaging, specialty interventions, etc). From 1999 to 2008, yearly average inflation-adjusted medical expenditures for patients with primary diagnoses of back or neck conditions rose from $487 to $950 (a 95% increase), mostly due to the steeply rising costs associated with medical specialists and physical therapy services. [8] Chiropractic care experienced a 57% increase in patient visits from 2000 to 2003 in the US, while the mean costs per patient and per chiropractic office visit have remained stable over time. [9]
The aim of this study was to assess the utilization and cost of care patterns for low back pain among patients in the North Carolina State Health Plan (NCSHP) for Teachers and State Employees from 2000 to 2009. We compared the cost of care of these patterns of care:patients who utilized MDs and DCs alone,
MD and DC care in combination with each other,
MD or DC care in combination with PT,
and/or with additional referred provider care.
DISCUSSION
Low back pain is a highly prevalent condition that has created a substantial economic burden in the United States. Previous research has shown large increases in utilization and expenditures for the management of low back pain nationally throughout the 2000-2009 decade. [1, 5, 8, 13] These findings provide further evidence of this upward trend in North Carolina. The numbers of claims and charges increased in the NCSHP population, with claims rising 139% and 181% and total annual allowed charges increasing 242% and 282% for ULBP and CLBP, respectively. Average total allowed charges increased by 45% for ULBP and 38% for CLBP. Utilization of all care patterns increased but rose most dramatically for care involving MDs, PTs, and referral providers. The reasons for these steep increases are not entirely clear and probably represent a combination of factors such as increased prevalence of chronic LBP, changes in beliefs about pain and its management, as well as changes in the treatments used. [4]
In our study, patterns of care involving referral providers (eg, radiology, surgical, and acute care facilities) generally incurred the largest charges; however there were important differences found between specific care patterns. When comparing the average charges over the decade for the DC-referral and MD-referral combination, the pattern including DC care incurred fewer total charges per patient. Similar results were found when considering the combination of MD-DC-referral care that incurred fewer total charges per patient than MD-PT-referral care.
These cost differentials held in the risk-adjusted models where the mean charges for 2006-2009 reflected appreciably lower average charges for patients in DC patterns of care. These findings are consistent with a study by Davis et al., which used data from the Medical Expenditure Panel Survey between 1998 and 2008. [8] In that study, the authors suggest that the primary driver of increased spine care expenditures over time was not due to changes in DC or primary care expenditures, but instead resulted from a significant increase in specialty (non-primary care physician) medical care services. [8]
When evaluating the patterns of care that did not involve referral providers, we found important differences based on provider composition. On average over the decade, the combination of MD-DC care for the treatment of ULBP incurred fewer total charges per patient than MD-PT care. This relationship was reversed for CLBP, where the combination of MD-DC care incurred greater total charges per patient than the combination of MD-PT care. However, when relevant patient factors where accounted for in the risk-adjusted models, the charges for 2006 to 2009 were found to be less for MD-DC care than for MD-PT care. Similarly, when comparing MD-only to DC-only patterns of care, MD-only care was more expensive than DC-only care for ULBP and CLBP.
Our findings are consistent with findings from other population-based studies that have investigated the costs associated with low back pain management. Several studies have shown an association between chiropractic care and lower utilization of costly spine services such as all-class medications, diagnostic imaging, spinal injections, and surgery. [14-16] Two of these studies evaluated the cost of low back pain management when DCs were the first provider seen for an episode of care. In both studies when a DC was the portal of entry provider, the total cost was lower when compared to low back pain patients that had other entry points into the healthcare delivery (eg, physical therapy, medical specialty, etc) system. [15] Another study in a commercially insured population showed low back pain episodes initiated with DCs cost 20% less than those initiated with physicians. [17] Our findings and these other studies provide evidence suggesting that DCs can play an important role in the cost-effective management of low back pain populations and can be an integral resource to patients, providers, and policy makers.
Patients are now being asked to take on greater financial responsibility through higher premiums, deductibles, and copayments. For example, 23% of employers now offer high deductible benefit plans where the lowest family deductible starts at $2500. [18] Further evidence of this trend can be seen in the new benefit options brought about by the Affordable Care Act where patients are responsible for 40% of their medical costs in the Bronze Plan. [19] Patients must now make important and informed choices about the costs associated with their use of healthcare services. In most instances, patients are free to access directly primary and specialty medical physicians, physical therapists, and chiropractors. Our findings can help patients to recognize potential economic ramifications when choosing a provider for low back pain management.
Providers are also being impacted financially by changes in the healthcare reimbursement system, which is moving away from the traditional fee-for-service model. According to a recent survey on healthcare payment reform, 40% of all commercial in-network payments are now value-oriented, meaning they are tied to provider performance or designed to reduce unnecessary utilization and costs. [20] Given the rate of adoption of these reimbursement methods, it is anticipated that nearly 70% of all payments will be value-based by 2020. [21] Importantly, the majority of these value-oriented payments currently put providers at financial risk for their performance. [20] As providers accept more risk, they will start taking a new look at how they can more efficiently manage their patient populations. Our findings suggest that efficiency gains may be obtained through the integration of chiropractors into an inter-professional model of care for the low back pain population.
Policy makers are beginning to use levers that incent the use of lower cost services for the management of LBP, such as DC care, to mitigate the rising cost associated with specialty/referral care. As stated earlier, specialty medical services have been identified as a significant driver of spine care costs. However, despite the greater use of specialty services from 1998 and 2008, investigators have noted that self-reported measures of mental health, well-being, physical functioning, and work, school or social limitations had worsened during this time period in the low back pain population. [5] Therefore, it does not appear that the health status of individuals with spine disorders has improved, despite greater use of specialty services with their associated increased cost. [8]
Incenting the use of DC care through patient copayment reductions may be one mechanism to curb the high utilization of specialty/referral care. This is necessary because previous studies have shown chiropractic care to be very sensitive to patient cost-sharing. [22, 23] The RAND Health Insurance Experiment found that use of chiropractic care (ie, access) was cut in half (odds ratio = 0.49) when patient cost-share was 25% or more of the visit cost. [22] Therefore, the current trend towards higher patient cost-sharing may be driving patients away from the lower cost chiropractic services and towards more expensive patterns of care.
In 2007, the North Carolina legislature reversed a mandate requiring that the same copayment amount apply equally to primary medical care and chiropractic care in the NCSHP population. Following the legislative repeal of this mandate, the NCSHP implemented a new policy in October of that year treating chiropractic care as a specialty service. This policy change increased the copayments for DC visits by 20% to 100%, thereby creating a substantial cost-share disparity between primary care and chiropractic. Throughout the decade, the combined charges for complicated and uncomplicated low back pain in 2000 were 36.1 million dollars, which had escalated to 107 million dollars by 2006.
However, there was a noticeable break in this upward trend the following year when in 2007 the total allowed charges dropped to 105.6 million dollars. Following the policy change in late 2007, which raised DC copayments to specialty levels, there was resumption in an upward trend of the total allowed charges for LBP. This trend increased upward in 2008 to 118 million dollars, and eventually rose to 130.2 million dollars in 2009 (Figure 1). Exploring the temporal association of this policy (legislative repeal) decision to raise DC copayments, along with its effects on utilization and charges, was beyond the scope of this current analysis and will be the focus of our future work.
Limitations
There are methodologic challenges inherent in the analysis of health insurance databases. For this study, these challenges arise in the form of: inability to control for tiering; possible inaccuracy of diagnostic, management and treatment codes; and lack of availability of risk factors for a portion of the analysis. All of these factors could affect the comparability between groups, and potentially create provider under-representation. An additional limitation was that our analysis was limited only to patients from the NCSHP in North Carolina. However, the population demographics of North Carolina during this time frame were approximately the same as national demographics. [24] Therefore, the results may be generalizable to other populations. In addition, as other studies have also mentioned, [1] our estimates might be conservative as they do not account for healthcare use related to comorbidities that might be common among patients with spine disorders (eg, psychological distress, other pain complains, etc). The objective of this study was to compare use and charges of low back pain care in patients with a primary low back pain diagnosis.
Study Strengths
A major strength of the study was the large amount of low back pain claims made available to us for analysis. The data were from 3,159,362 claims generated by approximately 66,0000 persons over the 2000-2009 decade in North Carolina, in several different pathways of healthcare services. This study and the series of papers it has generated on the treatment of low back pain, neck pain [25] and headache, [26] provides unique economic examination for healthcare policy makers and legislators.
When costs are viewed vertically as if in “silos” (eg, DC-only costs, MD-only costs), increasing utilization of one particular provider is seen as a net cost increase. However, when costs are viewed across the silos, as this study has done, an increase in utilization of one provider group can result in a net cost decrease given its effect on the patient population. This is an opportunity to view costs laterally versus a confined, vertical analysis.
CONCLUSION
This study confirms that overall utilization and charges for the treatment of low back pain increased dramatically over the decade 2000-2009 in North Carolina. For uncomplicated low back pain without referral care, charges for MD-DC care were on average less than charges for MD-PT care. For complicated low back pain without referral care, average charges are greater for MD-DC care than average charges for MD-PT care. For both uncomplicated and complicated low back pain with additional referral care, charges are consistently less for MD-DC care than charges for MD-PT care. The utilization of chiropractic care appears to play an important role in the management of populations with low back pain.
Practical Applications
This study found that utilization and expenditures for treatment
of low back pain (LBP) in North Carolina have increased
dramatically over the decade 2000 to 2009.MD and DC care alone with no referrals are the least expensive
patterns of low back pain care.DC care alone or with MD care incurs appreciably fewer charges
for uncomplicated low back pain than MD care with or without
PT care.
References:
Martin, BI, Turner, JA, Mirza, SK, Lee, MJ, Comstock, BA, and Deyo, RA.
Trends in Health Care Expenditures, Utilization, and Health Status
Among US Adults With Spine Problems, 1997-2006
Spine (Phila Pa 1976). 2009 (Sep 1); 34 (19): 2077–2084McNeil, JM, Binette, J, and CDC.
Prevalence of Disabilities and Associated Health Conditions
Among Adults --- United States, 1999
MMWR Morb Mortal Wkly Rep. 2001 (Feb 23); 50 (7): 120-125Prevalence and Most Common Causes of Disability
Among Adults --- United States, 2005
MMWR Morb Mortal Wkly Rep. 2009 (May 1); 58 (16): 421-426Friedly, J, Standaert, C, and Chan, L.
Epidemiology of spine care: the back pain dilemma.
Phys Med Rehabil Clin N Am. 2010; 21: 659–677Martin, BI, Deyo, RA, Mirza, SK et al.
Expenditures and Health Status Among Adults With Back and Neck Problems
JAMA 2008 (Feb 13); 299 (6): 656–664Haldeman S, Dagenais S.
A Supermarket Approach to the Evidence-informed Management of Chronic Low Back Pain
Spine Journal 2008 (Jan); 8 (1): 1–7Dagenais S, Caro J, Haldeman S.
A Systematic Review of Low Back Pain Cost of Illness Studies
in the United States and Internationally
Spine J 2008 (Jan); 8 (1): 8–20Davis MA, Onega T, Weeks WB, Lurie JD.
Where the United States Spends its Spine Dollars: Expenditures on Different Ambulatory Services
for the Management of Back and Neck Conditions
Spine (Phila Pa 1976). 2012 (Sep 1); 37 (19): 1693–1701Davis, MA, Sirovich, BE, and Weeks, WB.
Utilization and Expenditures on Chiropractic Care in the United States
from 1997 to 2006
Health Serv Res. 2010 (Jun); 45 (3): 748-761Dunn, KM, Hestbaek, L, and Cassidy, JD.
Low back pain across the life course.
Best Pract Res Clin Rheumatol. 2013; 27: 591–600Smith M.
Identifying Episodes of Back Pain Using Medical Expenditures Panel Survey Data:
Patient Experience, Use of Services, and Chronicity
Journal of Manipulative and Physiological Therapeutics. 2010;33(8):562–575SAS Institute.
SAS (release 9.2) statistical software. ; 2012 ([Cary, NC])Smith, M, Davis, MA, Stano, M, and Whedon, JM.
Aging Baby Boomers and the Rising Cost of Chronic Back Pain:
Secular Trend Analysis of Longitudinal Medical Expenditures
Panel Survey Data for Years 2000 to 2007
J Manipulative Physiol Ther. 2013 (Jan); 36 (1): 2–11Ivanova, JI, Birnbaum, HG, Schiller, M, Kantor, E,
Johnstone, BM, and Swindle, RW.
Real-world practice patterns, health-care utilization, and costs in patients
with low back pain: the long road to guideline-concordant care.
Spine J. 2011; 11: 622–632Allen, H, Wright, M, Craig, T et al.
Tracking Low Back Problems in a Major Self-Insured Workforce:
Toward Improvement in the Patient's Journey
J Occup Environ Med. 2014 (Jun); 56 (6): 604-620Legorreta, AP, Metz, RD, Nelson, CF, Ray, S, Chernicoff, HO, and Dinubile, NA.
Comparative Analysis of Individuals With and Without Chiropractic Coverage:
Patient Characteristics, Utilization, and Costs
Archives of Internal Medicine 2004 (Oct 11); 164 (18): 1985–1892Liliedahl RL, Finch MD, Axene DV, Goertz CM.
Cost of Care for Common Back Pain Conditions Initiated With Chiropractic
Doctor vs Medical Doctor/Doctor of Osteopathy as First Physician:
Experience of One Tennessee-Based General Health Insurer
J Manipulative Physiol Ther 2010 (Nov); 33 (9): 640–643Kaiser Family Foundation. 2013 Employer Health Benefits Survey.
Available from:
http://kff.org/private-insurance/report/2013-employer-health-benefits/
Updated August 20, 2013. Accessed October 1, 2015.Healthcare.gov.
How to pick a health insurance plan: The ‘metal' categories:
Bronze, Silver, Gold & Platinum.
Available from:
https://www.healthcare.gov/choose-a-plan/plans-categories/
Accessed October 1, 2015.Catalyst for Payment Reform (CPR).
Catalyst for Payment Reform (CPR) National Scorecard on Payment Reform.
([Internet]; c2015 [cited 2015 October 1]. Available from:)
http://www.catalyzepaymentreform.org/images/documents/nationalscorecard2014.pdfMcKesson Health Solutions.
McKesson Health Solutions: The State of Value-Based Reimbursement and
the Transition from Volume to Value in 2014.
Available from:
http://mhsinfo.mckesson.com/rs/mckessonhealthsolutions/images/
MHS-2014-Signature-Research-White-Paper.pdf
Accessed October 1, 2015.Shekelle, PG, Rogers, WH, and Newhouse, JP.
The effect of cost sharing on the use of chiropractic services.
Med Care. 1996; 34: 863–872Stevans, JM and Zodet, MW.
Clinical, demographic, and geographic determinants of variation in
chiropractic episodes of care for adults using the 2005-2008
Medical Expenditure Panel Survey.
J Manipulative Physiol Ther. 2012; 35: 589–599Kff.org.
North Carolina: Demographics and Economy.
([Internet]; c2015 [cited 2015 October 1])
Kaiser Family Foundation, Menlo Park, CA; 2013
([updated November 10, 2013].
Available from:
http://kff.org/state-category/demographics-and-the-economy/?state=NCHurwitz, EL, Li, D, Schneider, MJ et al.
Variations in Patterns of Utilization and Charges for the Care of Neck Pain
in North Carolina, 2000 to 2009: A Statewide Claims' Data Analysis
J Manipulative Physiol Ther. 2016 (May); 39 (4): 240–251
This is one of 3 of the Cost-Effectiveness Triumvirate articles.Hurwitz, EL, Vassilaki, M, Li, D et al.
Variations in Patterns of Utilization and Charges for the Care of Headache
in North Carolina, 2000 to 2009: A Statewide Claims' Data Analysis
J Manipulative Physiol Ther. 2016 (May); 39: 229–239
This is one of 3 of the Cost-Effectiveness Triumvirate articles.
Return to MEDICARE
Return to LOW BACK PAIN
Return to COST-EFFECTIVENESS
Return to INITIAL PROVIDER/FIRST CONTACT
Since 5–17–2016
| Home Page | Visit Our Sponsors | Become a Sponsor |
Please read our DISCLAIMER |