Fig 1
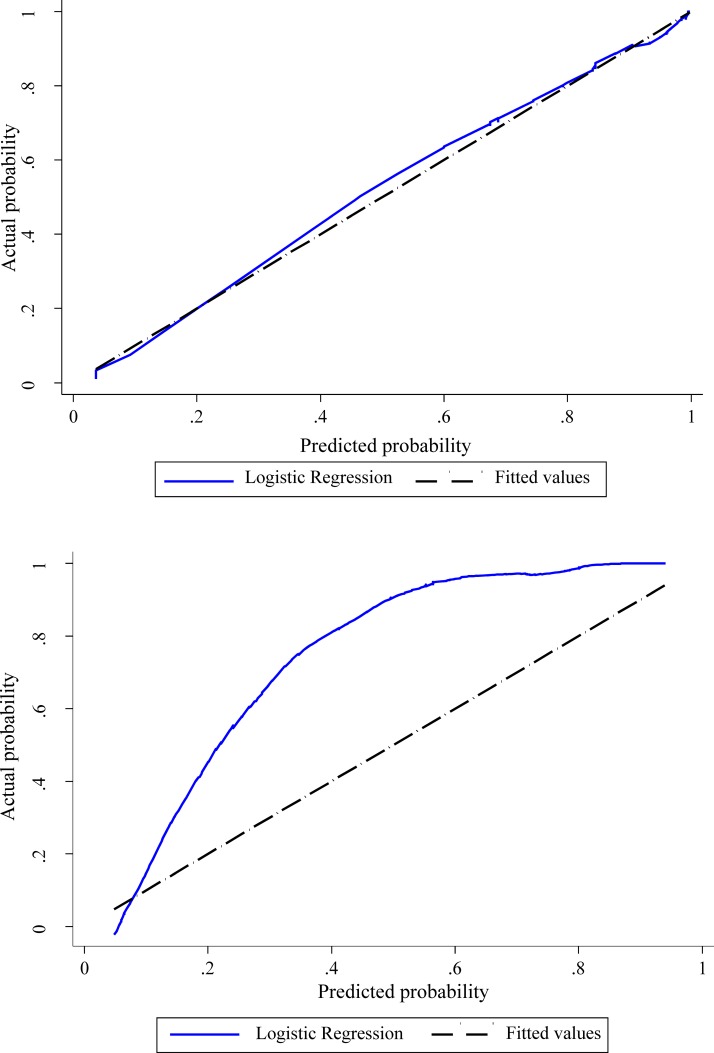
Calibration plot for model (i) and model (ii).
Model (i) calibration shown in upper graph, model (ii) calibration shown in lower graph. The solid line is a smoothed curve that represents an estimate of the relation between the predicted and the observed probability of sciatica diagnosis. Ideally this line fits the dotted line that represents perfect calibration.