

Trajectories of Acute Low Back Pain:
A Latent Class Growth AnalysisThis section is compiled by Frank M. Painter, D.C.
Send all comments or additions to: Frankp@chiro.org


Figure 1 (please refer to the Full Text for the figures) displays the proportion of subjects reporting none, low–moderate, or high pain at each timepoint for each cluster in the 5-cluster LCGA model. Figure 2 displays the mean pain course for the 5-cluster LCGA model.FROM: Pain. 2016 (Jan); 157 (1): 225–234 ~ FULL TEXT
Aron S. Downie, Mark J. Hancock, Magdalena Rzewuska, Christopher M. Williams,
Chung-Wei, Christine Lin, Christopher G. Maher
George Institute for Global Health,
University of Sydney,
Sydney, Australia
Characterising the clinical course of back pain by mean pain scores over time may not adequately reflect the complexity of the clinical course of acute low back pain. We analysed pain scores over 12 weeks for 1585 patients with acute low back pain presenting to primary care to identify distinct pain trajectory groups and baseline patient characteristics associated with membership of each cluster. This was a secondary analysis of the PACE trial that evaluated paracetamol for acute low back pain. Latent class growth analysis determined a 5 cluster model, which comprised:
567 (35.8%) patients who recovered by week 2 (cluster 1, rapid pain recovery)
543 (34.3%) patients who recovered by week 12 (cluster 2, pain recovery by week 12)
222 (14.0%) patients whose pain reduced but did not recover (cluster 3, incomplete pain recovery)
167 (10.5%) patients whose pain initially decreased but then increased by week 12 (cluster 4, fluctuating pain); and
86 (5.4%) patients who experienced high-level pain for the whole 12 weeks (cluster 5, persistent high pain).Patients with longer pain duration were more likely to experience delayed recovery or nonrecovery. Belief in greater risk of persistence was associated with nonrecovery, but not delayed recovery. Higher pain intensity, longer duration, and workers' compensation were associated with persistent high pain, whereas older age and increased number of episodes were associated with fluctuating pain. Identification of discrete pain trajectory groups offers the potential to better manage acute low back pain.
From the FULL TEXT Article:
Introduction
Low back pain (LBP) is a major cause of disability [36] and is an extremely common condition presenting to primary care. [3, 28, 45] Most guidelines for acute LBP advise a minimal treatment approach on the premise that the clinical course is typically favorable. [28] When patients are considered as a group, this optimistic view seems consistent with the research evidence. [35, 41] For example, a systematic review of 15 cohort studies reported pooled mean pain scores, on a 0 to 100 scale of 52, 23, 12, and 6at baseline, 6, 12, and 52 weeks follow-up, respectively. [41] However, the review also noted a moderate degree of person-to-person variability with the SD of pain and disability outcomes typically approximately 20 points on a 0 to 100 scale at all follow-uptime points. [41] The large variability in outcomes at each time point suggests that it may be overly simplistic to describe the clinical course of LBP by only considering the group mean over time.
There has been recent interest in studying the clinical course of individual patients with LBP. [4, 8, 14] For example, Dunn et al. [14] studied 342 patients from primary care with back pain over 1 year using latent class analysis. The method identified 4 clusters that differed across pain status and impact, disability, and psychological characteristics. However, the study provided little detail about the early pain course and enrolled a mixed cohort of patients who may not adequately describe the acute pain experience. Recently, Kongsted et al. [29] studied 1,082 patients from primary care by text messaging using latent class analysis to reveal clusters of LBP. The study also enrolled a mixed cohort of patients with more than half reporting leg pain and a low recovery rate at 12 weeks (54%) when compared with other studies. [9, 17, 18] The authors comment that more appropriate clustering techniques may exist for longitudinal data, such as latent class growth analysis (LCGA). [44] Given that the group level course of acute and chronic LBP is quite different, it is likely that pain trajectory groupings identified in chronic and mixed duration samples are not the same as those in acute LBP.
To date, no research has studied individual pain trajectories exclusively in acute LBP using data from a large inception cohort. Understanding the patient traits that areassociated with each pain trajectory group could advance understanding of the mechanism(s) underlying the trajectories and also assist in developing targeted therapies for each trajectory. The aim of this study was to identify pain trajectory groups for patients with acute LBP presenting to primary care and then to explore individual characteristics that influenced group membership. We hypothesized that for each trajectory group identified, membership would be associated with clinical and demographic characteristics measured at baseline.
Methods
Our interest was in the trajectories of patients’ pain during thecourse of an episode of acute LBP. We used statistical procedures to(1) identify these trajectories and
(2) characterise membership of each trajectory using baseline patient characteristics.
The datawere taken from a previous trial. [52]
Data source
This is a secondary analysis of the PACE trial, [52] a placebo-controlled trial of paracetamol for acute LBP. In brief, 235 primary care clinicians screened 4,606 consecutive patients who sought care for an episode of acute LBP (6 weeks duration and of at least moderate-intensity pain as defined by item 7 of the Short Form Health Survey, SF-36). A total of 1,652 subjects were recruited from across Sydney, Australia, during 2009 to 2012, and pain outcomes were measured regularly over the following 12 weeks. There was no difference found in pain (or other) outcomes for those receiving paracetamol vs placebo. Baseline information was recorded by research staff through telephone interview and occurred within 48 hours after the initial primary care consultation, before study entry and randomization. Follow-up data at 1, 2, 4,and 12 weeks were contemporaneously recorded into a booklet by the subject and then transcribed through a telephone interview with research staff or directly into an online database by thesubject. [52] A detailed description of the trial methods can be foundin the PACE study protocol [50] and statistical analysis plan. [51]
Analysed participant characteristics
Our primary outcome was pain intensity numerical rating scale (NRS) values, which were collected at 1, 2, 4, and 12 weeks. In addition, baseline demographic (age, sex, and compensation status) and clinical data (pain level, duration and referral beyond knee, number of previous episodes, days of reduced activity, perceived risk of persistence, sleep quality, quality of life, and disability) were extracted from the PACE data set.
Statistical analysis
The analysis assumed that there exist a number of distinct and unobserved trajectory groups for acute LBP that are revealed by the patterns of recorded pain level data across 5 time points. The data analysis comprised 3 steps. First, a LCGA model for ordinal data was established to identify the minimum number of clusters that explained variation in the data (step 1). Second, each subject was assigned to one of the identified clusters (step 2). [25, 38] Finally, multinomial logistic regression was applied to assess the relationship between cluster membership and baseline characteristics (step 3). [37] Internal (bootstrap) validation of the regression model was undertaken. [42]
Latent class growth analysis
Pain course was modeled over time using pain scores at 5 timepoints (baseline, week 1, 2, 4, and 12). A requirement of LCGA is normal distribution of the dependent variable. [6] Pain score distribution was non-normal at each time point. The solution was to trichotomize pain scores analogous to the method described by others, [13, 14, 43] with cut points used previously. [19, 26, 48, 50] This resulted in “pain recovery” (NRS #1); “low–moderate pain” (NRS #2-4); and “high pain” (NRS #5) strata.
Latent class growth analysis uses maximum likelihood to assign subjects to a cluster, so missing values are handled without need for imputation. We excluded subjects missing greater than 2 of the 5 time points. Up to an 8-cluster solution was considered, with the optimum number of clusters determined using goodness of fit criteria, namely, Akaike’s information criterion (AIC); Bayesian information criterion (BIC); and the bootstrap likelihood ratio test. [25, 39]
Pragmatic consideration included high entropy [7] and high average posterior probability of belonging to each cluster [24]; a minimum cluster size of 5%; and a distinctive pain course for each trajectory. [39] |
Multinomial logistic regression analysis

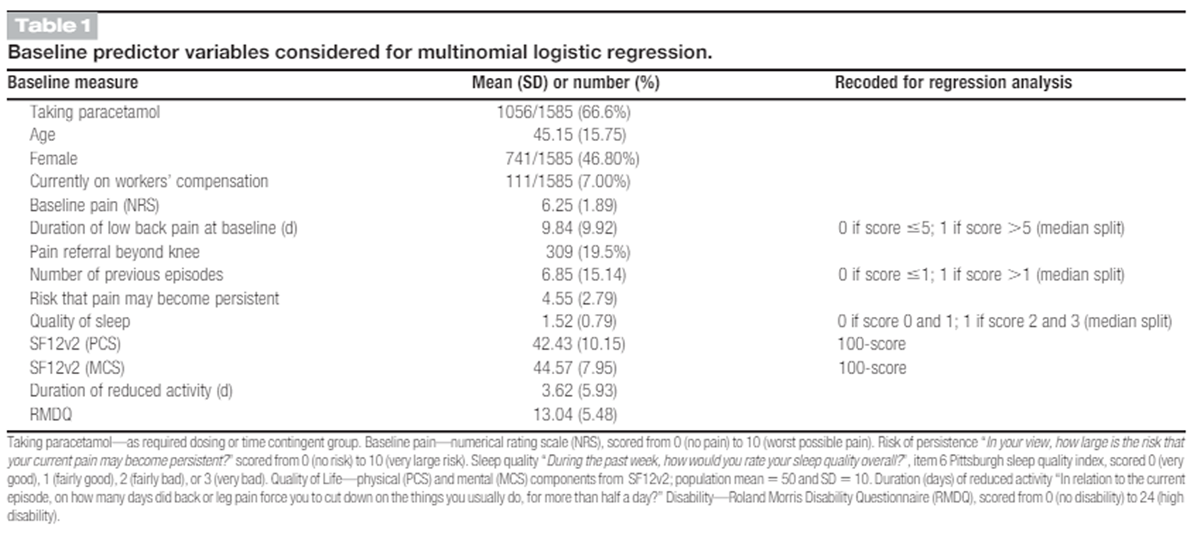
Table 1 After pain trajectories and subject membership were determined, multivariate multinomial logistic regression analysis was used to determine the characteristics of each cluster with the strength of the relationship determined using proportional classification for all subjects. [2, 47] The risk of belonging to each cluster for a given characteristic was compared to the base cluster (defined by the cluster with most rapid recovery) and expressed as a relative risk ratio (RRR). [16] Baseline factors considered important to include in the multivariate regression were those hypothesised to influence cluster membership and were selected a priori (Table 1). Contin-uous baseline variables were expressed as risk per SD increase. Non-normally distributed count and continuous variables were dichotomized. The variables’ duration of current episode, number of previous episodes, and quality of sleep were dichotomized using a median split as other methods using optimal cutpoints are recommended against. [1] Testing for collinearity was performed with tolerance of ,0.1 and variance inflation factor (VIF) #0.2 or $5.0 indicating possible collinearity. [40] Full and reduced unconditional model predictive efficiency was determined by goodness of fit indices, mainly AIC, [34] with the lowest score (AICmin)indicating the better fitting model. Reduced models excluded all combinations ofthe 5 least significant variables found on univariate analysis.
The robustness of the predictors in the multinomial logistic regression model was tested using Monte Carlo modelling (non-naive bootstrap). [30, 42] The study population parameters (estimates of relative risk per cluster pair) were compared to 1,000 bootstrap replications of the study data. [21] The threshold for nonignorable bias was set at 0.25 3SE of the bootstrap sample. [15, 21] STATAversion 13.1 for Mac OS (Stata Corp, College Station, TX) was used to analyse model collinearity, and Mplus version 7.31 (Muth´en &Muth ´en, Los Angeles, CA) was used to generate the LCGA, multivariate regression, and bootstrap validation models
Results
Sample characteristics
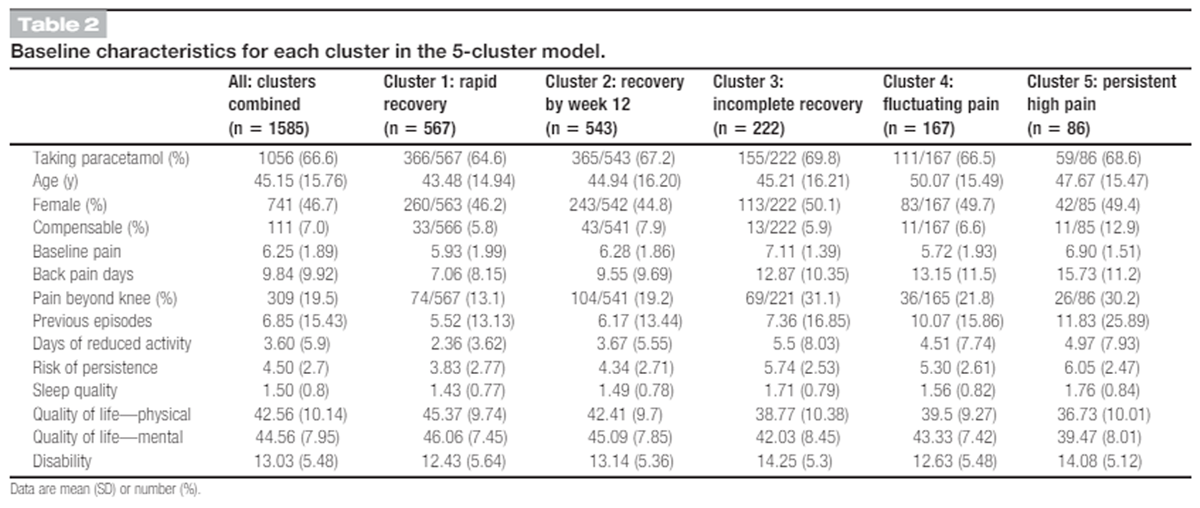
Table 2 Overall, of the 1,652 individuals enrolled in PACE, 4.1% (n = 67) were excluded from this study on the basis of missing greater than 2 of 5 pain scores. Pain scores were then available for the remaining 95.9% (n = 1,585) of subjects at baseline. Of these, 98.9% (n = 1,568), 99.1% (n = 1,570), 97.4% (n = 1,543), and 96.0% (n = 1,522) were recorded for weeks 1, 2, 4, and 12, respectively. Table 2 displays baseline characteristics for included subjects stratified by cluster for the final 5-cluster LCGA model.
Latent class growth analysis (selection of ideal numberof clusters)
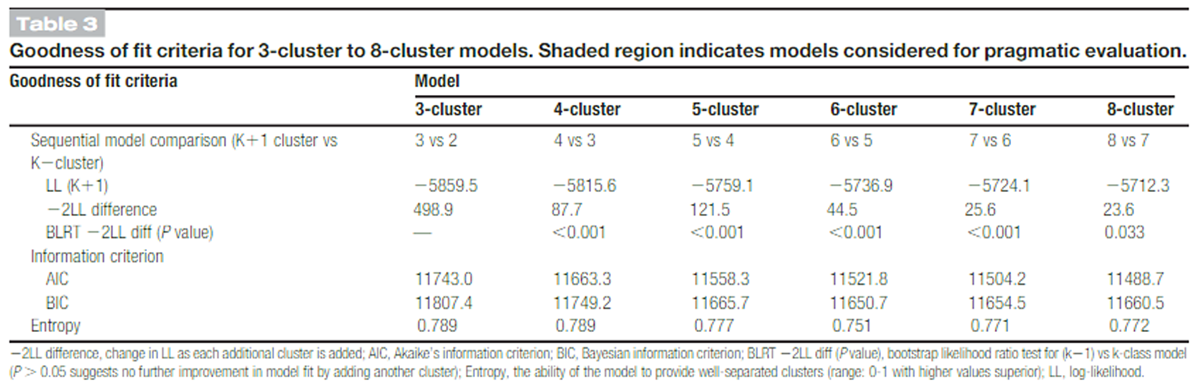
Table 3 The 3-cluster to 8-cluster models were tested using goodness of fit indices to determine the best model and are displayed in Table 3. The rate of change in log likelihood diminished rapidly after the 5-cluster model (-2LL difference = 498.9, 87.7, 121.5, 44.5, 25.6, and 23.6 for 3-8 cluster models, respectively), whereas the bootstrap likelihood ratio test indicated up to an 8-cluster model was possible (P value approached nonsignificance, P = 0.033). Fit statistics reached minima for the 8-cluster (AIC min = 11,488) and 6-cluster (BICmin = 11,651) models,respectively. Entropy was adequate for all solutions (0.79, 0.79,0.78, 0.75, 0.77, and 0.77 for 3-cluster to 8-cluster models, respectively). Given these results, the 4-cluster to 6-cluster models warranted further (pragmatic) evaluation. [25]
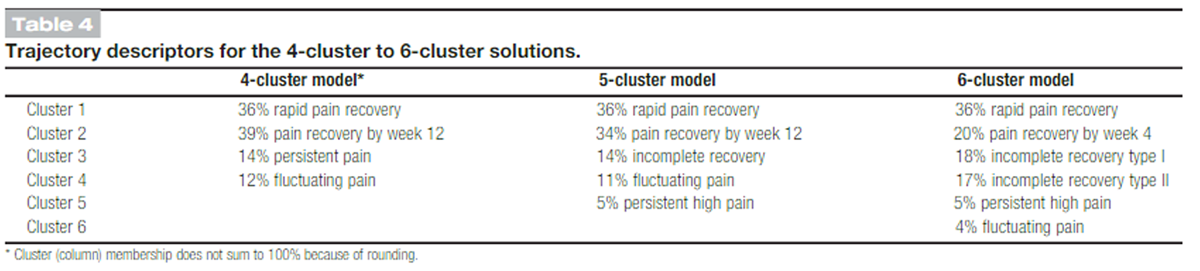
Table 4 For each of the 4-cluster to 6-cluster models, the lowest average posterior probabilities were 0.86, 0.82, and 0.74, with minimum cluster membership of 11.6%, 5.4%, and 4.2%, respectively. Table 4 details descriptors for the 4-cluster to 6-cluster models to aid in assessment of model distinctiveness. All models displayed 1 stable rapid recovery cluster. There was variation in the proportion of delayed, incomplete, persistent high, and fluctuating pain recovery clusters with decreasing membership at higher levels of pain persistence as successive clusters were added. For example, the 5-cluster model was the first to identify persistent high pain with 86 subjects, a potentially important subgroup. Beyond the 5-cluster model, no increase in clinically distinct subgroups was identified. For example, the 6-cluster model divided the number of incomplete recovery clusters into 2, which added unnecessary complexity. Therefore,the 5-cluster model was chosen and satisfied efficiency, parsimony, and its ability to identify 5 discrete pain courses.
The 5-cluster model comprisedcluster 1, rapid pain recovery (n = 567; 35.8%)
cluster 2, pain recovery by week 12 (n = 543; 34.3%)
cluster 3, incomplete pain recovery (n = 222; 14.0%)
cluster 4, fluctuating pain (n = 167; 10.5%), and
cluster 5, persistent high pain (n = 86; 5.4%).Cluster 1 (rapid pain recovery) was characterized by an early rapid decrease in the proportion of subjects who reported any pain over the first 4 weeks (39%, 0%, and 0% at weeks 1, 2, and 4). At week 12, all subjects reported pain recovery. Subjects in cluster 1 reported a large decrease in their mean pain score overthe first 2 weeks (25.7; SD 51.5).
Cluster 2 (pain recovery by week 12) was characterized by a decrease in the proportion of subjects who reported any pain over the first 4 weeks (93%, 83%, and 33% at weeks 1, 2, and 4). By week 12, all subjects had pain recovery. Subjects in cluster 2 reported a moderate decrease in mean pain over the first 2 weeks (23.3; SD 50.1).
Cluster 3 (incomplete pain recovery)was characterized by a decrease in the proportion of subjects who reported high pain over 12 weeks (95%, 82%, 38%, and 4% at weeks 1, 2, 4, and 12) with a reciprocal increase in the proportion of low–moderate pain over the same period (5%, 18%, 61%, and 77%). At week 12, the LCGA model classified 19% (n = 41) of subjects who reported no pain at week 12 into this cluster. This was due to classification based on subjects’ trajectory regardless of recovery status(unconditional LCGA model). Subjects in cluster 3 reported only a small decrease in mean pain over the first 2 weeks (21.5; SD 50.3).
Cluster 4 (fluctuating pain) was characterized by a diminishing proportion of subjects who reported any pain over the first 4 weeks(93%, 80%, and 66% at weeks 1, 2, and 4), followed by all subjects reporting increased pain at week 12. At week 12, no subject had pain recovery. Mean pain course over the first 4 weeks for subjects classified with fluctuating pain was similar to those classified with pain recovery by week 12, but with an increase in mean pain score between week 4 and week 12 (1.9; SD 50.5).
Cluster 5 (persistent high pain) was comprised entirely subjects who reported high pain over the first 4 weeks (98%, 100%, and 100% at weeks 1, 2, and 4). At week 12, all subjects continued to report high pain. Subjects in cluster 5 reported negligible change in mean pain scores over the first 2 weeks (0.0; SD 50.2), with only marginal decrease in mean pain over the whole study period (20.4; SD 50.2).
Multinomial logistic regression
Multivariate multinomial logistic regression models compared baseline characteristics of all subjects between clusters, with rapid pain recovery (cluster 1) as a reference. There was low chance of collinearity (tolerance range = 0.62-0.96; mean VIF = 1.28) when all variables were included. The AIC statistic that evaluated model best fit achieved a minimum value after removal of the variables “trial allocation,” “quality of sleep,” and “disability”(AICmin = 2,894) compared with the full model (AIC = 2,913). Change in regression coefficients between the reduced and full models ranged from 0% (age) to 5.5% (quality of life physical subscale). Given the low chance of collinearity and marginal difference in magnitude of regression coefficients between full and reduced models, we were able to retain all a priori hypothesized predictors. The final model included baseline measures of age, sex, compensation status, pain (intensity, duration, number of previous episodes, and pain beyond the knee), duration of reduced activity, perceived risk of persistence, quality of sleep, quality of life, disability, and trial group allocation.
Internal validation of the regression model, which used the difference in parameter estimates (bias) between the study sample and average of 1,000 bootstrap samples for all covariates in each cluster pair, was of lesser magnitude than the threshold set for nonignorable bias (equal to 0.25 X SE of bootstrap data). [15, 21] Compared to the study sample, the risk ratio for all variables in the bootstrap sample was in the same direction and of similar magnitude. Bootstrapping had the effect of changing some marginally nonsignificant variables in the original analyses to significant in the bootstrapped analyses but did not result in important changes in the magnitude of the relative risk. For example, when measuring relative risk of pain recovery by week 12 compared to rapid pain recovery, the relative risk for the variable “previous episodes” changed from 1.29 (95% confidence interval [CI], 0.89-1.86) in the original analyses to 1.30 (95% CI, 1.02-1.67) in the bootstrapped analyses.
Risk of belonging to delayed pain recovery clusters compared with rapid pain recovery Figure 3 reveals the relative risk of belonging to each cluster compared to rapid pain recovery. Relative risk ratios for continuous variables are expressed per SD increase in the predictor variable.
Comparison of pain recovery by week 12 (cluster 2) with rapid pain recovery (cluster 1)
Subjects with greater pain duration were 1.81 times more likely (95% CI, 1.17-2.78) to recover by week 12 than have rapid pain recovery. Subjects on workers’ compensation were 2.06 time smore likely (95% CI, 1.03-4.14) to recover by week 12 than have rapid pain recovery.
Comparison of incomplete recovery (cluster 3) with rapid pain recovery (cluster 1)
Subjects with higher baseline pain (RRR = 2.00; 95% CI, 1.45-2.85), of greater pain duration (RRR = 3.41; 95% CI, 1.94-5.97), increase in perceived risk of persistence (RRR = 1.53; 95% CI,1.16-2.07) and decrease in quality of life (mental, MCS) (RRR = 1.44; 95% CI, 1.09-1.94), were more likely to have incomplete pain recovery than have rapid pain recovery.
Comparison of fluctuating pain (cluster 4) with rapid pain recovery (cluster 1)
Subjects of older age (RRR = 1.56; 95% CI, 1.15-2.20), with greater pain duration (RRR = 2.68; 95% CI, 1.36-5.30), who had multiple previous episodes (RRR = 2.75; 95% CI, 1.43-5.31), who believed they were at greater risk of persistence (RRR = 1.74; 95% CI, 1.20-2.63), and who had lower physical (PCS)(RRR = 1.98; 95% CI, 1.31-3.13) and MCS (RRR = 1.40; 95% CI,1.02-1.99) quality of life scores were more likely to experience fluctuating pain than have rapid pain recovery.
Comparison of persistent high pain (cluster 5) with rapid pain recovery (cluster 1)
Subjects who were on workers’ compensation (RRR = 3.84; 95% CI, 1.41-10.43), with higher baseline pain (RRR = 1.88; 95% CI, 1.29-2.84), who had greater pain duration (RRR = 4.89; 95% CI, 2.25-10.62), who believed that they were at greater risk of persistence (RRR = 1.66; 95% CI, 1.12-2.54),and who had lower PCS (RRR = 2.31; 95% CI, 1.46-3.83) and MCS (RRR = 2.06; 95% CI, 1.43-3.08) quality of life scores were more likely to experience persistent high pain than have rapid pain recovery.
Discussion
Summary of main findings
We identified 5 distinct pain trajectory patterns for patients with acute nonspecific LBP presenting to primary care. Two of the identified clusters included subjects who recovered from their pain by 12 weeks but differed substantially in the rate at which pain diminished and time of pain recovery. One cluster comprised subjects whose pain diminished but did not recover by 12 weeks, another cluster comprised subjects with fluctuating pain, and the last contained subjects who experienced persistent high-level pain over the study period. Characteristics for each cluster identified were reported and compared to the rapid pain recovery cluster. Compared to rapid pain recovery, we found subjects who had pain duration of greater than 5 days experienced delayed recovery or nonrecovery by 12 weeks. Similarly, belief in greater risk of persistence was associated with a lack of pain recovery at 12 weeks compared to rapid pain recovery. Higher pain intensity, longer duration, and workers’ compensation were strongly associated with persistent high pain, whereas older age and increased number of episodes were uniquely associated with fluctuating pain when compared to rapid pain recovery.
Strengths and limitations of the study
The key strengths of our study are the large inception cohort (n = 1,585, drawn from original sample of 1,652) recruited from primary care for a new episode of LBP, [52] with substantially complete data (≥ 96%) for 5 time points over 3 months. Robust methodology was used to determine distinct pain trajectory groups with membership. We a priori selected predictors that we believed likely to be important to the pain course, and the large sample size allowed for inclusion of multiple predictors in the multivariate regression model without overfitting.
The low number of subjects on workers’ compensation (n = 102, 7%) influenced the CI for this predictor, but the prevalence was similar to other studies investigating patients with acute LBP presenting to primary care. [10, 12, 22, 46] Although the data originate from a clinical trial, there was no effect of treatment on time to recovery within the trial, and allocation to active or placebo did not discriminate membership between trajectory groups. Monitoring beyond 12 weeks may have helped further define pain trajectories (eg, place more subjects into the fluctuating trajectory group if monitored over a longer period), but we were primarily concerned with exploring latent trajectories for people with acute LBP and believe this information is critical to patients and clinicians. Patterns of recovery identified in other studies that followed patients for 1 year [5, 14] were also identified in our study (rapid recovery, delayed recovery, fluctuation pain, and persistent high pain), suggesting that patterns of persistent pain behavior may be apparent early in the recovery from acute LBP.
This study does not seek to provide prediction of recovery given the study design, but does profile the patient who is more likely to follow one of the identified 5 pain courses. For example, rapid pain recovery membership was associated with episode duration (patients with pain greater than 5 days were nearly twice as likely to recover at 12 weeks vs 2 weeks). Similarly, fluctuating pain membership was associated with older age when compared to rapid pain recovery, but older age was not associated with incomplete pain recovery or persistent high pain trajectory patterns when compared to rapid pain recovery.
Strengths and weaknesses in relation to other studies, discussing important differences in results
This is the first large study to explore pain trajectories for patients with only acute LBP. It extends the previous work in mixed cohorts of patients with acute and chronic LBP by showing that distinct pain trajectory groups are apparent early in the course of the condition. Information on individual pain course is infrequently studied [35] but may be a key to understanding recovery when used as an element within a prognostic framework. [11]
Our study goes beyond previous studies, [4, 8, 14, 27, 31, 43] which have noted different trajectory groupings and differences in membership, by identifying patient characteristics at baseline that associate with pain course compared to ideal (rapid) pain recovery. The large enrollment provided a base category of more than 500 patients who recovered by week 2 to represent rapid pain recovery. We have avoided the problems of previous studies in this area by enrolling an inception cohort rather than sampling prevalent cases [33] and by keeping loss to follow-up to less than 5%, whereas in other studies, loss to follow-up has been as high as 54%.
A number of psychosocial factors have been previously found to be associated with pain trajectory groups (eg, anxiety, [14, 31, 43] depression, [14, 43] and sick leave [14]). In our study, only a few psychosocial factors were available, and so we can make only limited inferences about the impact of psychological characteristics on acute LBP trajectories.
Meaning of the study: implications for clinicians and policymakers
This study provides strong evidence that averaged pain trajectories for all people with LBP, which are widely reported, [35] do not adequately reflect the complexity of the clinical course. The different trajectory patterns potentially represent subgroups, which may logically require quite different interventions. For example, engaging early intensive therapy to address biopsychological factors may be effective for patients likely to follow a persistent pain trajectory, whereas those likely to recover by week 4 may require only watchful waiting or minimal intervention. Patients likely to improve early but then worsen may represent a group prone to recurrence that would benefit from effective strategies to prevent recurrence.
Further research is required to develop simple approaches for clinicians to identify patients likely to belong to a particular cluster and also test if targeting treatments based on likely cluster membership lead to improved outcomes. This study provides further argument that defining chronicity based on time may be overly simplistic, [49] given that differentiation of our persistent high pain group occurred as early as week 2 and had a distinctive baseline profile compared to patients who had rapid pain recovery.
Unanswered questions and future research
A key research question is whether management focused on the patient attributes associated with cluster membership can effectively shift a patient from a less favorable course to a more favorable course or whether the identified pain courses represent patient phenotypes. [20, 23] Another question is whether communicating pain course heterogeneity in a graphical way during the clinical encounter could assist patient understanding of pain course [53] or support recovery through modification of pain beliefs. [32] Further investigation is also required to determine whether simple clinical tools, appropriate for use in clinical practice, can be developed that enable early identification of patients who will follow each trajectory pattern. If this is achieved, it would allow clinicians to provide more individualized information on course to their patients.

Return to LOW BACK PAIN
Return to TRAJECTORIES OF LOW BACK PAIN
Since 5-31-2016
| Home Page | Visit Our Sponsors | Become a Sponsor |
Please read our DISCLAIMER |