

Broad External Validation and Update of a Prediction Model
for Persistent Neck Pain After 12 WeeksThis section is compiled by Frank M. Painter, D.C.
Send all comments or additions to: Frankp@chiro.org


FROM: Spine (Phila Pa 1976). 2019 (Nov 15); 44 (22): E1298–E1310 ~ FULL TEXT
OPEN ACCESS Birgitte Lawaetz Myhrvold, MSc, Alice Kongsted, PhD, Pernille Irgens, MSc, Hilde Stendal Robinson, PhD, Magne Thoresen, PhD, and Nina Křpke Vřllestad, PhD
Department of Interdisciplinary Health Sciences,
Institute of Health and Society,
University of Oslo,
Oslo, Norway.
STUDY DESIGN: A prospective observational study.
OBJECTIVE: To externally validate the prediction model developed by Schellingerhout and colleagues predicting global perceived effect at 12 weeks in patients with neck pain and to update and internally validate the updated model.
SUMMARY OF BACKGROUND DATA: Only one prediction model for neck pain has undergone some external validation with good promise. However, the model needs testing in other populations before implementation in clinical practice.
METHODS: Patients with neck pain (n = 773) consulting Norwegian chiropractors were followed for 12 weeks. Parameters from the original prediction model were applied to this sample for external validation. Subsequently, two random samples were drawn from the full study sample. One sample (n = 436) was used to update the model; by recalibration, removing noninformative covariates, and adding new possible predictors. The updated model was tested in the other sample (n = 303) using stepwise logistic regression analysis. Main outcomes for performance of models were discrimination and calibration plots.
RESULTS: Three hundred seventy patients (47%) in the full study sample reported persistent pain at 12 weeks. The performance of the original model was poor, area under the receiver operating characteristics curve was 0.55 with a Confidence Interval of 0.51-0.59. The updated model included Radiating pain to shoulder and/or elbow, education level, physical activity, consultation-type (first- time, follow-up or maintenance consultation), expected course of neck pain, previous course of neck pain, number of pain sites, and the interaction term Physical activity##Number of pain sites. The area under the receiver operating characteristics curve was 0.65 with a 95% Confidence Interval of 0.58-0.71 for the updated model.
CONCLUSION: The predictive accuracy of the original model performed insufficiently in the sample of patients from Norwegian chiropractors and the model is therefore not recommended for that setting. Only one predictor from the original model was retained in the updated model, which demonstrated reasonable good performance predicting outcome at 12 weeks. Before considering clinical use, a new external validation is required.
KEYWORDS: chiropractic, external validation, neck pain, performance accuracy, prediction rule, prognosis, updating.
LEVEL OF EVIDENCE: 3.
From the FULL TEXT Article:
Introduction
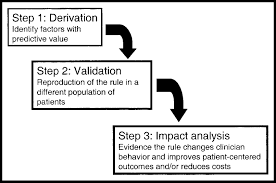
Neck pain is common with an annual prevalence of 30% to 50% in the general population, [1–5] and causes substantial disability and economic expenses. [1, 3, 6–8] Since the highest burden of disability and health expenses, relate to a small proportion of those with neck pain there is a need to identify factors that can predict patients’ likely outcome and tailor management accordingly. Although a number of predictors associated with neck pain have been identified, evidence related to prediction of the clinical course of recovery and decisions regarding choice of treatment is limited and inconsistent. [6, 9, 10] A recent literature review concluded that the quality of studies developing prediction models on neck pain varies, and that the majority of models lack proper validation. [11] In 2010, Schellingerhout et al [12] identified predictive factors and developed a prediction model aiming at identifying patients at risk of persistent neck pain complaints after 6 months and confirmed its validity in a separate patient sample (external validation). To our knowledge, this is the only prediction model for neck pain that has been externally validated. However, the model has not been externally validated in settings other than general practice and physiotherapy in England and the Netherlands. This may be important as patient populations and predictors may differ across countries and settings. [13, 14]
The aims of this study were therefore to(1) externally validate the prediction model developed by Schellingerhout (hereafter "the original model") in patients with neck pain consulting Norwegian chiropractors,
(2) recalibrate the original model in chiropractic neck patients,
(3) potentially update the original model by adding new predictors, and
(4) internally validate the updated model.
MATERIALS AND METHODS
This study was part of a 1-year observational study following patients with neck pain consulting chiropractic practice. Decisions regarding treatment were at the discretion of the individual chiropractor, irrespective of study participation.
Setting
Altogether 71 members of the Norwegian Chiropractic Association agreed to recruit patients. They were located across all parts of Norway, reflecting urban and rural areas. Patients can be either referred or self-referred to chiropractic treatment and qualify for partial refund from the Norwegian health care system. [15]
Participants
Patients aged 18 to 70 years, presenting with neck pain as a primary or secondary complaint with or without arm pain were invited to participate. They were eligible for inclusion regardless of pain duration and if they had started treatment or not. Participants should be able to read and write Norwegian, and to respond SMS messages on a mobile phone (not used in this study). Exclusion criteria were suspicion of serious pathology or fracture as cause of neck pain. Chiropractors were instructed to invite all consecutive patients presenting with neck pain. The inclusion period was September 2015 to May 2016.
Procedure
All patients received oral and written information about the study from the chiropractor. All participants signed a written informed consent. The participants received questionnaires on paper or electronically. Paper questionnaires were given at recruitment by the chiropractor, and returned by the participant in a pre-paid envelope to the researchers. Participants choosing electronic questionnaires received an e-mail within 2 days with a link to the baseline questionnaire. Follow-up questionnaires were sent after 12 weeks. Those not responding within 7 days had one written reminder followed by a phone call 2 weeks later.
Patient Reported Baseline Variables

Table 1A
Table 1B
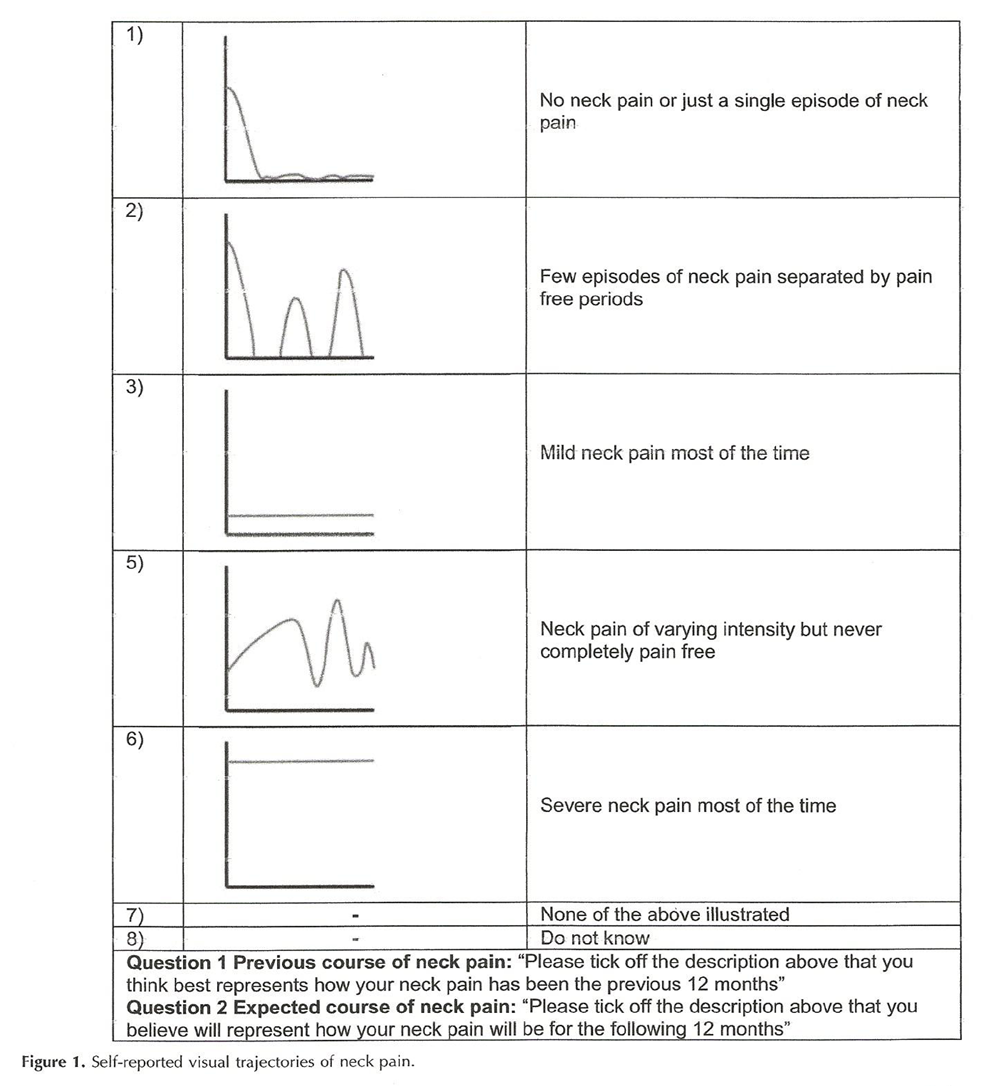
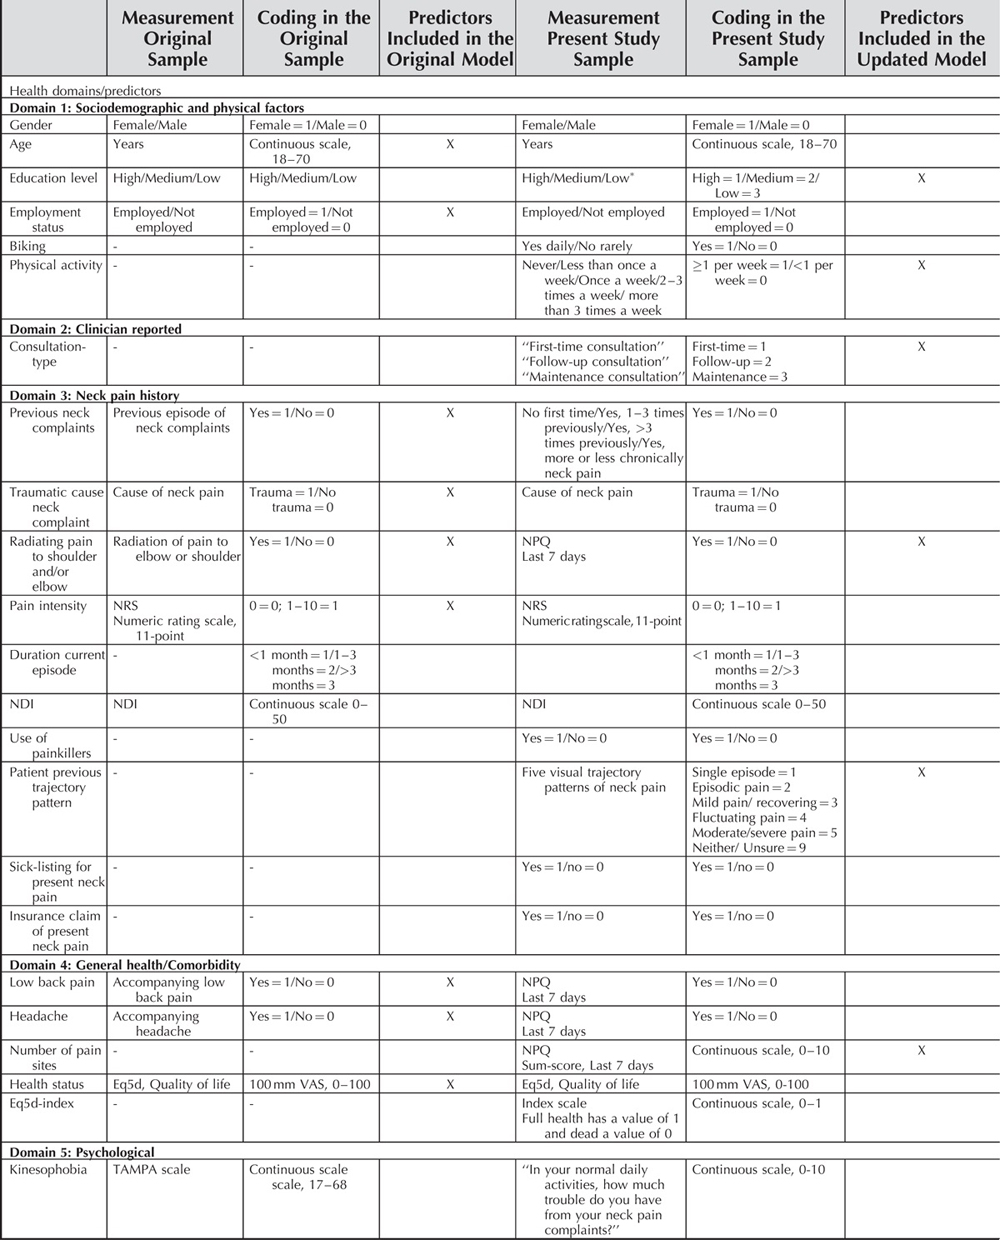
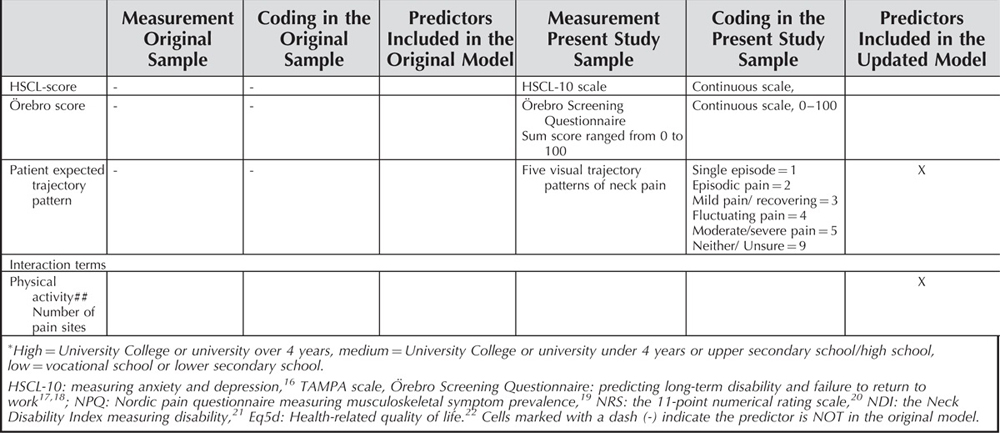
Figure 1 The baseline questionnaires included all nine predictors from the original model of Schellingerhout et al [12] (Table 1). In addition, demographic variables and other potential predictors used to update the model were selected based on the literature, [10, 23–25] recommendations on prediction model development [26, 27] and clinical experience. Hence, we included sum scores from five questionnaires. [16–21] Two of the additional variables were visual trajectory patterns describing the course of neck pain in the past year and expected course of neck pain in the forthcoming year. Five trajectories were made based on the literature of trajectory patterns [25, 28] (Figure 1). All potential predictors were divided into five domains to be used when updating the model because many of the included potential predictors may carry similar or overlapping information (Table 1).
Consultation-Type
Consultation-type describes when in the course of treatment participants were recruited ("First-time consultation" = recruited at the first visit for a new episode of neck pain, "Follow-up consultation" = recruited during a clinical course of treatment, "Maintenance consultation" = patients visiting the chiropractor regularly at pre-planned time points [29]).
Outcome Measure
The outcome measure was self-reported global perceived effect (GPE) at 12 weeks. [30] GPE was measured on a 7-point Likert-scale (0 = "completely recovered" to 6 = "worse than ever"). Scores of 2–6 were coded as "persistent complaints" and used as outcome for the analysis as in the original model. [12]
The Data Sets and Approach for Validation and Update
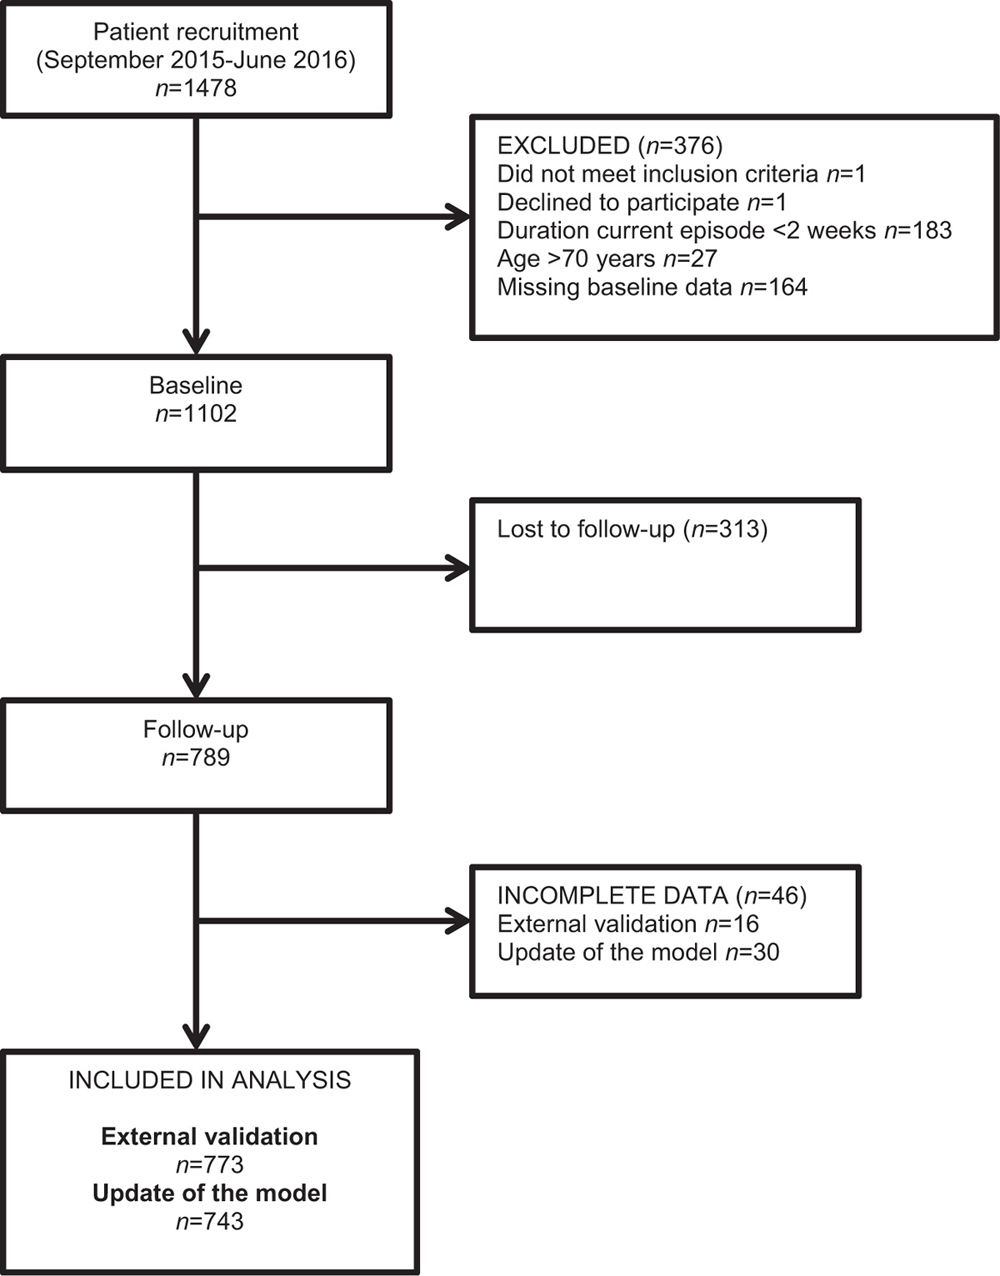
Figure 2
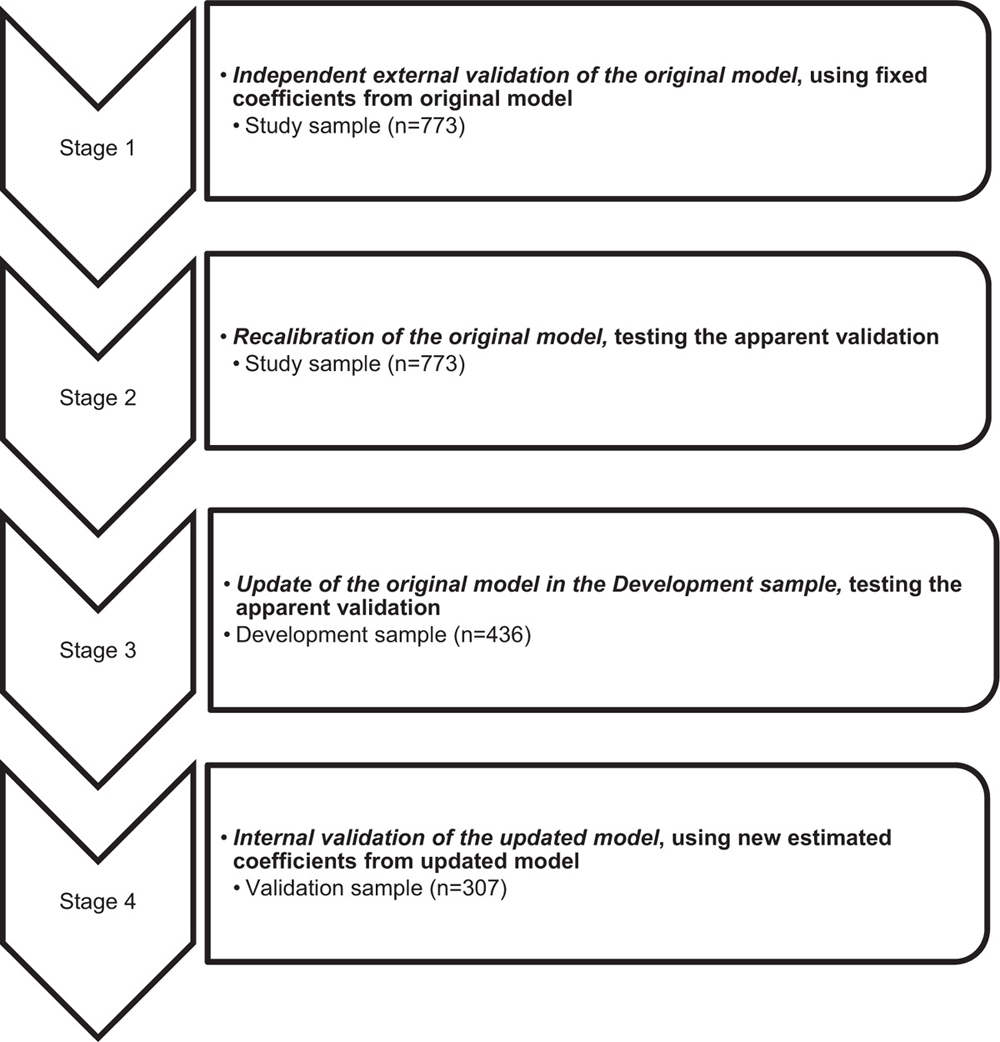
Figure 3
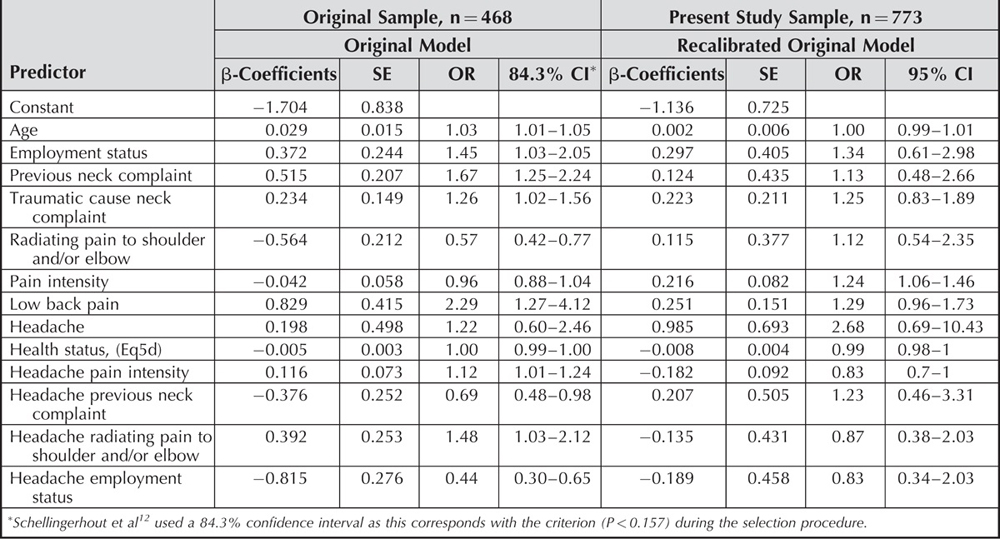
Table 2 First, the full study sample (n = 773) was used for external validation of the original model. Second, the full study sample was used for a recalibration of the original model. Third, the original model was updated using a randomly created split-sample from the full study sample stratified by number of recruited patients per clinic to achieve equal representation of clinics as in the full study sample (Development sample, n = 436). Fourth, the updated model was tested in the rest of the full study sample (Validation sample, n = 307), (Figures 2 and 3).
Descriptive analyses are presented as frequencies (%) or mean values with standard deviation (SD). Univariate logistic regression analysis was used to estimate relationships between the outcome and the variables Consultation-type and Duration current episode as well as their potential moderation of the relationship between original predictors and outcome. Only complete-cases where analyzed, thus we excluded 46 individuals having one or more single items missing of the predictors. All analyses were carried out using Stata version 15 (StataCorp., TX).Stage 1. Independent External Validation of the Original Model The original model [12] was applied in our full study sample (n= 773) using fixed coefficients, that is, by transporting the coefficients from the original model to the validation setting (Table 2). The validity of the model was evaluated in terms of calibration and discrimination. [20, 31, 32] Calibration was assessed graphically by the agreement between predicted and observed outcomes. The Hosmer-Lemeshow goodness-of-fit test is testing the null-hypothesis that observed and predicted outcomes do not differ. [33] Discrimination was assessed by area under the receiver-operating characteristic curve (AUC).
Stage 2. Recalibration of the Original Model Recalibration of the original model coefficients (intercept and slope) was performed in the full study sample. The regression coefficients of the recalibrated model were evaluated as in Stage 1.
Stage 3. Update of the Original Model in the Development Sample The original model was updated using the development sample (n= 436). The update included recalibration of the coefficients of the predictors and removing/adding new predictors by a non-automated criterion-based procedure. First, original predictors were removed if the model fit was not significantly impaired (tested by the Likelihood Ratio test [LR] and Akaike’s information criterion [AIC]). Starting with the interaction terms and followed by the individual predictors we removed those with an OR closest to one and with the largest P-values as long as the AIC value or LR were not negatively affected. The updated model with the lowest AIC value and an unchanging LR was chosen. Within the five domains described in Table 1, all potential predictors were included in logistic regression models using GPE as outcome and removed one by one based on AIC and LR.
The best performing predictor(s) from each domain were then included in the updated model. Finally, predictors were removed from the updated model using the same nonautomated procedure as for updating the original model. The performance of the updated model was evaluated in terms of calibration and discrimination. The non-automatic approach was chosen to avoid unstable variable selection from stepwise methods. [34] A sufficiently large sample size provided more stable estimates of model performance. [35–37]
Stage 4. Internal Validation of the Updated Model Reproducibility of the updated model obtained from Stage 3 was tested using the Validation sample (n = 307), (internal validation). The updated model was evaluated in terms of calibration and discrimination as in Stage 1. The study was approved by Regional committees for medical and health research ethics (2015/89).
RESULTS
Patient Characteristics
Table 3
Table 3B
Table 4
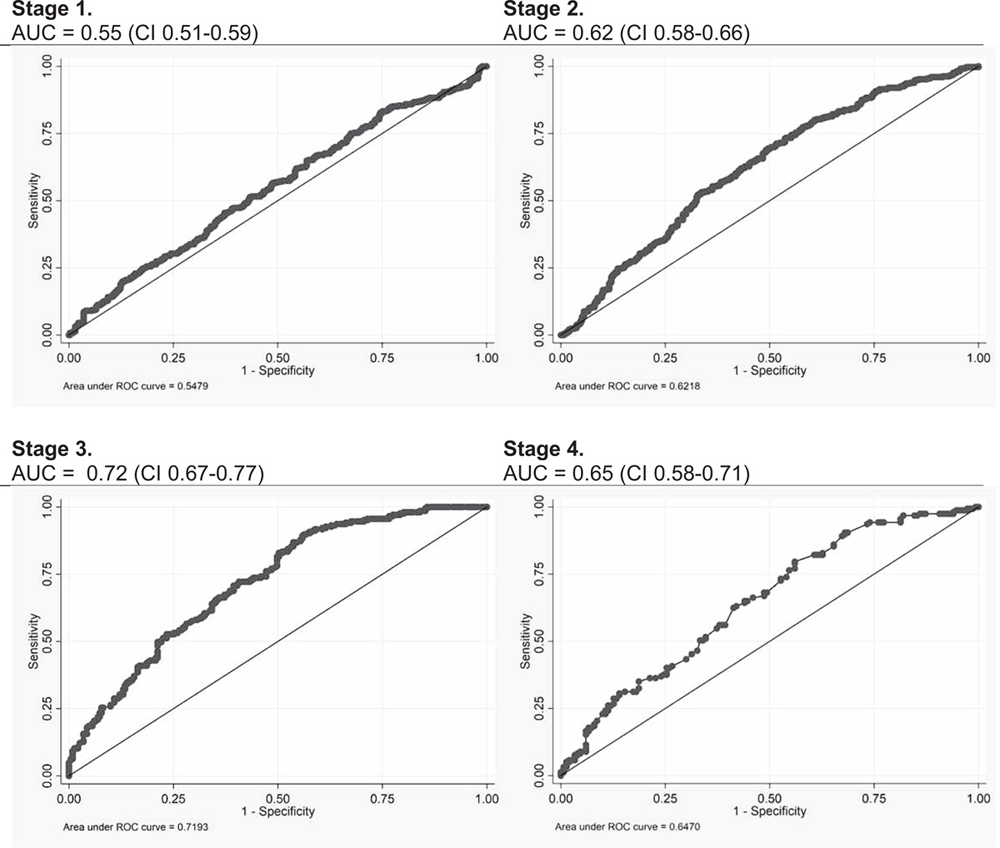
Figure 4
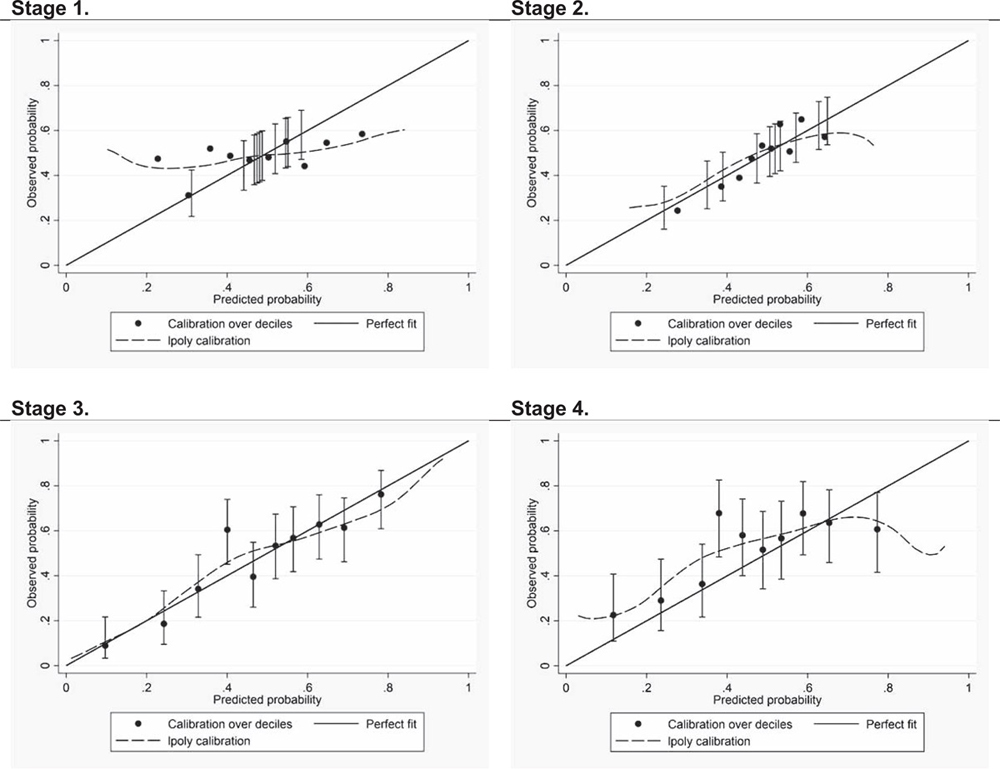
Figure 5
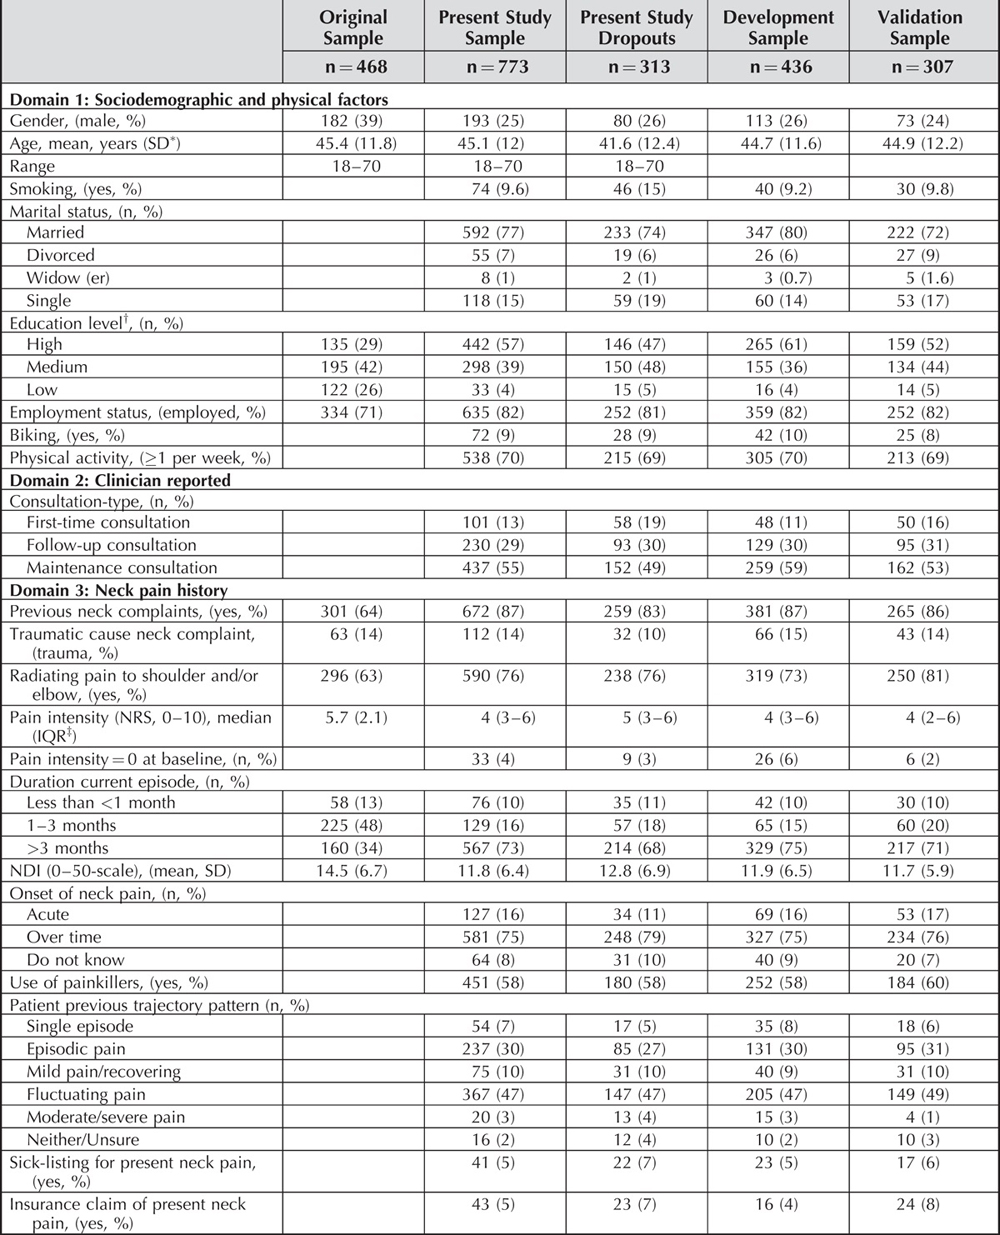
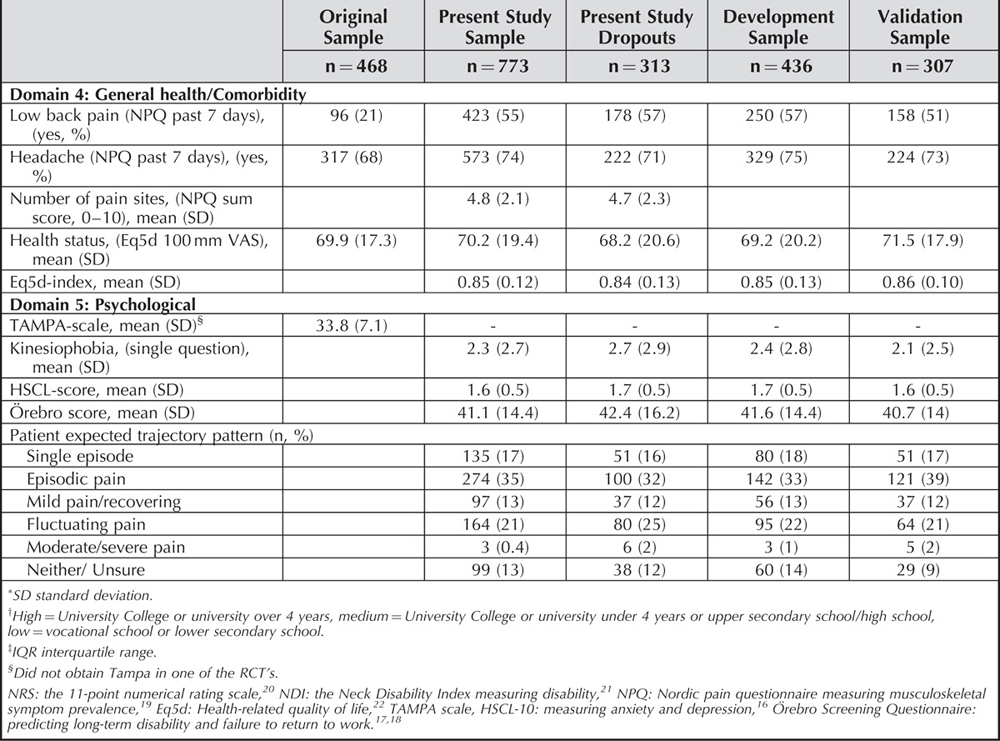
Table 5 Altogether 1,478 patients were recruited of which 1102 met the inclusion criteria and were included in this study. Dropouts were 28% (n = 313) for outcome measures at 12-week follow-up. Hence, the full study sample consisted of 773 patients (Figure 2). The baseline characteristics of our full study sample, dropouts and the original study are presented in Table 3. Participants included in the analyses and those lost to follow-up had similar sociodemographic and neck pain related variables. Participants of the original study had a higher fraction of male participants (39% vs. 25%), a lower education level, a smaller fraction reporting previous neck complaints (64% vs. 87%) and a lower prevalence of low back pain (21% and 55%). Persistent complaints at 12 weeks in our study was 47% compared with 43% after 6 months in the original study.
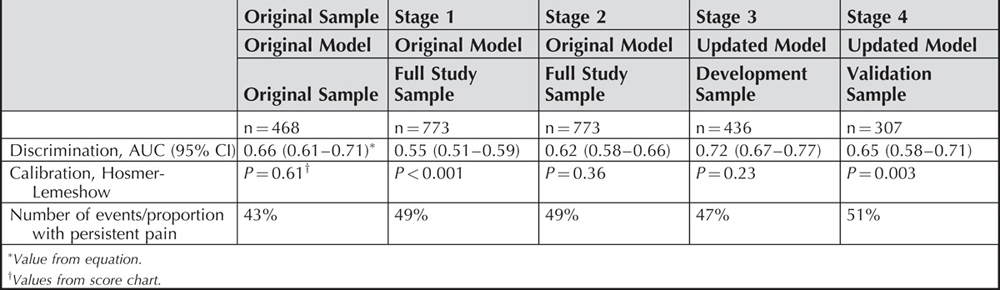
Stage 1. Independent External Validation of the Original Model The original model showed poor discriminative ability: AUC (95% CI) = 0.55 (0.51–0.59) (Figure 4) and the calibration plot showed a poor fit of the model to the data (Figure 5) (Hosmer-Lemeshow test P < 0.001). Key results of validation and updating during all stages are shown in Table 4, Figures 4 and 5.
Stage 2. Recalibration of the Original Model The performance improved after recalibration of the original model; see Tables 2 and 4 for details. The AUC increased (Figure 4) and the calibration plot showed a clear improvement in precision (Figure 5). Pain intensity and radiating pain showed a stronger association with outcome in our sample as compared with the original study, whereas low back pain was less predictive. None of the interaction terms from the original model were significantly associated with outcome (Table 2).
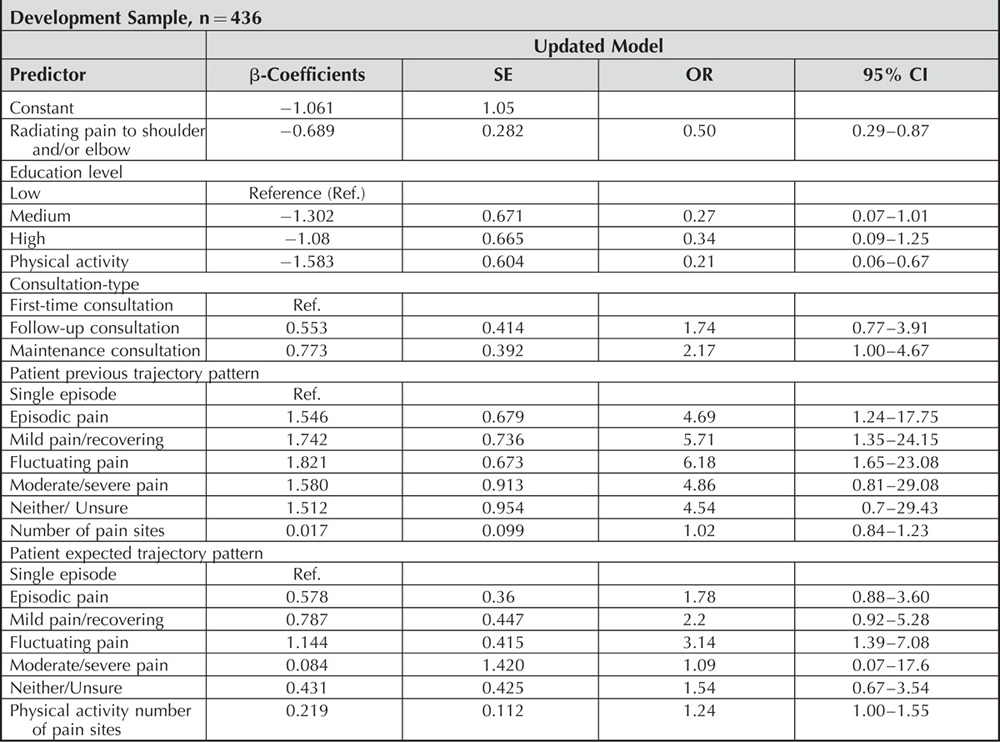
Stage 3. Update of the Original Model in the Development Sample The updated model included seven predictors and one interaction term; Table 1 shows excluded and included predictors of the updated model and Table 5 show parameters of the updated model. The updated model included radiating pain to shoulder and/or elbow, education level, physical activity, consultation-type, expected course of neck pain, previous course of neck pain, number of pain sites, and the interaction term physical activity##number of pain sites. The only original predictor remaining in the updated model was radiating pain. The performance of the updated model improved compared with the original and to the recalibrated model with respect to both discriminative ability and calibration (Figures 4 and 5).
Stage 4. Internal Validation of the Updated Model The updated model had reasonable discriminative ability: AUC (95% CI) = 0.65 (0.58–0.71) in the validation sample (n = 307) see Figure 4. Calibration plot predicted best those at low-risk of persistent pain (Figure 5) but the HosmerLemeshow test was significant (P < 0.01).
DISCUSSION
Our study showed poor external validity of the original model in Norwegian chiropractic patients with neck pain. Performance was improved through recalibration of the model. However, the model was still not able to predict GPE well in this setting. During the update, all predictors from the original model apart from radiating pain were excluded and replaced with new ones resulting in a model so different from the original one that new external validation is needed.
The original model had previously been externally validated with a reasonable discrimination and an acceptable calibration. [12] Our study was a large prospective cohort study planned for the external validation with all original predictors and outcome collected and categorized similar to the original study. Some methodological differences might be of importance. Outcome was measured after 12 weeks rather than 6 months in the original study. Still, this disparity did not give any major difference in the prevalence of the outcome, 47% versus 43%. As most substantial improvements occur within 6–12 weeks after care seeking, [38–40] it is expected that a model, being predictive of 6-months outcome, would also predict 3-months outcomes. We only included complete cases instead of imputing missing data. [27, 41] This may have introduced bias, but with a small number of missing items (<3%) we believe this to be of minimal importance.
The lack of external validity in our study could be due to differences between the two samples, indicated by different distributions of predictors between the populations. The original model was developed using patients participating in a RCT, but applied in our study sample with looser inclusion criteria. Different populations might also be expected due to the settings; the original model developed in general practice and physiotherapy and our validation in chiropractic setting. The two cohorts differed on sex, education, previous complaints, and presence of low back pain, which are all factors known to be associated with persistent neck pain. [10] Furthermore, less restricted criteria resulted in twice as many participants with pain duration more than 3 months compared with the original model. This difference may affect prediction since a longer duration of the symptoms at baseline is related to poor outcome. [42, 43] However, the associations between predictors and outcome were not substantially different between groups differing in duration and we believe the longer pain duration explains only little of the poor performance. It is also possible that there were differences in psychosocial factors between the samples, although the lack of such data in the original study precludes further discussion of this.
The present model update included three novel predictors that seemed to be stronger than some of the predictors commonly used. Previous and Expected visual trajectory patterns both showed strong association with outcome. This may indicate that patients’ recall of their overall symptom history may carry more prognostic information than traditional measures of previous episodes and episode duration. [43] This fits well with emerging evidence on quite stable long-term trajectories of spinal pain. [44, 45] Inclusion of the predictor Expected course of neck pain in the updated model should possibly be interpreted as a proxy measure of patients’ expectations and possible psychological distress. [25] It is somewhat surprising that this variable was a stronger predictor than the traditional variables reflecting psychosocial factors. These findings need further investigation regarding prognostic information of the trajectory patterns.
It is also noteworthy that the variable Consultation-type had prognostic effect. Patients receiving maintenance care have poorer outcome after 3 months compared with those included with a new episode. This is not surprising, but suggests that this variable includes information of prognostic value that complements the other variables. Further investigation is needed to understand how this variable affects outcome and whether similar effects can be found for patients in other settings.
The inclusion of the novel predictors provided a model that performed best in identifying people with a low probability of persistent pain. This will be of value in reducing overtreatment of patients with a good prognosis. The performance of the model for identifying persons with high probability of persistent pain was less informative. The significant Hosmer-Lemeshow test should be interpreted with caution because a large sample size increases the probability of a statistically significant lack of fit. The updated model should thus be further evaluated and not rejected solely based on this test.
Our results raise the question whether it is realistic that prediction models from one setting have the potential for use in other settings. In acute low back pain, promising results imply that the same model in Australian general practice and Danish chiropractic can identify people with a good outcome of care. [46] This does not preclude, however, that even better prognosis could be obtained in these settings with another model. One might even hypothesise that models for this kind of health service with a wide set of treatment options, should be individualized to the therapist.
This study is one of few to independently externally validate a prediction model for neck pain. [11] We did not find that the original model was predictive in this sample of patients managed by chiropractors. The betweenpopulation-heterogeneity might be a limitation when transferring prediction models to different settings. An attempt to update the model resulted in a new prediction model that was able to predict patients with a favorable outcome. It is, however still pre-mature to be used in clinical decisionguidance and would need further evaluation and perhaps updating before implementation is considered.
Key Points
A previously validated prediction model (called original model) was externally validated in 773 chiropractic patients with neck pain.
The performance of the external validation of the original model was poor.
An update of the original model included the predictors:
radiating pain to shoulder and/or elbow,
education level,
physical activity,
consultation-type,
expected course of neck pain,
previous course of neck pain,
number of pain sites, and
the interaction term physical activity##number of pain sites.
The updated prediction model performed best in identifying people with a low probability of persistent pain but need further evaluation.
The updated prediction model included patientreported visual trajectories of neck pain pattern that should be investigated further regarding prognostic information.
Acknowledgments
The authors thank Knut Waagan for his help during statistical analyses. They also thank the participating chiropractors and patients.
References:
Hogg-Johnson, S., van der Velde, G., Carroll, L. J. et al (2008).
The Burden and Determinants of Neck Pain in the General Population:
Results of the Bone and Joint Decade 2000–2010 Task Force
on Neck Pain and Its Associated Disorders
Spine (Phila Pa 1976). 2008 (Feb 15); 33 (4 Suppl): S39–51Fejer R, Kyvik KO, Hartvigsen J.
The prevalence of neck pain in the world population: a systematic critical review of the literature.
Eur Spine J 2006;15:834–48.Hoy DG, et al.
The epidemiology of neck pain.
Best Pract Res Clin Rheumatol 2010;24:783–92.Vos T, Flaxman AD, Naghavi M, et al.
Years Lived with Disability (YLDs) for 1160 Sequelae of 289 Diseases and Injuries
1990-2010: A Systematic Analysis for the Global Burden of Disease Study 2010
Lancet. 2012 (Dec 15); 380 (9859): 2163–2196Natvig B, et al.
Musculoskeletal symptoms in a local community.
Eur J Gen Pract 1995;1:25–8.Graham N, et al.
An ICON overview on physical modalities for neck pain and associated disorders.
Open Orthop J 2013;7: 440–60.DALYs GBD, Collaborators H.
Global, regional, and national disability-adjusted life-years (DALYs) for 333 diseases and injuries and healthy life expectancy (HALE) for 195 countries and territories, 1990-2016: a systematic analysis for the Global Burden of Disease Study 2016.
Lancet 2017;390:1260–344.Lćrum E, Brage S, Ihlebćk C, Johnsen K, Natvig B, & Aas E.
A musculoskeletal accounting: Prevalence and costs related to injuries, disease and disorders of the musculoskeletal system: MSTreport.
1/2013. MST-report. ISBN 978-82-303-2311-3 ed:
The Norwegian council for musculoskeletal health by/ FORMI, Division of surgery and neuroscience,
Oslo university hospital - Ulleva?l.
Postbox 4956 Nydalen, 0424 Oslo, Norway 2013:21–3.Hurwitz, EL, Carragee, EJ, van der Velde, G et al.
Treatment of Neck Pain: Noninvasive Interventions: Results of the Bone and Joint Decade
2000–2010 Task Force on Neck Pain and Its Associated Disorders
Spine (Phila Pa 1976). 2008 (Feb 15); 33 (4 Suppl): S123–152Carroll, LJ, Hogg-Johnson, S, van der Velde, G et al.
Course and Prognostic Factors for Neck Pain in the General Population:
Results of the Bone and Joint Decade 2000–2010 Task Force
on Neck Pain and Its Associated Disorders
Spine (Phila Pa 1976). 2008 (Feb 15); 33 (4 Suppl): S75–82Kelly J, Ritchie C, Sterling M.
Clinical prediction rules for prognosis and treatment prescription in neck pain: a systematic review.
Musculoskelet Sci Pract 2017;27:155–64.Schellingerhout JM, et al.
Prognosis of patients with nonspecific neck pain: development and external validation of a prediction rule for persistence of complaints.
Spine (Phila Pa 1976) 2010;35: E827–35.Hestbaek L, Munck A, Hartvigsen L, Jarbol DE, Sondergaard J, Kongsted A.
Low Back Pain in Primary Care: A Description of 1250 Patients
with Low Back Pain in Danish General and Chiropractic Practice
Int J Family Med. 2014 (Nov 4); 2014: 106102Morso L, et al.
The predictive and external validity of the STarT Back Tool in Danish primary care.
Eur Spine J 2013;22:1859–67.Legislation regarding changes in treatment reimbursement for chiropractors and manual therapists, the ministry of health and care services: proposition no 28 (Ot. prp. nr. 28), 2011.]. Available at:
http://www.stortinget.no/no/Saker-og-publikasjoner/Vedtak/Beslutninger/Odelstinget/
2005-2006/beso-200506-022/-a1
Accessed June 29, 2019.Derogatis LR, et al.
The Hopkins Symptom Checklist (HSCL): a self-report symptom inventory.
Behav Sci 1974;19:1–15.Linton SJ, Boersma K.
Early identification of patients at risk of developing a persistent back problem: the predictive validity of the Orebro Musculoskeletal Pain Questionnaire.
Clin J Pain 2003;19:80–6.Grotle M, Vollestad NK, Brox JI.
Screening for yellow flags in first-time acute low back pain: reliability and validity of a Norwegian version of the Acute Low Back Pain Screening Questionnaire.
Clin J Pain 2006;22:458–67.Kuorinka I, et al.
Standardised Nordic questionnaires for the analysis of musculoskeletal symptoms.
Appl Ergon 1987;18: 233–7.Von Korff M, Jensen MP, Karoly P.
Assessing global pain severity by self-report in clinical and health services research.
Spine (Phila Pa 1976) 2000;25:3140–51.Vernon H, Mior S.
The Neck Disability Index: A Study of Reliability and Validity
J Manipulative Physiol Ther 1991 (Sep); 14 (7): 409–415EuroQol G.
EuroQol–a new facility for the measurement of healthrelated quality of life.
Health Policy 1990;16:199–208.Kongsted A, Kent P, Axen I, Downie AS, Dunn KM.
What Have We Learned From Ten Years of Trajectory Research in Low Back Pain?
BMC Musculoskelet Disord. 2016 (May 21); 17 (1): 220Dunn KM, Jordan K, Croft PR.
Characterizing the Course of Low Back Pain: A Latent Class Analysis
American J Epidemiology 2006 (Apr 15); 163 (8): 754–761Dunn KM, Campbell P, Jordan KP.
Validity of the Visual Trajectories Questionnaire for Pain
J Pain 2017 (Dec); 18 (12): 1451–1458Steyerberg EW.
Clinical prediction models. A practical approach to development, validtion, and updatinged.
Springer ScienceRBusiness Media, LLC,
233 Spring Street,
New York, NY 10013, USA:
Springer, 2009.Steyerberg EW.
Clinical Prediction Models. A Practical Approach to Development, Validtion, and Updating. 2009:
Springer.Kongsted A, Hestbaek L, Kent P.
How Can Latent Trajectories of Back Pain be Translated into Defined Subgroups?
BMC Musculoskelet Disord. 2017 (Jul 3); 18 (1): 285Myburgh C, Brandborg-Olsen D, Albert H, Hestbaek L.
The Nordic Maintenance Care Program: What Is Maintenance Care?
Interview Based Survey of Danish Chiropractors
Chiropractic & Manual Therapies 2013 (Aug 20); 21: 27Kamper SJ, et al.
Global Perceived Effect scales provided reliable assessments of health transition in people with musculoskeletal disorders, but ratings are strongly influenced by current status.
J Clin Epidemiol 2010;63:760.e1–6.e1.Steyerberg EW, et al.
Assessing the performance of prediction models: a framework for traditional and novel measures.
Epidemiology 2010;21:128–38.Moons KM, et al.
Transparent reporting of a multivariable prediction model for individual prognosis or diagnosis (tripod): explanation and elaboration.
Ann Int Med 2015;162:W1–73.Hosmer DW Jr, Lemeshow S.
Applied Logistic Regression, Second edition ed.
New York: Wiley-Interscience Publication; 2000.Sun GW, Shook TL, Kay GL.
Inappropriate use of bivariable analysis to screen risk factors for use in multivariable analysis.
J Clin Epidemiol 1996;49:907–16.Kent P, et al.
Four hundred or more participants needed for stable contingency table estimates of clinical prediction rule performance.
J Clin Epidemiol 2017;82:137–48.Collins GS, Ogundimu EO, Altman DG.
Sample size considerations for the external validation of a multivariable prognostic model: a resampling study.
Stat Med 2016;35:214–26.Vergouwe Y, et al.
Substantial effective sample sizes were required for external validation studies of predictive logistic regression models.
J Clin Epidemiol 2005;58:475–83.Leaver AM, et al.
People seeking treatment for a new episode of neck pain typically have rapid improvement in symptoms: an observational study.
J Physiother 2013;59:31–7.Walton DM, Eilon-Avigdor Y, Wonderham M, et al.
Exploring the Clinical Course of Neck Pain
in Physical Therapy: A Longitudinal Study
Arch Phys Med Rehabil. 2014 (Feb); 95 (2): 303–308Vasseljen O, et al.
Natural course of acute neck and low back pain in the general population: the HUNT study.
Pain 2013;154: 1237–44.Janssen KJ, et al.
Missing covariate data in medical research: to impute is better than to ignore.
J Clin Epidemiol 2010;63:721–7.Bot SD, et al.
Predictors of outcome in neck and shoulder symptoms: a cohort study in general practice.
Spine (Phila Pa 1976) 2005;30:E459–70.Bruls VE, Bastiaenen CH, de Bie RA.
Prognostic factors of complaints of arm, neck, and/or shoulder: a systematic review of prospective cohort studies.
Pain 2015;156:765–88.Dunn, K.M., Campbell, P., and Jordan, K.P.
Long-term Trajectories of Back Pain: Cohort Study With 7-year Follow-up
BMJ Open. 2013 (Dec 11); 3 (12): e003838Lemeunier N, Leboeuf-Yde C, Gagey O.
The natural course of low back pain: a systematic critical literature review.
Chiropr Man Therap 2012;20:33.da Silva T, Macaskill P, Kongsted A, et al.
Predicting pain recovery in patients with acute low back pain: Updating and validation of a clinical prediction model.
Eur J Pain 2019;23:341–53.
Return to CLINICAL PREDICTION RULE
Return to TRAJECTORIES OF NECK PAIN
Since 11-08-2019
| Home Page | Visit Our Sponsors | Become a Sponsor |
Please read our DISCLAIMER |