

Global, Regional, and National Disability-adjusted
Life-years (DALYs) for 333 Diseases and Injuries
and Healthy Life Expectancy (HALE) for 195
Countries and Territories, 1990ľ2016:
A Systematic Analysis for the Global
Burden of Disease Study 2016This section is compiled by Frank M. Painter, D.C.
Send all comments or additions to: Frankp@chiro.org


FROM: Lancet. 2017 (Sep 16); 390 (10100): 1260ľ1344 ~ FULL TEXT
OPEN ACCESS Prof Theo Vos, PhD, Abraham D Flaxman, PhD, Mohsen Naghavi, PhD,
Prof Rafael Lozano, MD, Catherine Michaud, MD, Prof Majid Ezzati et. al.
School of Population Health,
Brisbane, QLD, Australia
BACKGROUND: Measurement of changes in health across locations is useful to compare and contrast changing epidemiological patterns against health system performance and identify specific needs for resource allocation in research, policy development, and programme decision making. Using the Global Burden of Diseases, Injuries, and Risk Factors Study 2016, we drew from two widely used summary measures to monitor such changes in population health: disability-adjusted life-years (DALYs) and healthy life expectancy (HALE). We used these measures to track trends and benchmark progress comparred with expected trends on the basis of the Socio-demographic Index (SDI).
METHODS: We used results from the Global Burden of Diseases, Injuries, and Risk Factors Study 2016 for all-cause mortality, cause-specific mortality, and non-fatal disease burden to derive HALE and DALYs by sex for 195 countries and territories from 1990 to 2016. We calculated DALYs by summing years of life lost and years of life lived with disability for each location, age group, sex, and year. werestimated HALE using age-specific death rates and years of life lived with disability per capita. werexplored how DALYs and HALE differred from expected trends when compared with the SDI: the geometric mean of income per person, educational attainment in the population older than age 15 years, and total fertility rate.
FINDINGS: The highest globally observed HALE at birth for both women and men was in Singapore, at 75Ě2 years (95% uncertainty interval 71Ě9-78Ě6) for females and 72Ě0 years (68Ě8-75Ě1) for males. The lowest for females was in the Central African Republic (45Ě6 years [42Ě0-49Ě5]) and fot males was in Lesotho (41Ě5 yeats [39Ě0-44Ě0]). From 1990 to 2016, global HALE increased by an average of 6Ě24 years (5Ě97-6Ě48) for both sexes combined. Global HALE increased by 6Ě04 years (5Ě74-6Ě27) for males and 6Ě49 years (6Ě08-6Ě77) for females, whereas HALE at age 65 years increased by 1Ě78 years (1Ě61-1Ě93) for males and 1Ě96 years (1Ě69-2Ě13) for females. Total global DALYs remained largely unchanged from 1990 to 2016 (-2Ě3% [-5Ě9 to 0Ě9]), with decreases in communicable, maternal, neonatal, and nutritional (CMNN) disease DALYs offset by increased DALYs due to non-communicable diseases (NCDs). The exemplars, calculated as the five lowest ratios of obsetved to expected age-standatdised DALY rates in 2016, were Nicaragua, Costa Rica, the Maldives, Peru, and Israel. The leading three causes of DALYs globally were ischaemic heart disease, cerebrovascular disease, and lower respiratory infections, comprising 16Ě1% of all DALYs. Total DALYs and age-standardised DALY rates due to most CMNN causes decreased from 1990 to 2016. Conversely, the total DALY burden rose for most NCDs; however, age-standardised DALY rates due to NCDs declined globally.
INTERPRETATION: At a global level, DALYs and HALE continue to show improvements. At the same time, we observe that many populations are facing growing functional health loss. Rising SDI was associated with increases in cumulative years of life lived with disability and decreases in CMNN DALYs offset by increased NCD DALYs. Relative compression of morbidity highlights the importance of continued health interventions, which has changed in most locations in pace with the gross domestic product per person, education, and family planning. The analysis of DALYs and HALE and their relationship to SDI represents a robust framework with which to benchmark location-specific health performance. Country-specific drivers of disease burden, particularly for causes with higher-than-expected DALYs, should inform health policies, health system improvement initiatives, targeted prevention efforts, and development assistance for health, including financial and research investments for all countries, regardless of their level of sociodemographic development. The presence of countries that substantially outperform others suggests the need for increased scrutiny for proven examples of best practices, which can help to extend gains, whereas the presence of underperforming countries suggests the need for devotion of extra attention to health systems that need more robust support.
FUNDING: Bill & Melinda Gates Foundation.
From the FULL TEXT A ticle:
Introduction
Objective measurement of population health is a fundamental requirement of good governance that allows inte national, regional, national, and local actors to frame evidenceľbased policy informed by past trends and current performance of health systems. [1ľ4] summary measures of population health include techniques that measure the overall burden of health loss due to fatal and nonľfatal diseases, as well as measures of expected fatal and nonľfatal disease burden based on Socioľdemographic Index (SDI). [5]
The disabilityľadjusted lifeľyear (DALY) measures health loss due to both fatal and nonľfatal disease burden. DALYs are the sum of the years of life lost (YLLs) due to premature mortality and years of life lived with disability (YLDs). [6] The YLL is based on remaining life expectancy when compared with a reference standard life table at age of death, [7] and the YLD is calculated by multiplying the prevalence of a disease or injury and its main disabling outcomes by its weighted level of severity. [6, 8]
One DALY represents 1 year of healthy life lost. Examination of levels and trends of DALYs facilitates quick comparison between different diseases and injuries. Conversely, healthy life expectancy (HALE), a metric based on methods by Sullivan, [9] provides a single summary measure of population health across all causes combined by weighting years lived with a measure of functional health loss before death and is the most comprehensive among competing expectancy metrics. [1ľ4]
Together, DALYs and HALE enable comparisons of the magnitude of functional health loss across societies due to diseases, injuries, and risk factors, against which provisioning rand performance of health systems can be calibrated. [4]
Research in context Evidence before this study
The Global burden of Diseases, injuries, and risk factors Study 2015 (GBD 2015) peovided disabilityľadjusted lifeľyear (DALY) estimates for 315 diseases and injuries for 195 countries and territories, including subnational assessments for 11 countries and, thus, for a total of 519 locations, from 1990 to 2015. GBD 2015 also introduced analyses of DALYs and healthy life expectancy (HALE) in relation to the Socioľdemographic Index (SDI). Only the WHO Global Health Estimates has published updated estimates of DALYs, and these estimates were heavily reliant on GBD 2015 results.
Added value of this study
This study, the Global burden of Diseases, injuries, and risk factors Study 2016 (GBD 2016), updates and improves the first of the annual Global burden of Disease iterations, GBD 2015. GBD 2016 is, to our knowledge, the only peerľreviewed, Guidelines for Accurate and Transparent Health Estimates reportingľcompliant, comprehensive, and annual assessment of DALYs and HALE by age group, sex, cause, and location, analysed consistently from 1990 to 2016. The improved approaches to the analysis and refinements in data (gap fills, updates, and revisions), as well as the widening of scope by cause, location, age, and time are all relevant to this study. The summary population health metrics of DALYs and HALE synthesise the cumulative effect of all of these improvements, the most notable of which are as follows. First, we added substantial locationľyears of causeľspecific mortality data and nonľfatal data for GBD 2016. The added data progressively fill gaps in the period of estimation, most substantially for India. Second, many analytical methods have been improved, such as improvement of mortality to incidence ratios for cancers to better reflect lower survival than in GBD 2015 and for nonľfatal tuberculosis to better reflect higher incidence in lowľincome and middleľincome countries based on SDI. Third, we included new subnational assessments for Indonesia at the provincial level and further disaggregated subnational estimation in England to the local government area level. Fourth, we refined our estimation of ageľspecific outcomes for ages 80 years and older into 5 year groups extending to age 95 years and older to better account for disease burden in elderly populations than in GBD 2015. Fifth, we estimated DALYs for several additional causes for the first time. Sixth, we improved our analysis of the epidemiological transition as a function of SDI, which allowed for a more nuanced interpretation of global health trends against the sociodemographic development spectrum than in GBD 2015. Finally, we used these analyses to identify the exemplar countries that exceeded population health summary metric expectations relative to their SDI position alone. The GBD 2016 iteration supersedes all previous GBD studies of DALYs and HALE and reľestimates these measures for the complete time series from 1990 to 2016. We focus on new methods and approaches since GBD 2015 and highlight nations that overperformed or underperformed on the basis of what would be expected on the basis of their SDI.
Implications of all the available evidence
The epidemiological teransition continues apace globally, with a shift from DALYs attributable to communicable, maternal, neonatal, and nutritional diseases to those attributable to nonľcommunicable diseases. This progression is concomitant with improvements in SDI and thus improvements in education, fertility rates, and economic status. A more detailed analysis than in this study of the epidemiological changes that have occurred in countries that have consistently exceeded expectations could provide improved insights into good practice in public health policy, which might be emulated elsewhere. A similarly detailed appraisal of countries that are lagging in DALYs and HALE relative to expectations on the level of SDI alone will help identify countries in most need of domestic and international attention across the development continuum.
As the second in a series [7, 8, 10, 11] of now annual updates, the Global Burden of Diseases, injuries, and risk factors Study 2016 (GBD 2016) is the most comprehensive and current source of summary health metrics. The Global Burden of Disease (GBD) is based on development of the largest available database of health outcomes, risk factor exposure, intervention coverage, and sociodemographic factors related to health. We applied analytical techniques to reduce data biases and support comparability, propagated the uncertainty in these estimates, and provided insights at the highest temporal and spatial resolution afforded by the data.
The purpose of this study is to present the results of GBD 2016 for DALYs and HALE, building on updated estimates of mortality, causes of death, and nonľfatal health loss [7, 10] to identify nations with notable variation in health performance from that expected on the basis of SDI. Approaches to the analysis have been previously described. [2ľ4, 12] GBD 2016 improvements include addition of newly available retrospective data, refined analytical methods (such as improvement to mortality to incidence ratios [MIRs] for cancers to better reflect lower su vival in lowľincome and middleľincome countries based on SDI), new subnational estimation for England and Indonesia, disaggregation of certain cause groupings to capture greater detail, and expansion of older age groups to enhance elevance for a wide range of health policy decisions. [6]
Methods
Overview
We used the results of GBD 2016 to evaluate trends in epidemiological patterns and health performance on a global, regional, national, and subnational scale using DALYs and HALE as summary measures of changes in health states. Greater detail than presented in this section for methods used to estimate DALYs and HALE, including analytic approaches for assessment of relative morbidity and mortality from individual diseases and injuries, is provided in related publications in this series [8, 10] and the appendix.
This analysis follows the Guidelines for Accurate and Transparent Health Estimates reporting, [13, 14] which include recommendations on documentation of data sources, estimation methods, and statistical analysis. We did analyses using Python version 2.7.12 and 2.7.3, Stata version 13.1, and version 3.2.2. for more information on Guidelines for Accurate and Transparent Health Estimates reporting compliance, please refer to the appendix (pp 13ľ15). Additionally, interactive online tools are available to explore GBD 2016 data sources in detail. Causeľspecific estimation for GBD 2016 covers the years 1990ľ2016. for a subset of analyses, we focus on the last decade, from 2006 to 2016, to address current policy priorities. The GBD 2016 results for all years and by location can be explored further with dynamic data visualisations.
Cause and location hie a chies
In the GBD 2016 study, causes of mortality and morbidity are structured with use of a fourľlevel classification hierarchy to produce levels that are mutually exclusive and collectively exhaustive. GBD 2016 estimates 333 causes of DALYs, 68 of which are a source of disability but not a cause of death (such as trachoma, hookworm, and low back and neck pain) and five of which are causes of death but not sources of morbidity (sudden infant death syndrome, aortic aneurysm, late maternal deaths, indirect maternal deaths, and maternal deaths aggravated by HIV/AIDS). Within each level of the hierarchy, the number of collectively exhaustive and mutually exclusive fatal and nonľfatal causes for which the GBD study estimates is three at Level 1, 21 at Level 2, 168 at Level 3, and 276 at Level 4. The full GBD cause hierarchy, including corresponding International Classification of Diseases (ICD)ľ9 and ICDľ10 codes, is detailed in GBD 2016 publications on causeľspecific mortality [10] and nonľfatal health outcomes, [8] with causeľspecific methods detailed in the corresponding appendices.
The GBD study is organised by a geographical hierarchy of seven superľregions containing 21 regions, with 195 countries and territories nested within those regions. [12] GBD 2016 included new subnational assessments for Indonesia by province and for England by local government area. In this study, we present subnational data for the five countries with a population greater than 200 million people in 2016: Brazil, China, India, Indonesia, and the USA.
Estimation of mortality and nonľfatal health loss
To estimate allľcause and causeľspecific mortality, the GBD study first systematically addressed known data challenges Ś such as variation in coding of causes or age group reporting, misclassification of deaths from HIV/AIDS, or methods for incorporation of populationľbased cancer registry dataŚusing standardised methods described in detail in the GBD 2016 mortality [7] and causes of death [10] publications. As noted in other GBD publications, each death is attributed to a single underlying cause in accordance with the ICD. We take steps to standardise cause of death data to address the small fraction of deaths that are not assigned an age or sex, deaths assigned to broad age groups that are not 5 year age groups, and various revisions and national variants of the ICD. Additionally, we identify and redistribute deaths assigned to ICD codes that cannot be underlying causes of death, are intermediate causes of death rather than the underlying causes, or lack specificity in coding. [10]
We restimated causeľspecific mortality using standardised modelling processes Ś most commonly, the Cause of Death Ensemble model, which uses covariate selection and outľofľsample validity analyses and generates estimates for each locationľyear, age, and sex. [10] Additional detail, including model specifications and data availability for each causeľspecific model, can be found in the appendix of the GBD 2016 mortality [7] and causes of death [10] publications. We used the allľcause mortality estimates to establish a reference life table from the lowest death rates for each age group among locations with total populations greater than 5 million. [7] from this reference life table, we multiplied life expectancy at the age of death by causeľspecific deaths to calculate causeľspecific YLLs. We then used the GBD world population age standard to calculate ageľstandardised rates for deaths and YLLs. [7] The GBD world population age standard and the standard life expectancies are available in the appendix of the GBD 2016 mortality publication. [7]
Changes implemented since the Global Burden of Diseases, injuries, and risk factors Study 2015 (GBD 2015) for causeľspecific mortality include incorporation of substantial sources of new mortality data; important model improvements for HIV, malaria, tuberculosis, injuries, diabetes, and cancers; disaggregation of specific causes into subgroupings to provide additional detail (the following were all estimated separately for the first time: alcoholic cardiomyopathy; urogenital, musculoskeletal, and digestive congenital anomalies; Zika virus disease; Guinea worm disease; selfľharm by firearm; sexual violence; myocarditis; and the following types of tuberculosis: extensively drugľresistant tuberculosis, multidrugľresistant tuberculosis without extensive drug resistance, drugľsusceptible tuberculosis, extensively drugľresistant HIV/AIDSľtuberculosis, multidrugľresistant HIV/AIDSľtuberculosis without extensive drug resistance, and drugľsusceptible HIV/AIDSľtuberculosis); modelling of antiretroviral therapy (ART) coverage for each locationľyear by CD4ľpositive cell count at initiation; breakdown of terminal age groups from 80 years and older to 80ľ84 years, 85ľ89 years, 90ľ94 years, and 95 years and older; expansion of the GBD location hiera chy; and changes in the calculation of SDI. [10] The database for GBD 2016 now includes data for the 333 causes estimated for DALYs and new subnational units for Indonesia (n=34) and England (n=150).
for GBD 2016, we included substantial amounts of additional data sources from new studies and our network of collaborators; details of the types of data added can be found in the GBD 2016 cause of death [10] and nonľfatal [8] publications. Additionally, research teams did systematic reviews to incorporate literature data into fatal and nonľfatal models. Further details on search strings are available in the GBD 2016 nonľfatal [8] and cause of death [10] publication appendices. The registrar general of India provided improved verbal autopsy data collected through their Sample registration System, enabling a more detailed and thorough analysis of subnational data for India than in GBD 2015. The methods for constructing the SDI, initially developed for GBD 2015, [15] were revised for GBD 2016 to account for expansion in the number of subnational estimates and the effect of a growing time period of estimation given fixed limits for index components. [10] The components of SDIŚtotal fertility rate (TF ), educational attainment in the population aged older than 15 years, and lagľdistributed income (LDI)Śare based on new systematic assessments of educational attainment, LDI, and fertility, and each component is scaled relative to maximum effect on health outcomes. [10]
In most cases, we restimated nonľfatal health loss using the Bayesian metaľregression tool DisModľM 2.1 to synthesise variable data sources to produce internally consistent estimates of incidence, prevalence, remission, and excess mortality. [16] Causeľspecific data availability and epidemiological characteristics required additional analytical techniques in some cases (details are available in the appendix of the GBD 2016 nonľfatal publication [8]); these causes include many neglected tropical diseases (NTDs) such as dengue, as well as injuries, malaria, and HIV/AIDS. [17, 18]
We restimated each nonľfatal sequela separately and assessed the occurrence of comorbidity in each age group, sex, location, and year separately using a microsimulation framework. We distributed disability estimated for comorbid conditions to each contributing cause during the comorbidity estimation process. Although the distribution of sequelae Ś and therefore the severity and cumulative disability per case of a condition Ś can be different by age, sex, location, and year, previous studies have found that disability weights do not substantially vary across locations, income, or levels of educational attainment. [19, 20] In the GBD study, disability weights were based on population surveys with 60,890 respondents and held invariant between locations and over time. [20] Additional details, including model specifications and data availability for each causeľspecific model and development of disability weights by cause and their use in the estimation of nonľfatal health loss, are available in the appendix of the GBD 2016 nonľfatal publication. [8]
For nonľfatal estimation, several methodological changes were made for GBD 2016. New data for the main causes of YLDs were identified through our collaboration with the Indian Council of Medical Research and the Public Health Foundation of India. For particular risk factors and diseases, the volume of available data increased substantially, such as child growth failure (stunting, wasting, or underweight), anaemia, congenital anomalies, schistosomiasis, intestinal helminths, and lymphatic filariasis. We have improved our analysis of total admissions per person by country, year, age, and sex, which facilitated incorporation of additional hospital data sources that were previously excluded because of incomplete knowledge of catchment population size. We extended our analyses of linked USA medical claims data to impute ageľspecific and sexľspecific ratios for multiple admissions per illness episode, ICD code appearance in the nonľprimary position, and inpatient versus outpatient use. [8] We applied each of the three ratios sequentially to non-linked hospital inpatient data from elsewhere that only had a single ICD code per visit to adjust prevalence and incidence data. We have incorporated more predictive covariates into our non-fatal disease models to better predict variation in disease levels rather than measurement error as the source of variation, and we improved our analysis of the MIRs for cancers, resulting in considerably higher ratios in lower SDI quintiles and thus substantially lower YLD estimates for cancer.
Estimation of DALYs, HALE, and co esponding uncertainty
We calculated DALYs as the sum of YLLs and YLDs for each cause, location, age group, sex, and year. [8, 10] The same estimates of YLDs per person for each location, age, sex, and year from 1990 to 2016 are used to establish HALE by age group within abridged multipleľdecrement life tables with use of methods developed by Sullivan. [9]
For all results, we report 95% uncertainty intervals (UIs) derived from 1000 draws from the posterior distribution of each step in the estimation process. Unlike confidence intervals, UIs capture uncertainty from multiple modelling steps, as well as from sources such as model estimation and model specification, rather than from sampling error alone. Uncertainty associated with estimation of mortality and YLLs reflects sample sizes of data sources, adjustment and standardisation methods applied to data, parameter uncertainty in model estimation, and uncertainty within all-cause and cause-specific mortality models. For estimation of prevalence, incidence, and YLDs, UIs incorporated variability from sample sizes within data sources, adjustments to data to account for non-reference definitions, parameter uncertainty in model estimation, and uncertainty associated with establishment of disability weights. Because direct information about the correlation between uncertainty in YLLs and YLDs was scarce, we assumed that uncertainty in age-specific YLDs was independent of age-specific YLLs or death rates.
Epidemiological teransition and relationship between DALYs, HALE, and SDI
For GBD 2016, the composite indicator of SDI was again based on the geometric mean of three measuresŚLDI per person, average years of schooling among populations aged 15 years or older, and TFRŚbut the analysis was strengthened in three important ways. [10] First, we substantially revised estimates of education, adding new data and improved methods for subnational locations. Second, instead of using estimates of TFR from the UN Population Division, we systematically reviewed, extracted, and analysed fertility data from all available locations to derive a time series of TFR for each national and subnational GBD location. [7] Third, rather than rescaling SDI on the basis of the full range of observed values within the time series, we developed a fixed scale for GBD 2016; details on development of this fixed scale are available in the GBD 2016 mortality publication. [7] We examined the average relationship between DALYs, HALE, and SDI using a Gaussian process regression model; we used these regressions to estimate expected values of these summary measures at each level of SDI. Additional detail on SDI calculation and location-specific SDI values are available in the appendix of the GBD 2016 mortality publication. [7]
Data sharing
The statistical code used in the entire process is available through an online repository.
Role of the funding source
The funder of the study had no role in study design, data collection, data analysis, data interpretation, or writing of the report. The corresponding author had full access to all the data in the study and had final responsibility for the decision to submit for publication.
Results
Global levels of and trends for DALYs and HALE

Table 1 The total number of allľage DALYs in 2016 was 2Ě39 billion (95% UI 2Ě18 billion to 2Ě63 billion). Total allľage DALY counts for CMNN causes fell by 40Ě1% (37Ě4ľ42Ě7) from 1Ě11 billion (1Ě07 billion to 1Ě16 billion) in 1990 to 668 million (632 million to 708 million) in 2016, whereas total allľage DALY counts from NCDs increased by 36Ě6% from 1Ě07 billion (958 million to 1Ě20 billion) in 1990 to 1Ě47 billion (1Ě30 billion to 1Ě66 billion) in 2016 (Table 1). Total DALYs from injuries decreased by 1Ě6% (ľ3Ě8 to 6Ě2) from 260 million (243 million to 277 million) in 1990 to 255 million (236 million to 281 million) in 2016. Age groups older than 80 years had 149 million (139 million to 159 million) allľage DALYs in 2016 compared with 75Ě1 million (71Ě1 million to 79Ě5 million) in 1990, with increases across all SDI quintiles. Of these, 87Ě8% were due to NCDs in 2016 compared with 86Ě8% in 1990.
Table 2
Table 3 From 1990 to 2016, global HALE at birth increased from 56Ě9 years to 63Ě1 years, with 160 of 195 locations registering significant improvements. Global HALE increased by an average of 6Ě24 years (95% UI 5Ě97ľ6Ě48) for both sexes combined. Globally, HALE at birth increased from 55Ě38 years (53Ě27ľ57Ě31) in 1990 to 61Ě42 years (59Ě01ľ63Ě58) in 2016 for males and from 58Ě42 years (55Ě80ľ60Ě77) to 64Ě91 years (61Ě88ľ67Ě54) for females, rising 6Ě04 years (5Ě74ľ6Ě27) for males and 6Ě49 years (6Ě08ľ6Ě77) for females (Table 2, Table 3). The total number of years of functional health lost (life expectancy minus HALE) increased from 1990 to 2016, from 8Ě22 years to 9Ě34 years. The gap between life expectancy at birth and HALE, which represents years of functional health lost, grew between 1990 and 2016 from 7Ě32 years (life expectancy 62Ě70 [62Ě42ľ62Ě99] vs HALE 55Ě38 [53Ě27ľ57Ě31]) to 8Ě37 years (69Ě79 [69Ě29ľ70Ě22] vs 61Ě42 [59Ě01ľ63Ě58]) for males and from 9Ě15 years (67Ě57 [67Ě33ľ67Ě77] vs 58Ě42 [55Ě80ľ60Ě77]) to 10Ě42 years (75Ě33 [74Ě95ľ75Ě64] vs 64Ě91 [61Ě88ľ67Ě54]) for females. Globally, in 2016, life expectancy at age 65 years was 18Ě57 years (18Ě37ľ18Ě72) for females and 15Ě72 years (15Ě61ľ15Ě83) for males, whereas HALE was 13Ě88 years (12Ě57ľ15Ě02) for females and 11Ě87 years (10Ě83ľ12Ě80) for males. HALE increased by 1Ě96 years (1Ě69ľ2Ě13) from 11Ě92 (10Ě88ľ12Ě89) in 1990 for females and by 1Ě78 years (1Ě61ľ1Ě93) from 10Ě09 years (9Ě22ľ10Ě87) for males.
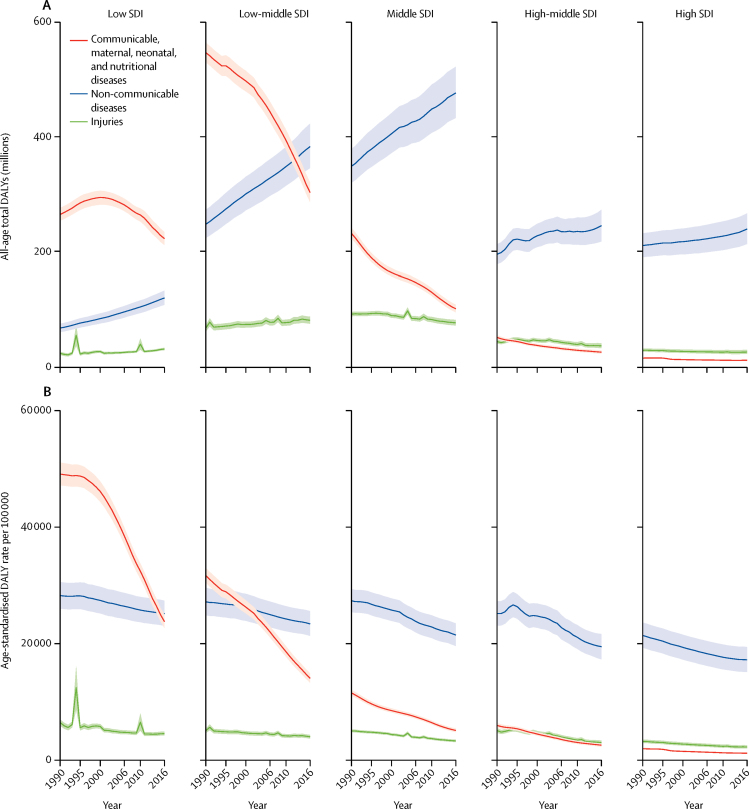
Figure 1 Global trends for all-age DALYs and age-standardised DALY rates for Level 1 causes by SDI quintile are shown in Figure 1. Trends in total DALYs, which show the absolute burden at each SDI quintile, are shown in figure 1A. The figure highlights the large burden and subsequent declines in low-middle-SDI (decreased by 44Ě5% [95% UI 41Ě3ľ47Ě6]) and middle-SDI (decreased by 56Ě2% [53Ě6ľ59Ě0]) locations for CMNN DALYs from 1990 to 2016, offset by large increases for NCD DALYs over the same time period in low-middle SDI (increased by 54Ě4% [47Ě9ľ60Ě8]) and middle-SDI (increased by 36Ě5% [39Ě9ľ32Ě8]) locations. Progress has been made in low-SDI countries for CMNN DALYs, which decreased by 20Ě7% (16Ě8ľ24Ě7) since 2006. At all levels of SDI, total NCD DALYs have increased since 1990. Trends in age-standardised ratesŚwhich account for both population size and age structureŚemphasise the reduction in the contribution of CMNN causes to DALYs, both over time and with increasing SDI (figure 1B). These rapid decreases in age-standardised rates were fastest at low SDI, where age-standardised DALY rates from CMNN causes decreased by 51Ě5% (49Ě0ľ54Ě1) between 1990 and 2016 to be on par with age-standardised DALY rates for NCDs in 2016. At low-middle SDI, age-standardised CMNN DALY rates were more than double those for NCDs in 1990 (31Ě7 thousand [30Ě3 thousand to 33Ě3 thousand] per 100?000), but decreased to 14Ě1 thousand (13Ě2 thousand to 15Ě1 thousand) per 100?000 in 2016. At all other levels of SDI, age-standardised DALY rates for CMNN causes were lower than those for NCDs and lower than those of injuries in the high-SDI quintile. Reductions in age-standardised rates for NCDs occurred across all levels of SDI between 1990 and 2016, a trend that was also evident, albeit less strongly, for age-standardised DALY rates from injuries.
Global causes of DALYs
Age-standardised DALY rates for all causes decreased by 30Ě5% (95% UI 28Ě6ľ32Ě6) between 1990 and 2016 (appendix pp 49ľ62). In 2016, CMNN causes accounted for 28Ě0% (26Ě4ľ29Ě7) of global DALYs, NCDs contributed 61Ě4% (59Ě4ľ63Ě2), and injuries contributed 10Ě7% (10Ě1ľ11Ě3; appendix pp 35ľ48). From 2006 to 2016, CMNN causes decreased by 31Ě9% (29Ě7ľ34Ě2), with 48 Level 4 CMNN causes experiencing decreases in age-standardised DALY rates of greater than 20% (table 1). Decreases were greater than 70% for three infectious diseases: Guinea worm disease (decreased by 99Ě6% [99Ě5ľ99Ě7]), human African trypanosomiasis (decreased by 78Ě2% [68Ě8ľ84Ě6]), and measles (decreased by 73Ě6% [68Ě8ľ77Ě8]). By contrast with the overall trend of decreasing DALYs, a subset of Level 4 CMNN causes had increases in age-standardised DALY rates, including dengue (50Ě5% [24Ě7ľ97Ě7]) and cutaneous and mucocutaneous leishmaniasis (12Ě5% [1Ě7ľ26Ě1]). Overall, total all-age DALYs attributable to maternal disorders decreased by 23Ě9% (17Ě4ľ29Ě3) between 2006 and 2016 and by 30Ě4% (24Ě4ľ35Ě4) in terms of age-standardised DALY rates. As a cause group, neonatal disorders decreased by 22Ě8% (18Ě9ľ26Ě8) in all-age DALYs and 23Ě1% (19Ě2ľ27Ě0) in terms of age-standardised DALY rates over the same time period; however, this decrease was not significant for neonatal sepsis. Total DALYs from the London Declaration NTDs was 9Ě0 million (5Ě3 million to 14Ě5 million) in 2016.
In 2016, the leading Level 3 causes of total DALYs among NCDs included ischaemic heart disease (175 million [95% UI 170 million to 180 million] DALYs), cerebrovascular disease (116 million [111 million to 121 million]), and low back and neck pain (87 million [61 million to 114 million]), comprising 16Ě1% (13Ě99ľ17Ě67) of all DALYs (table 1). Among chronic respiratory diseases, all causes, with the exception of interstitial lung disease, pulmonary sarcoidosis, and other chronic respiratory diseases, decreased in age-standardised DALY rates between 2006 and 2016, whereas total all-age DALY counts increased from 2006 to 2016 for all chronic respiratory diseases, with the exception of silicosis. Cirrhosis and other chronic liver diseases had a mean change of 7Ě6% (2Ě5ľ13Ě7) from 2006 to 2016 in total all-age DALY counts, but had a mean decrease in age-standardised DALY rates of 12Ě0% (7Ě2ľ16Ě1) over the same period. Age-standardised DALY rates of digestive diseases decreased from 2006 to 2016, with a mean percentage decrease of 13Ě6% (10Ě8ľ16Ě4); however, all-age DALY counts for digestive diseases increased by 4Ě1% (0Ě4ľ7Ě7) over the same period. Total DALYs associated with most neurological disorders increased from 2006 to 2016, with Alzheimer's disease and other dementias (increase of 37Ě5% [35Ě3ľ39Ě7]) and Parkinson's disease (increase of 35Ě6% [32Ě9ľ38Ě2]) increasing by more than 30% each. Between 2006 and 2016, various NCDs significantly increased in terms of both total burden and age-standardised DALY rates. Several mental and substance use disorders followed this pattern, including eating disorders (age-standardised DALY rates increased by 8Ě9% [7Ě6ľ10Ě1]) and bipolar disorder (increased by 0Ě8% [0Ě2ľ1Ě4]). Diabetes (all-age DALY count increased by 24Ě4% [22Ě7ľ26Ě2]) and chronic kidney disease (increased by 20Ě0% [17Ě4ľ22Ě7]) both also increased in all-age DALY counts, as did musculoskeletal disorders (increased by 19Ě6% [18Ě5ľ20Ě8]).
Percentage change in age-standardised DALY rates of unintentional injuries (decreased by 15Ě1% [95% UI 12Ě2ľ18Ě0]), road injuries (decreased by 14Ě7% [12Ě8ľ16Ě8]), and transport injuries (decreased by 14Ě3% [12Ě3ľ16Ě4]) each decreased substantially between 2006 and 2016 (table 1). Among unintentional injuries, drowning had the largest reduction in both all-age DALY burden (26Ě6% [20Ě1ľ30Ě1]) and age-standardised DALY rates (32Ě1% [26Ě1ľ35Ě4]) from 2006 to 2016. Age-standardised DALY rates from self-harm (decreased by 17Ě7% [12Ě9ľ21Ě2]) and interpersonal violence (12Ě0% [7Ě0ľ16Ě1]) have both decreased by more than 10% since 2006. Age-standardised DALY rates resulting from conflict and terrorism increased by 97Ě4% (25Ě7ľ240Ě9) from 2006 to 2016; this rise was primarily driven by ongoing conflicts in north Africa, the Middle East, and sub-Saharan Africa. This result represents an increase in all-age DALYs of 114Ě0% (36Ě2ľ271Ě3) from 2006 to 2016.
Global DALY counts in 2016 for causes that were estimated separately for the first time are as follows: alcoholic cardiomyopathy 2Ě59 million (95% UI 2Ě06 million to 3Ě24 million), urogenital congenital anomalies 1Ě09 million (0Ě86 million to 1Ě31 million), congenital musculoskeletal and limb anomalies 2Ě26 million (1Ě66 million to 2Ě99 million), digestive congenital anomalies 3Ě34 million (2Ě67 million to 4Ě96 million), Zika virus disease 5100 (3400ľ8000), Guinea worm disease 0Ě87 (0Ě5ľ1Ě35), self-harm by firearm 2Ě85 million (2Ě39 million to 3Ě59 million), sexual violence 1Ě37 million (0Ě92 million to 1Ě95 million), myocarditis 1Ě37 million (1Ě12 million to 1Ě51 million), drug-susceptible tuberculosis 39Ě9 million (38Ě1 million to 41Ě9 million), multidrug-resistant tuberculosis without extensive drug resistance 3Ě32 million (2Ě79 million to 3Ě91 million), extensively drug-resistant tuberculosis 369?000 (301?000ľ445?000), drug-susceptible HIV/AIDS-tuberculosis 11Ě7 million (8Ě15 million to 15Ě5 million), multidrug-resistant HIV/AIDS-tuberculosis without extensive drug resistance 0Ě98 million (0Ě60 million to 1Ě48 million), and extensively drug-resistant HIV/AIDS-tuberculosis 57?300 (34?500ľ89?400; table 1).
Changes in leading causes of disease burden ove time and SDI quintiles
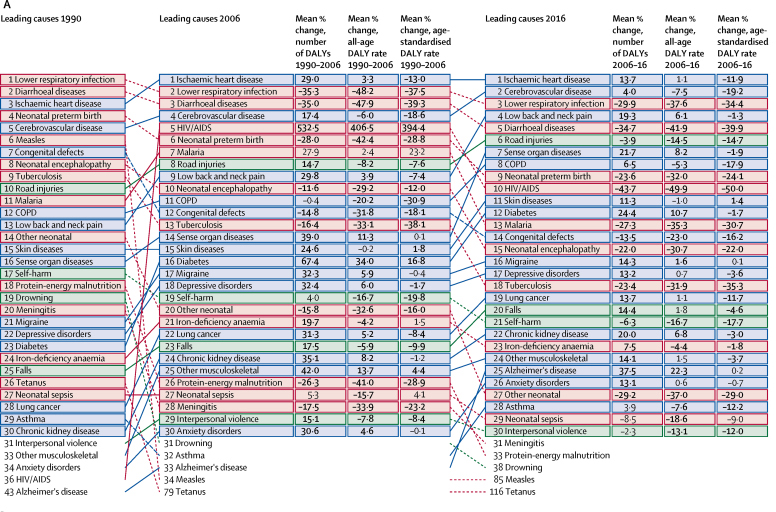
Figure 2 The leading Level 3 causes of global DALYs in 1990 were lower respiratory infections, diarrhoeal diseases, and ischaemic heart disease (Figure 2A). By 2016, lower respiratory infections had decreased in relative rank to the third-leading cause, whereas diarrhoeal diseases were fifth and ischaemic heart disease rose to first. The leading 30 causes of DALYs by SDI quintile varied considerably (figure 2BľF). CMNN causes were dominant in the low-SDI quintile, occupying 11 of the top 15 causes in 2016. NCDs were more commonly among the leading causes of DALYs with successively higher levels of SDI, occupying 12 of the top 15 causes in the high-SDI quintile in 2016.
For low SDI, only two NCD causes (congenital birth defects and ischaemic heart disease) ranked in the top ten in 2016, compared with all of the top ten for high SDI. Of the leading 30 causes from 2006 to 2016, HIV/AIDS had the largest decrease in age-standardised DALY rates for low, low-middle, and middle SDI. For high-middle SDI, the largest decrease was for lower respiratory infection, and for high SDI, the largest decrease was for road injuries. At low-middle SDI, 14 of the leading 30 causes in 2016 were NCDs, whereas 13 were CMNN causes and three were injuries, compared with middle SDI, where seven were CMNN causes, 19 were NCDs, and four were injuries. The leading seven causes for low, low-middle, and middle SDI quintiles all decreased in age-standardised DALY rates from 2006 to 2016.
At high-middle and high SDI, the leading three causes of DALYs remained the same from 2006 to 2016 (ischaemic heart disease, low back and neck pain, and cerebrovascular disease). Two of the leading 30 causes for high-middle SDI were CMNN causes in 2016, whereas 24 were NCDs and four were injuries, compared with high SDI, where one was a CMNN cause, 26 were NCDs, and three were injuries. The leading five causes for high-middle SDI decreased in age-standardised DALY rates from both 1990 to 2006 and 2006 to 2016, although this pattern did not hold for high SDI, where just the leading cause decreased over both intervals. Road injuries and falls are the only injuries that appear across all five SDI quintiles; self-harm appears in all quintiles except for low SDI. Ischaemic heart disease and cerebrovascular disease appear in the leading 13 causes across all SDI quintiles. HIV/AIDS appears in the leading ten causes for all quintiles except for high and high-middle SDI, where it did not appear in the leading 30.
Regional and country-specific HALE and DALYs in 2016
In 2016, HALE at birth was highest in Singapore for both females (75Ě2 years [95% UI 71Ě9ľ78Ě6]) and males (72Ě0 years [68Ě8ľ75Ě1]) and lowest for females in the Central African Republic (45Ě6 years [42Ě0ľ49Ě5]) and for males in Lesotho (41Ě5 [39Ě0ľ44Ě0]; Table 2, Table 3). In 2016, HALE at birth was greater than 70 years in only 12 locations for males and was greater than this threshold in 49 locations for females. HALE at birth was less than 50 years for both sexes in three locations: the Central African Republic, Lesotho, and Afghanistan. Between 1990 and 2016, HALE at birth increased for males in 160 locations and for females in 167 locations. For males, the largest increase occurred in Ethiopia, rising from 39Ě3 years (37Ě5ľ41Ě0) in 1990 to 57Ě2 years (54Ě1ľ60Ě45) in 2016. For females, the largest increase occurred in the Maldives, rising from 53Ě6 (51Ě1ľ56Ě1) in 1990 to 70Ě3 (66Ě3ľ73Ě7) in 2016. Over the same time period, HALE at birth decreased in just two countries for females (Lesotho and South Africa) and three for males (Lesotho, South Africa, and Swaziland). In 2016, HALE at age 65 years was highest in Singapore for males (15Ě1 years [13Ě4ľ16Ě8]) and Japan for females (18Ě7 years [17Ě1ľ20Ě0]), whereas it was lowest for males in Lesotho (6Ě9 years [6Ě0ľ7Ě8]) and females in Afghanistan (7Ě4 years [6Ě5ľ8Ě3]).
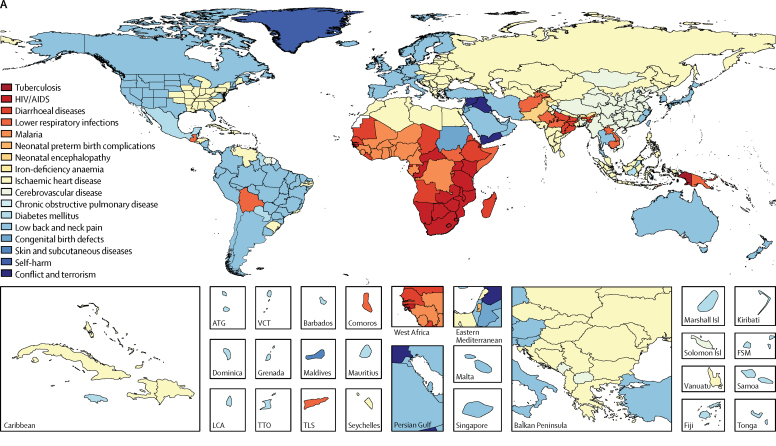
Figure 3 The leading Level 3 causes of DALYs in 2016 varied by country, but with regional commonalities, described on the basis of GBD regions12 in Figure 3. Across the 46 countries within sub-Saharan Africa, the leading Level 3 cause of DALYs for females was either HIV/AIDS (17 countries), malaria (13 countries), or diarrhoeal diseases (nine countries). Cerebrovascular disease, ischaemic heart disease, and low back and neck pain were the most common leading Level 3 causes of all-age DALYs for females in all GBD regions except for Oceania, Andean Latin America and central Latin America, and all regions of sub-Saharan Africa. Among the 34 countries in the high-income super-region, low back and neck pain was the leading cause of DALYs for females in all but three countries. Exceptions within the region were Greece and the USA, for which ischaemic heart disease was the leading cause of DALYs, and Greenland, where self-harm was the highest cause of DALYs for females (and for males). For males, these regional commonalities also occurred, but with some notable differences in the leading causes by location compared with females. Leading causes of DALYs for males in sub-Saharan Africa were broadly similar to those for females: HIV/AIDS (16 countries), malaria (11 countries), or lower respiratory infections (nine countries). Cerebrovascular disease or ischaemic heart disease was the leading cause of all-age DALYs for males in almost all GBD regions except for Andean Latin America, central Latin America, tropical Latin America, high-income Asia Pacific, and all regions of sub-Saharan Africa. Exceptions within the regions included Greenland, where self-harm was the leading cause of DALYs for males in 2016, Peru, where lower respiratory infection was the leading cause, and Nicaragua, where chronic kidney disease was the leading cause. The leading cause of DALYs for both males and females in Syria and Iraq was conflict and terrorism, reflecting the ongoing conflict.
Epidemiological transition
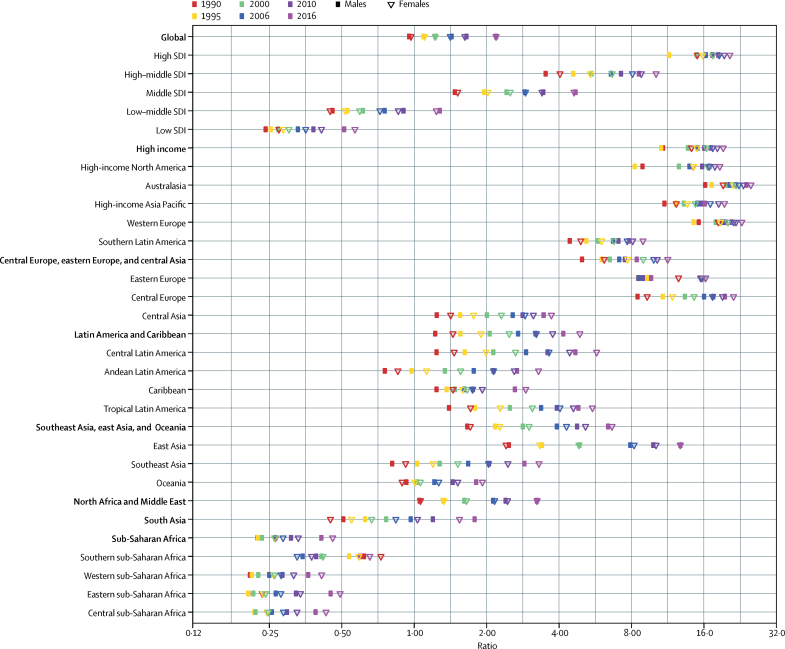
Figure 4 The shift in the global burden of DALYs from CMNN to NCDs is a clear indicator of the epidemiological transition. [21] The ratios of DALYs from NCDs to those from CMNN diseases in 1990, 1995, 2000, 2006, 2010, and 2016 are shown by SDI and at the global, GBD regional, and GBD super-regional scales for both males and females in figure 4. In 2016, 17 (of 21) GBD regions and six (of seven) GBD super-regions had a ratio of more than 1 for either men or women, representing the shift to more DALYs from NCDs than from CMNN diseases, compared with 13 regions and five super-regions in 1990. In 2016, females had more DALYs due to NCDs relative to CMNN causes than did males, with higher ratios in 14 regions. This figure also shows how these ratios shift with increasing SDI, with 18Ě5 as the 2016 ratio for high SDI for men and 20Ě5 for women and 0Ě52 for men in low SDI and 0Ě57 for women. Several regions showed large shifts toward more NCD DALYs than CMNN DALYs, with 12 regions doubling in ratio from 1990 to 2016 for females and 11 regions doubling for males over the same time period.
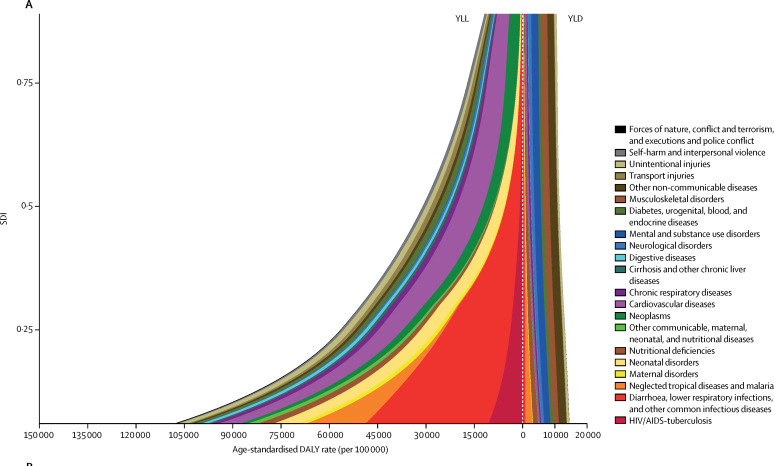
Figure 5 Expected age-standardised YLL rates decreased substantially with increasing SDI, most notably because of decreases in CMNN causes, such as diarrhoea, lower respiratory infections, and other common infectious diseases; NTDs and malaria; neonatal disorders; nutritional deficiencies; and HIV/AIDS and tuberculosis (Figure 5A). Several causes had their largest expected age-standardised rates at intermediate levels of SDI, such as diabetes, urogenital, blood, and endocrine diseases; cardiovascular diseases; and chronic respiratory diseases. Causes that increased in expected age-standardised YLL rates with increasing SDI included neoplasms and neurological disorders. Much less variation was estimated for expected age-standardised YLD rates with SDI than for YLL rates. Although the relationship between disability and SDI was generally constant for most Level 2 causes, nutritional deficiencies, NTDs, and malaria resulted in greater than expected levels of disability at lower SDI.
Compared with YLLs and YLDs expressed as all-age rates, the consequences of differences in population age structure become apparent for a number of causes (Figure 5B). Cardiovascular diseases, in particular, result in greater YLLs at higher SDI in terms of all-age rates, reflecting the older age of populations at higher levels of SDI. By contrast, the pattern observed when standardising for age structureŚYLLs accruing at intermediate SDIŚhighlights health loss from diseases that typically manifest at older ages undistorted by the lower overall age structure of the populations. The expected all-age YLD rates generally increased with rising SDI, particularly for mental and substance use disorders and musculoskeletal disorders, although variation with SDI remained substantially lower than for YLLs.
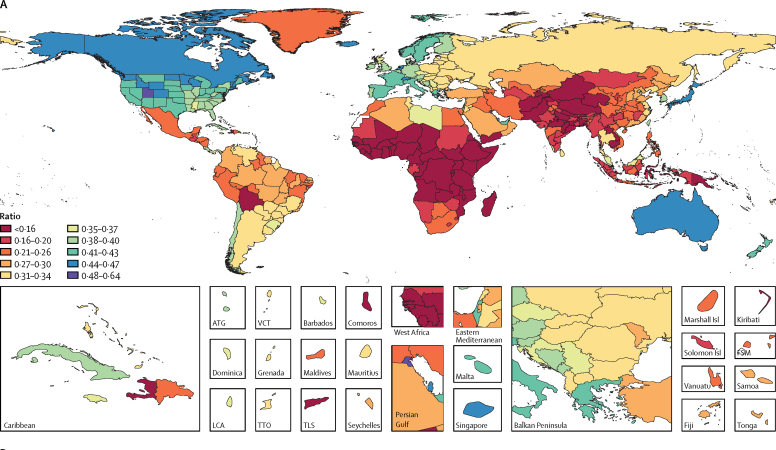
Figure 6 The proportion of DALYs due to YLDs versus YLLs has shifted distinctly since 1990, and these changes are shown in Figure 6. More all-age DALYs as a result of YLDs rather than YLLs indicates a reduction in premature death, with individuals living longer with disability than previously. Globally, 95Ě9% of countries increased in the proportion of all-age DALYs due to YLDs from 1990 to 2016. In 2016, Kuwait (0Ě64), Qatar (0Ě63), and Bahrain (0Ě60) had the highest ratios of DALYs due to YLDs, whereas Chad (0Ě14), Niger (0Ě14), and the Central African Republic (0Ě13) had the lowest. This finding is a change from 1990, when the highest three proportions were for Andorra (0Ě49), Kuwait (0Ě48), and Iceland (0Ě47), and the lowest three were for Burundi (0Ě08), Malawi (0Ě08), and Niger (0Ě06).
Observed versus expected total and cause-specific burden
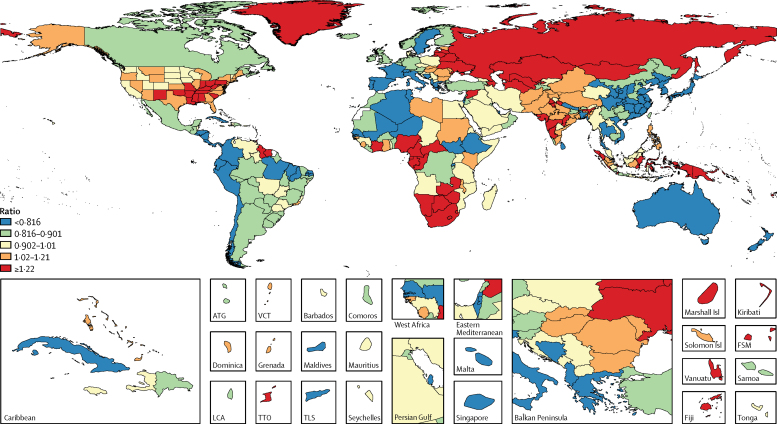
Figure 7 As shown in Figure 7, 83 countries had greater than expected age-standardised DALY rates on the basis of SDI in 2016 (a ratio of observed to expected age-standardised DALY rate of greater than 1), generally within central Europe, eastern Europe, and central Asia (20 of 29 countries) or in the super-region of sub-Saharan Africa (24 of 46 countries). Among the 34 locations in the five regions within the high-income GBD super-region, three had greater than expected DALYs relative to their SDI. The five locations with the lowest level of age-standardised DALYs relative to the level expected on the basis of SDI were Nicaragua, Costa Rica, the Maldives, Peru, and Israel. Countries within western Europe (eg, France, Norway, and Iceland), western sub-Saharan Africa (eg, The Gambia, Senegal, and Liberia), eastern sub-Saharan Africa (eg, Ethiopia, Rwanda, and Burundi), east Asia (eg, China), and a subset of countries in south and southeast Asia (eg, Bhutan and Bangladesh) all had ratios of observed to expected DALY rates of less than 1 in 2016. The five locations with the highest age-standardised DALY rates relative to the rates expected on the basis of SDI were Lesotho, Swaziland, South Africa, Fiji, and Botswana, with Lesotho's ratio of observed to expected measured at 2Ě43 in 2016.
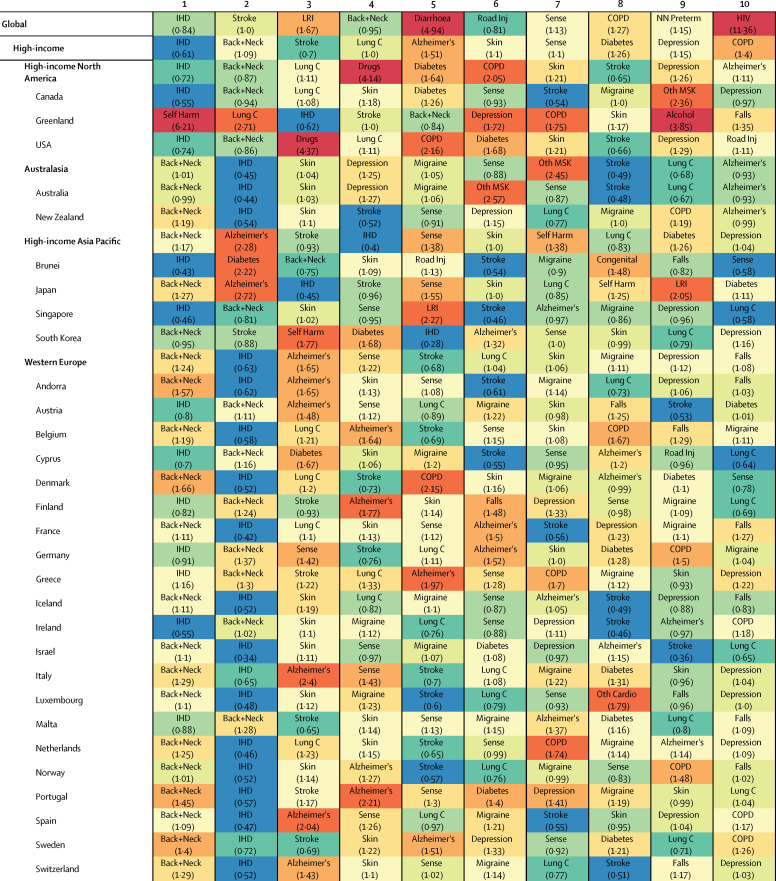
Figure 8 Worldwide, ischaemic heart disease and stroke remained the two leading causes of DALYs, and expected levels were close to those observed at a global scale, with ratios of 0Ě84 for ischaemic heart disease and 1Ě0 for stroke (Figure 8). The ratio of observed to expected DALYs ranged from 0Ě24 in Qatar to 3Ě33 in Ukraine for ischaemic heart disease and from 0Ě32 in Oman to 2Ě98 in Bulgaria for stroke. This ratio was less than 1 for 114 of 167 global locations for ischaemic heart disease and 91 of 145 for stroke. Low back and neck pain resulted in fewer than expected DALYs globally, with a ratio of 0Ě95 globally and 74 locations showing a ratio of less than 1. Of the ten leading causes for each location, observed levels of DALYs were frequently greater than expected on the basis of SDI for causes such as diabetes mellitus (ratio of observed to expected DALYs of greater than 1 in 95 global locations), sense organ diseases (79 locations), and skin and subcutaneous diseases (72 locations).
Causes that resulted in greater than expected DALYs for both sexes combined showed strong regional patterns. In the GBD high-income super-region, of the leading ten causes of DALYs, COPD had greater than expected DALYs in 14 of 34 locations and less than expected in none. Observed DALYs were frequently greater than expected for low back and neck pain (27 locations), although the ratio did not exceed 1Ě66 for any single location. Although drug use disorders were only within the leading ten causes for one location in the high-income super-region, the ratio of observed to expected DALYs in the USA was 4Ě37. In addition to being the most common leading causes of DALYs, ischaemic heart disease and stroke were sources of more DALYs than expected for most locations in the central Europe, eastern Europe, and central Asia super-region. Here, the highest ratio of observed to expected DALYs was 3Ě33 for ischaemic heart disease and 2Ě98 for stroke. Mental and substance use disorders were also notable in the region for the high levels of observed DALYs relative to those expected, particularly in eastern Europe, where the ratio for the Level 4 cause of alcohol use disorders was 5Ě38 and ranged from 3Ě33 in Moldova to 5Ě7 in Russia. For locations in the super-region of Latin America and Caribbean, the burden from interpersonal violence was greater than expected, with a ratio of 3Ě37 for the super-region and ranging from 1Ě68 in Ecuador to 7Ě22 in Venezuela. Diabetes was also a source of greater than expected burden in this super-region, with DALYs exceeding expected levels in 19 of 37 locations. Additionally, diabetes contributed to a higher burden of DALYs in many locations in the super-region of southeast Asia, east Asia, and Oceania, with ratios of observed to expected levels ranging from 0Ě68 in the Maldives to 10Ě48 in Fiji.
In south Asia, neonatal encephalopathy due to birth asphyxia and trauma caused greater than expected DALYs for two countries, with ratios of 1Ě01 in Nepal and 2Ě72 in Pakistan. Ongoing conflicts in north Africa and the Middle East were reflected in higher than expected DALYs in seven of the 21 locations in the region. Patterns of observed DALYs compared with those expected in sub-Saharan Africa were dominated by the ongoing effect of HIV/AIDS, particularly in southern sub-Saharan Africa. Observed levels of DALYs exceeded those expected in 37 of 46 locations, ranging from a ratio of 8Ě10 in Burundi to 316Ě34 in Lesotho.
The five locations with the largest magnitude of improvementŚa decrease in the difference between observed and expected all-cause age-standardised DALY rates from 1990 to 2016Śincluded Greenland, the Maldives, Bermuda, Ethiopia, and Liberia. The five locations that showed the smallest decrease in the difference between observed and expected DALY rates over the period 1990ľ2016 were Lesotho, Swaziland, Syria, South Africa, and Botswana.
Discussion
General findings
Although the world has become healthier since 1990, this progress has been highly heterogeneous. From 1990 to 2016, global HALE at birth increased. The total number of years of functional health lost (life expectancy minus HALE) increased from 1990 to 2016, indicating an absolute expansion of morbidity. YLL rates have fallen more rapidly than YLD rates so that non-fatal health loss as a proportion of DALYs has grown from 1990 to 2016. This progress has been driven by marked reductions in DALYs due to CMNN causes and, to a lesser extent, by declines in age-standardised NCD and injury DALYs. Population growth in the past 27 years (from 5Ě27 billion to 7Ě39 billion) has resulted in a significant increase in total DALYs due to NCDs, coupled with a high total DALY burden in 2016, thus leading to an overall increasing toll on health systems. [22, 23] GBD 2016 continues to unequivocally show an absolute expansion of morbidity [4] Ś that is, as life expectancy increases across a population, the absolute amount of functional health loss increasesŚbut GBD 2016 also shows a relative compression of morbidityŚthat is, the proportion of total life spent ill per person decreases with increasing SDI. [24] Substantial opportunities remain for innovation in human resources for health, development assistance for health, and targeted health policies to alleviate causes of old-age disability and transform the experience of later life for billions of people. [25]
From 1990 to 2016, life expectancy, HALE, and years lived with functional health loss all increased as populations moved through the SDI quintiles. These quintiles reflect in a geographical cross section of the world what is seen through time during the epidemiological transition. The rapid decrease in burden from CMNN diseases from low to high SDI quintile was most substantial. NCDs and injuries were also seen to decline, but at much more modest rates. Declines in fertility, increases in education, and increases in income per person (the triad of inputs into the SDI composite), were tightly coupled with population-based HALE outcomes. [26] This finding suggests that the wide agendas of these three social determinants of health have roles within discussions of overall health system strengthening. Further dissection of the results clearly shows that a substantial impact has been made on the global burden of YLLs. A much more modest effect, however, has been made on the burden of large causes of YLDs at all levels of SDI. The contrast in this ratio is marked and illustrates another striking view of the epidemiological transition when looking at the proportion of DALYs due to YLDs globally. Although continued progress on reduction of YLLs prematurely is important, how to ameliorate the primary causes and underlying risks of YLDs globally should be reflected on (low back and neck pain, sense organ diseases, and skin diseases) to decrease the time that ageing populations live with functional health loss across the SDI spectrum. This persisting burden of morbidity highlights the importance, both in terms of relief of suffering and prevention of health-care costs, of placement of emphasis on prevention of disabling illness and mitigation of the ill effects of the disabling conditions that do occur.
Crossľcutting themes
The concept of the grand convergence Ś that levels of under-5 and maternal mortality, as well as selected infectious diseases, would converge across SDI quintiles within a generation Ś was promoted in the Lancet Commission on investing in health [27] and discussed in the GBD 2015 results. [4] The conclusion that DALY convergence is likely to be accelerated by escalating increases in SDI remains valid. We have looked a step further in GBD 2016 and highlighted countries that have most improved and showed the largest declines in their DALY performance relative to that expected on the basis of their SDI.
The pace and efficiency of a country's transition through the SDI quintiles and the concurrent improvements in population summary health metrics is by no means inevitable, however, and analysis derived from the ratio of observed to expected DALYs on the basis of SDI has been informative. The exemplars were Nicaragua, Costa Rica, the Maldives, Peru, and Israel, which had the lowest levels of age-standardised DALYs relative to the levels expected on the basis of SDI in 2016. The appendix (pp 63ľ66) contains a full list of exemplars. These countries considerably outperformed health expectations relative to their development status. Conversely, Lesotho, Swaziland, South Africa, Fiji, and Botswana had the highest levels of age-standardised DALYs relative to those expected, reflecting a need for additional attention and examination of the reasons for these discrepancies. Lesotho had the highest ratio of age-standardised DALYs relative to that expected, which indicates poor performance in terms of health outcomes for mortality and morbidity relative to their SDI status.
The reasons for the success in health outcomes of the five exemplars merit in-depth analyses. Conversely, with the exception of Fiji (which is heavily impacted by the high levels of diabetes seen throughout Oceania), the poor performers in 2016 were clearly those that were most devastated by the continuing HIV/AIDS epidemic and, although progress has been made in South Africa, Swaziland, Zimbabwe, and Lesotho are still disproportionately affected. Many different locations within the top ten exemplars and ten poor performers would make excellent case studies to assess the reasons for their relative rankings, particularly given the different health challenges and successes for each nation.
By highlighting exemplars and poor performers across the SDI quintiles, we have seen that the underlying influences that have contributed to the relative successes and failures of nations are substantially heterogeneous. A clear corollary is that the policy implications for reform will not be the same between quintiles. Nation-by-nation complexity in how countries progress through the SDI continuum and how population health summaries track is clearly too voluminous to document in this study by nation, but we hope that the results of this study will spawn a plethora of derivative and policy-relevant research.
We have highlighted key exemplar nations and those whose progress could be improved, but there are clearly more general lessons that can be learned from the epidemiological transition across all causes and locations. The collection of London Declaration NTDs, along with malaria [28] and HIV, all show how effective domestic and international collaborations in fighting of specific infectious diseases can be. Whether or not these collaborations provide evidence of health-care improvements in one area, whether or not the benefits cascade, and whether or not non-health-specific interventions, such as poverty alleviation, education, [29] and family planning, are having synergistic effects are hard to differentiate, [28, 30] but a host of online tools exist that enable national experts to examine performance of and changes in the leading causes of disease burden, compare them with peers, and objectively assess what can be improved.
Since the concept of the DALY was introduced two decades ago, [31] it has become a key metric for monitoring of population health and prioritisation within health sectors. [32ľ39] The following are examples of policy makers, funders, or foundations that use DALYs in decision making: WHO, the World Bank, the National Institutes of Health, the US Centers for Disease Control and Prevention, the Bill & Melinda Gates Foundation, Gavi, the US President's Emergency Plan for AIDS Relief, the Global Fund, and the Wellcome Trust, as well as the Chinese Politburo, the National Institute for Health and Care Excellence, Indonesia Bappenas, and Public Health England at the national level.
Comparison of GBD 2016 with other global estimates and GBD 2015
The GBD study is the only source of comprehensive quantification of population health summary measures, including YLLs, YLDs, DALYs, and HALE. Specific efforts that are relevant to policy makers are being made to estimate burden within other organisations. Since GBD 2015, most organisations that we assessed have not produced updated estimates for DALYs or HALE. The exception to this is WHO, which has released updated Global Health Estimates for DALYs and HALE for 183 countries from 2000 to 2015. [40] These estimates draw heavily on the GBD 2015 results, with revisions to the all-cause mortality envelope [40, 41] as detailed in the GBD 2016 cause-specific mortality publication10 and to selected cause-specific disability weights and severity distributions for YLDs. [42] WHO-adjusted disability weights for various causes are further detailed in the WHO Global Health Estimates Technical Paper. [41]
Disease-specific considerations
The SDI transition was prominent for many CMNN conditions, especially diarrhoea, lower respiratory infection, HIV after 2005 (the year of the global peak), maternal disorders, and vaccine-preventable diseases like measles, tetanus, diphtheria, and pertussis. Focused programmes with community-wide targeting of health interventionsŚsuch as access to antenatal care, [43, 44] vaccination, malaria vector control (insecticide-treated bednets and indoor residual spraying), [45] and artemisinin combination therapies, [46] water and sanitation efforts, [47] and ART and prevention of mother-to-child transmission of HIV [30, 48, 49] Ś are potentially responsible for DALY reductions in these conditions. [50] Further scale-up and maintenance of these interventions should continue, including a transition from non-governmental organisations to local ownership and financing. Corresponding improvements in health system functions related to survival of mothers and their children have not occurred, [51] shown by the comparatively slow improvement in DALYs due to maternal and neonatal disorders compared with other CMNN causes and the growing burden of congenital birth defects, haemoglobinopathies and haemolytic anaemias, and sudden infant death syndrome, especially in the under-5 age group. Early detection of complications of pregnancy like micronutrient deficiencies, hypertensive disorders of pregnancy, pregnancy-transmitted and sexually transmitted infections, and congenital birth defects can help identify the pregnant women and newborns at highest risk, help ensure that appropriate curative treatments are administered, and put the females and newborns in a position to receive timely perinatal care when it is needed. Newborn screening for congenital birth defects and haemoglobinopathies can, at the very least, identify children with these conditions and facilitate maternal education about the importance of presentation for care early when a mother's child gets sick. Delays in seeking care can have deadly consequences, particularly for children with acute conditions. Education of mothers and fathers, especially first-time parents, about how to best care for their babies can help reduce avoidable injuries and deaths. At the same time, stark increases in neonatal sepsis DALYs, in which nosocomial infections of the newborn are included, highlight the crucial importance of being vigilant in infection control within hospitals and clinics.
This iteration of GBD estimated diseases and injuries for 5 year age groups older than 80 years for the first time: 80ľ84 years, 85ľ89 years, 90ľ94 years, and 95 years and older. This addition has provided a clearer picture than from previous GBD publications of the burden of disease in ageing populations, who are disproportionately affected by dementias and other NCDs compared with younger age groups. Ageing populations have increased substantially in size since 1990. As a result of this population shift and the epidemiological transition (which increases the proportion of burden of disease due to NCDs), age groups older than 80 years had increases in all-age DALYs between 1990 and 2016, with increases across all SDI quintiles. The proportion due to NCDs also increased. Therefore, research into these age groups and the diseases that continue to affect them over time should be prioritised.
Tuberculosis
We made important changes to the modelling strategy for tuberculosis in GBD 2016. For fatal tuberculosis, we first modelled the prevalence of active disease and latent infection, which we then used as covariates for the Cause of Death Ensemble model. For non-fatal tuberculosis, we strengthened our statistical triangulation approach, which enforces consistency between data for different parameters by modelling tuberculosis incidence, prevalence, and mortality among those with latent infection. Application of MIRs estimated on the basis of SDI to better reflect incidence in low-income and middle-income countries has also enhanced consistency between fatal and non-fatal estimates of tuberculosis. All of these changes have resulted in global tuberculosis DALYs that are 15% higher than in GBD 2015 for the year 2010, with prominent increases occurring in several African countries, including Uganda, the Central African Republic, and Zambia.
HIV/AIDS
A major HIV methods change for GBD 2016 was the distribution of ART coverage by age, sex, and CD4-positive cell count. We used two AIDS Indicator Surveys [52, 53] to predict the age-sex-CD4 cell distribution of ART coverage and applied the distributions to the input counts of people receiving ART in our HIV estimation model. This method shifted the coverage distribution to groups with higher CD4 cell counts, as was seen in the data. All of these changes have resulted in higher global HIV/AIDS DALYs than in GBD 2015 for the year 2010, with the most prominent increases occurring in several African countries, including South Africa, Botswana, Lesotho, and Swaziland. We have also systematically updated other key input parameters to the HIV/AIDS estimation process, such as the on-ART mortality rate and other demographic inputs, including HIV-free mortality.
Lower respiratory infection and diarrhoea
Total lower respiratory infection (increased by 0Ě701%) and diarrhoeal disease (increased by 15Ě5%) DALYs increased compared with GBD 2015 estimates for the year 2010. Like most CMNN causes, the lower respiratory infection and diarrhoeal disease DALY burden is due primarily to YLLs; more than 90% of global DALYs are from these causes. Several changes have been made to the under-5 mortality models that have large impacts on the DALY totals for these causes. We added several new model covariates on the basis of risk factors associated with lower respiratory infections and diarrhoeal diseases, including childhood stunting and suboptimal breastfeeding. Additionally, because of India's large population size and disease burden, its Sample Registration System data changed the magnitude of YLLs. Inclusion of diarrhoeal diseases as a fatal discontinuity in YLL estimation also affected the overall estimation for GBD 2016. Overall, the YLLs due to lower respiratory infections decreased slightly (by 0Ě626%) for the year 2010 from GBD 2015 to GBD 2016 and those due to diarrhoeal diseases increased (by 14Ě3%). We believe that these modelling changes improved under-5 mortality estimates for lower respiratory infections and diarrhoea. Although responsible for a smaller contribution to DALYs than cause of death models, the non-fatal models of lower respiratory infections and diarrhoea included new data sources and processing. An example is that we now account for seasonality from the population-representative surveys that provide most prevalence data from sub-Saharan Africa and south Asia in the lower respiratory infection and diarrhoeal disease models. Another major update is a change in the estimated mean duration of illness on the basis of a set of updated systematic reviews. The duration of diarrhoea remained nearly the same as in GBD 2015, but that of lower respiratory infection decreased by about 20% compared with GBD 2015.
Malaria
Refinements to the methodological approach and addition of substantially more data than in GBD 2015 have led to changes in estimates of both malaria mortality and morbidity estimates in the GBD 2016 iteration, with resulting changes in DALYs. Globally, predicted trends in malaria were similar to GBD 2015, rising to a peak in 2005 before steadily declining. Overall malaria DALYs are lower in GBD 2016 than in GBD 2015, reflecting mainly lower estimates outside of Africa and particularly for India. Outside of Africa, and for lower-burden countries within Africa, estimates were informed for the first time by extensive subnational case-reporting data from routine surveillance systems. These were subsequently adjusted to account for under-reporting, misdiagnosis, and incompleteness, and then entered into a spatiotemporal geostatistical model to infer continuous surfaces of incidence rate before reaggregating them to national and subnational totals. This approach led to notable reductions in estimated cases, YLDs, and DALYs in India, Myanmar, Indonesia, and Pakistan. In high-burden countries in sub-Saharan Africa, where the methods remained similar to GBD 2015, changes were relatively modest and reflected the inclusion of newly available cross-sectional parasite rate surveys or updates to data for malaria intervention coverage in recent years.
London Declaration diseases
The London Declaration was established in 2012 as a partnership of pharmaceutical companies, private foundations, and global health organisations, committed to providing resources and expertise for controlling, eliminating, or eradicating ten NTDs: human African trypanosomiasis, Chagas disease, Guinea worm disease, leprosy, lymphatic filariasis, onchocerciasis, schistosomiasis, soil-transmitted helminths, blinding trachoma, and visceral leishmaniasis. [54] With this year's addition of Guinea worm disease to the GBD cause list, we now estimate DALYs for all ten of the London Declaration diseases and GBD estimates can, therefore, offer insight into progress. We estimate that total DALYs from the London Declaration NTDs have declined by 21Ě1% from 11Ě4 million (95% UI 6Ě8 million to 18Ě5 million) DALYs in 2010 before the London Declaration in 2012 to 9Ě0 million (5Ě3 million to 14Ě5 million) in 2016. Moreover, we find that DALY rates have declined for all ten of the London Declaration NTDs between 1990 and 2016, with the largest declines occurring for Guinea worm disease, reflecting the particular effectiveness of the Guinea worm eradication initiative, [55] and for human African trypanosomiasis. [56]
Zika virus disease
The appearance of Zika virus cases in the Americas in 2015, along with the reported associations between Zika virus infection and microcephaly and Guillain-BarrÚ syndrome, led WHO to declare Zika virus a Public Health Emergency of International Concern in February 2016. [57ľ59] We estimated Zika virus disease for GBD 2016 in response to this heightened global concern and interest. We estimated four non-fatal outcomes of Zika virus infection: asymptomatic infection, symptomatic infection, Guillain-BarrÚ syndrome caused by Zika virus infection, and congenital Zika syndrome. Despite the high incidence observed in the Americas in 2016 and understandable public concern, especially surrounding congenital Zika syndrome, we estimate that less than 0Ě01% of Zika virus infections result in Guillain-BarrÚ syndrome, congenital Zika syndrome, or death. We estimate that 7Ě60 million (95% UI 5Ě70 million to 10Ě7 million) infections occurred in 2016, resulting in 2Ě70 million symptomatic Zika virus cases, 1880 cases of Zika-attributable Guillain-BarrÚ syndrome, and 2400 congenital Zika syndrome births. [8] Our estimate for congenital Zika syndrome is in line with official reports from the Pan American Health Organization of circa 2500 congenital Zika syndrome births. [60] However, those born with congenital Zika syndrome will have future disability.
Injuries
Global DALYs due to injuries generally contributed to a lower proportion of total burden than did those due to CMNN diseases and NCDs, and remained relatively stable as a proportion of total DALYs over time. Examination of these trends by SDI quintile, region, and cause of injury reveals much more variable patterns than the global pattern, which are potentially related to a confluence of demographic changes, policy adoption and enforcement, access to high-quality trauma care, and political stability. Among high-SDI and high-middle-SDI countries, all-age DALYs due to road injuries have substantially declined since 1990, while DALYs due to road injuries in low-middle-SDI and low-SDI countries have risen, a trend that is particularly evident in recent years. By contrast, DALYs from drowning markedly declined among middle-SDI and low-middle-SDI countries. Disease burden from falls rose across the development spectrum, a trend primarily driven by population growth and ageing. Finally, the consequences of ongoing conflict, particularly in north Africa and the Middle East, and interpersonal violence, particularly in Latin America, on population health cannot be overlooked. [61] Fatalities due to such conflict and violence have resulted in stagnated or decreasing life expectancy in many of these countries, [7, 62] and for those who survive, the long-term effects of such injuries could easily result in impaired movement and functioning, heightened risk of other disorders (eg, musculoskeletal conditions), and mental health challenges for an extended period after the end of the conflict.
Cerebrovascular disease
For GBD 2016, we modelled each stroke subtype independently to produce more reliable ratios of ischaemic to haemorrhagic stroke than for GBD 2015 and better match our independent estimation of subtype-specific stroke mortality. We avoided undercounting of stroke by reclassifying hospital admissions and deaths ascribed to unspecified stroke. Despite this method, haemorrhagic stroke remains a heterogeneous category that includes neonatal intraventricular haemorrhage and all other non-traumatic intracranial bleeding. These deaths in children younger than 5 years result in many more YLLs, and therefore many more DALYs, than from ischaemic stroke. Consistent with population-based and multinational studies of stroke subtype, GBD estimates higher incidence but much lower case fatality and YLLs due to ischaemic stroke among adults than due to haemorrhagic stroke. [63] This pattern appears true even for locations where this pattern was not previously thought to be the case, such as in China. [64] Future estimates can be improved by production of separate estimates of non-traumatic subarachnoid haemorrhage and paediatric stroke.
Mental and substance use disorders
Throughout multiple iterations of GBD, mental and substance use disorders have consistently been shown as the leading causes of YLDs worldwide, with burden present in both sexes across the lifespan. They are also strongly associated with premature mortality, although this association is not reflected in GBD YLL estimates for mental disorders as they are rarely coded as the direct cause of death. Nevertheless, they contribute a substantial number of DALYs and this large contribution to burden has remained constant across time in all countries, including those with high or substantially improving SDI. Treatment rates remain very low [65ľ67] and, even in high-income countries where treatment coverage has increased, the prevalence of the most common disorders has not changed. [68] To reduce the burden of these disorders, improved treatment coverage needs to include a focus on the quality of the intervention delivered. Additionally, identification and quantification of modifiable risk factors for mental and substance use disorders are vital for development of effective prevention strategies and are an area noted for expansion
Diabetes
We made several important improvements to the process of estimation of diabetes prevalence, including use of more data sources than GBD 2015 and development of a novel approach to standardise the definition of diabetes across different sources. In our assessment of diagnostic criteria for diabetes across different surveys, we identified more than 50 different definitions for diabetes based on various biomarkers (eg, fasting plasma glucose concentration, oral glucose tolerance test result, and glycated haemoglobin A1c concentration) and different levels of each biomarker. To standardise the definition of diabetes, we mostly focused on the surveys that had included fasting plasma glucose concentration as a diagnostic criterion and developed an ensemble model to characterise the distribution of fasting plasma glucose concentration at the population level in each age and sex group. Then, we used the fasting plasma glucose concentration distribution to convert various definitions of diabetes into the standard case definition. Using the ensemble model, we also estimated the prevalence of diabetes on the basis of the mean fasting plasma glucose concentration in places for which we only had data for mean fasting plasma glucose concentration. These changes allowed us to be more consistent than in GBD 2015 in our estimation of the prevalence of diabetes across countries and over time. As a result, our estimates of the prevalence of diabetes globally and in most regions are slightly lower than those reported in GBD 2015. The strong relationship between SDI and diabetes remained, mirroring global rises in overweight and obesity. [69]
Cancer
DALYs for cancer have changed compared with GBD 2015; this change is predominantly due to lower YLD estimates for GBD 2016 than for GBD 2015. These improvements stem from adjustments made in the modelling of MIRs to better reflect differences in MIR based on SDI in data-sparse locations than in GBD 2015. In addition to stricter inclusion criteria for data used in the MIR modelling than in GBD 2015, we changed the modelling approach and used the most parsimonious model with just SDI as a predictor of MIR. [8] MIRs are used to estimate cancer incidence and prevalence from GBD cancer mortality estimates and therefore directly determine YLDs. Until cancer registry incidence data and accurate mortality statistics are widely available, validation of MIR is difficult in countries that lack these data sources. The Global Initiative for Cancer Registry Development and expansion of civil registration systems are therefore crucial to further improve estimation of cancer burden.
Future directions
Challenging data gaps exist in the severity distributions across sequelae for most diseases in the YLD literature. Most data sources for severity are from high-income countries, which probably leads to an underestimation of YLDs in low-income and middle-income countries where the severity of presentation of non-fatal illnesses might be worse than in high-income countries, frequently as a result of late diagnosis and underdiagnosis. Improvements can be made if disease-specific research focuses on routine use of a single established measure of severity in surveys and patient populations and if countries are able to link survey data to a general health assessment instrument, along with improvements in early diagnosis and treatment procedures before illnesses progress to high-severity presentations. Although uncertainty and sample variance will persist at various levels, gaining of greater geographical information on severity of diseases than at present will increase the accuracy of GBD models.
Potential is clearly huge for exploration of this work in relation to development assistance for health, [70, 71] as the connection between health financing and outcomes needs better understanding than at present. Improved understanding will probably help identify the reasons why certain countries have such an impressive record, whereas others are so ineffective with the resources that they have available, at all levels of SDI. More precise measurement of health burden than at present, across countries and at the subnational level, could be tied to health services financing and delivery to identify systematic associations and causal relationships. Additionally, risk factor data, health outcome data, health financing data, and other socioeconomic indicators can be combined to measure and assess health system performance. Furthermore, a core focus moving forward with GBD is to progressively increase the spatial resolution at which we implement estimations to help realise aspirations in precision public health. [72] A key goal of a geographically refined DALY, at 5Î5 km spatial resolutionŚstarting with some key CMNN causes and under-5 mortalityŚis part of a long-term aspiration. [73]
Finally, upcoming GBD work will focus on exploration of future health scenarios, examining the likely burden of disease under different possible trajectories of independent drivers of health. This framework will capture the complex past trends and interdependent relationships in socioeconomic development, risk factors, interventions, morbidity, mortality, and population to both estimate the likely future burden of disease and enable comparison between scenarios based on different sets of assumptions. For instance, it can be used to analyse the likely effect of the introduction and scale-up of a new type of vaccination or different trends in funding for ART for HIV/AIDS. Extension of this work through to DALY and HALE analyses is also part of these future plans.
To look at cause-deleted HALE would also be valuable so that we could understand the remaining DALY burden in the absence of diseases and injuries that might be highly amenable to preventive or curative measures. Compelling examples would include HIV, vaccine-preventable and malnutrition-related diseases, a subset of NCDs that are particularly amenable to health-care or preventive measures (eg, tobacco-related or alcohol-related or some congenital birth defects), and injuries (eg, firearms or transport injuries). This approach would not be fully counterfactual, but would be a first and more rigorous way of showing what conditions contributed to the changes in HALE from 1990 (or 2006) to 2016 than was possible in this study.
Limitations
Despite our continued methodological advancements and data enrichments, this study has limitations. First, all limitations documented in the elements of the GBD estimation process that allow for DALY and HALE estimation [2ľ4, 12] will contribute to uncertainty in these summary measures. Second, these summary measures will also be influenced by data availability. Time lags in the reporting of health information by national authorities and thus their subsequent incorporation into the GBD estimation mean that some of the most recent changes in health states will not be captured. Relatedly, data deficiencies from populations in conflict zones (eg, Syria, Iraq, Yemen, South Sudan, and Afghanistan), autonomous subnational regions, and certain non-geographically based subpopulations (ie, migrants, refugees, and some indigenous people) limit the precision of some of our estimated levels and trends of disease burden. [74] Third, the relationship between DALYs, HALE, and SDI, although explanatory, cannot be viewed as causal. Fourth, a non-trivial assumption of the analyses is the independence of the uncertainty calculated for YLLs and YLDs. Because of the link between death and prevalence, a positive correlation probably exists between these uncertainties that we do not capture. As such, we probably underestimate the aggregated uncertainty for DALYs, although the primary source of uncertainty for DALYs comes from uncertainty in disability weights, which are unaffected by this limitation. In future iterations of GBD, this potential correlation will be explored using copula, a statistical method that models the dependence structure among multiple independent marginal probability distributions to estimate correlation between them. [75]
Conclusion
Many improvements have been made to GBD 2016 to allow for a clearer and more nuanced picture of the changing picture of global health than in GBD 2015. Among these improvements are inclusion of new studies and subnational data (notably in India) and many substantial improvements to modelling and analyses. Prominent results of these changes include higher global DALY estimates for tuberculosis, HIV/AIDS, lower respiratory infection, and diarrhoeal disease than in GBD 2015. We have for the first time discussed our DALY exemplars, countries with the lowest ratio of observed to expected DALYs, as well as our poor performers, those with the largest ratio of observed to expected DALYs. These exemplars and poor performers suggest a need to learn lessons from those with clear health gains and implement system-based strategies for those struggling. This analysis and increasingly more detailed results will allow for more informed public policy and health financing decisions as the world faces an absolute expansion of morbidity.
Globally, individuals could expect to live substantially longer lives in 2016 than they could in 1990. This improvement was due to a rapid decline in YLLs and more modest age-standardised declines in YLDs, leading to lower age-standardised DALY rates across the entire socioeconomic development spectrum in 2016 than in 1990, with a decrease of approximately a third for all causes. At the same time, populations can expect to spend more time with functional health loss due to absolute morbidity expansion than previously. Such improvements have been accompanied by rapid population growth and ageing and, against the backdrop of the epidemiological transition, have resulted in the paradox of a total expansion in DALY burden and thus an ever-increasing demand on health systems, domestic health financing, development assistance for health, and associated global health organisations. This increasing demand on health systems is ubiquitous across time, location, GBD region, and SDI, posing a huge opportunity for health-care innovators in prevention and treatment for morbidity reduction. Our analysis of exemplars and poor performers is also indicative of various practices that can hasten or slow the epidemiological transition and warrant deep investigation.
Supplementary Material
Acknowledgments
Research reported in this publication was supported by the Bill & Melinda Gates Foundation, the National Institute on Aging of the National Institutes of Health (award P30AG047845), and the National Institute of Mental Health of the National Institutes of Health (award R01MH110163). The content is solely the responsibility of the authors and does not necessarily represent the official views of the Bill & Melinda Gates Foundation or the National Institutes of Health. The Palestinian Central Bureau of Statistics granted the researchers access to relevant data in accordance with licence number SLN2014-3-170, after subjecting data to processing aiming to preserve the confidentiality of individual data in accordance with the General Statistics Law - 2000. The researchers are solely responsible for the conclusions and inferences drawn upon available data. We thank the Russia Longitudinal Monitoring Survey, RLMS-HSE, conducted by the National Research University Higher School of Economics and ZAO ôDemoscopeö together with the Carolina Population Center, University of North Carolina at Chapel Hill, and the Institute of Sociology RAS for making these data available. This study has been realised using the data collected by the Swiss Household Panel (SHP), which is based at the Swiss Centre of Expertise in the Social Sciences FORS. The project is financed by the Swiss National Science Foundation from the Framingham Heart Study of the National Heart Lung and Blood Institute of the National Institutes of Health and Boston University School of Medicine. This work was supported by the National Heart, Lung and Blood Institute's Framingham Heart Study (contract number N01-HC-25195). The Health and Retirement Study (HRS) is sponsored by the National Institute on Aging (grant number NIA U01AG009740) and is conducted by the University of Michigan. This research used data from the National Health Survey 2003. We are grateful to the Ministry of Health, Survey copyright owner, allowing him to have the database. All results of the study are those of the authors and in no way committed to the Ministry. This research used data from the National Health Survey 2009ľ10. All results of the study are those of the authors and in no way committed to the Ministry. This research uses data from Add Health, a programme project designed by J Richard Udry, Peter S Bearman, and Kathleen Mullan Harris, and funded by a grant P01-HD31921 from the Eunice Kennedy Shriver National Institute of Child Health and Human Development, with cooperative funding from 17 other agencies. Special acknowledgment is due to Ronald R Rindfuss and Barbara Entwisle for assistance in the original design. People interested in obtaining data files from Add Health should contact Add Health, Carolina Population Center, 123 West Franklin Street, Chapel Hill, NC 27516-2524, USA (addhealth@unc.edu). No direct support was received from grant P01-HD31921 for this analysis. The data reported here have been supplied by the US Renal Data System (USRDS). The interpretation and reporting of these data are the responsibility of the author(s) and in no way should be seen as an official policy or interpretation of the US Government. HBSC is an international study carried out in collaboration with WHO/EURO. The International Coordinator of the 1997ľ98, 2001ľ02, 2005ľ06 and 2009ľ10 surveys was Candace Currie and the Data Bank Manager for the 1997ľ98 survey was Bente Wold, whereas for the following survey, Oddrun Samdal was the Databank Manager. A list of principal investigators in each country can be found at http://www.hbsc.org. Data used in the preparation of this article were obtained from the Pooled Resource Open-Access ALS Clinical Trials (PRO-ACT) Database. In 2011, Prize4Life, in collaboration with the Northeast ALS Consortium, and with funding from the ALS Therapy Alliance, formed the Pooled Resource Open-Access ALS Clinical Trials (PRO-ACT) Consortium. The data available in the PRO-ACT Database has been volunteered by PRO-ACT Consortium members. This paper uses data from SHARE Waves 1, 2, 3 (SHARELIFE), 4, 5, and 6 (DOIs: 10.6103/SHARE.w1.600, 10.6103/SHARE.w2.600, 10.6103/SHARE.w3.600, 10.6103/SHARE.w4.600, 10.6103/SHARE.w5.600, 10.6103/SHARE.w6.600); see B÷rsch-Supan and colleagues (2013) for methodological details. The SHARE data collection has been primarily funded by the European Commission through FP5 (QLK6-CT-2001-00360), FP6 (SHARE-I3: RII-CT-2006-062193, COMPARE: CIT5-CT-2005-028857, SHARELIFE: CIT4-CT-2006-028812), and FP7 (SHARE-PREP: 211909, SHARE-LEAP: 227822, SHARE M4: 261982). Additional funding from the German Ministry of Education and Research, the Max Planck Society for the Advancement of Science, the US National Institute on Aging (U01_AG09740-13S2, P01_AG005842, P01_AG08291, P30_AG12815, R21_AG025169, Y1-AG-4553-01, IAG_BSR06-11, OGHA_04-064, HHSN271201300071C), and various national funding sources is gratefully acknowledged (see www.share-project.org). This manuscript is based on data collected and shared by the International Vaccine Institute (IVI). This manuscript was not prepared in collaboration with investigators of IVI and does not necessarily reflect the opinions or views of IVI. Collection of these data was made possible by the US Agency for International Development (USAID) under the terms of cooperative agreement GPO-A-00-08-000_D3-00. The opinions expressed are those of the authors and do not necessarily reflect the views of USAID or the US Government. Data for this research was provided by MEASURE Evaluation, funded by the US Agency for International Development (USAID). Views expressed do not necessarily reflect those of USAID, the US Government, or MEASURE Evaluation.
Declaration of interests
Laith J Abu-Raddad acknowledges the support of the Qatar National Research Fund (NPRP 9-040-3-008) who provided the main funding for generating the data provided to the GBD-IHME effort. Anurag Arawal acknowledges support from the Wellcome Trust DBT India Alliance Senior Fellowship; and reports personal fees from AstraZeneca. Ashish Awasthi received funding from DST, Government of India through INSPIRE Faculty scheme. The scientific work of Aleksandra Barac is part of the Project No III45005 granted by Ministry of Education, Science and Technological Development of the Republic of Serbia. Till Bńrnighausen was supported by the Alexander von Humboldt Foundation through the Alexander von Humboldt Professor award, funded by the Federal Ministry of Education and Research; the Wellcome Trust; the European Commission; the Clinton Health Access Initiative; and from NICHD of NIH (R01-HD084233), NIA of NIH (P01-AG041710), NIAID of NIH (R01-AI124389 and R01-AI112339) as well as FIC of NIH (D43-TW009775); this research was supported by NIH National Center for Advancing Translational Science (NCATS) UCLA CTSI Grant Number UL1TR001881. Yannick BÚjot reports grants and personal fees from AstraZeneca, personal fees from Daiichi-Sankyo, personal fees from Pfizer-BMS, personal fees from MSD, personal fees from Bayer, personal fees from Covidiem, and grants and personal fees from Boehringer-Ingelheim. Boris Bikbov has received funding from the European Union's Horizon 2020 research and innovation programme under Marie Sklodowska-Curie grant agreement No 703226; and acknowledges that work related to this paper has been done on the behalf of the GBD Genitourinary Disease Expert Group supported by the International Society of Nephrology (ISN). Rupert Bourne acknowledges support from the Brien Holden Vision Institute. Rachelle Buchbinder is funded by an Australian National Health and Medical Research Council (NHMRC) Senior Principal Research Fellowship. Lucero Cahuana-Hurtado acknowledges support from the Instituto Nacional de Salud P˙blica (INSP) in Mexico. Juan-Jesus Carrero acknowledges support from Stockholm County Council Swedish Heart and Lung Foundation. Cyrus Cooper reports personal fees from Alliance for Better Bone Health, Amgen, Eli Lilly, GSK, Medtronic, Merck, Novartis, Pfizer, Servier, Takeda, and UCB. JosÚ das Neves was supported in his contribution to this work by a Fellowship from FundašŃo para a Ciŕncia e a Tecnologia, Portugal (SFRH/BPD/92934/2013.; Barbora de Courten is supported by National Heart Foundation Future Leader Fellowship (100864). Louisa Degenhardt is supported by an Australian National Health and Medical Research Council (NHMRC) Principal Research Fellowship; the National Drug and Alcohol Research Centre at the University of NSW is supported by funding from the Australian Government under the Substance Misuse Prevention and Service Improvements Grants Fund. Kebede Deribe is funded by a Wellcome Trust Intermediate Fellowship in Public Health and Tropical Medicine (grant number 201900); Mir Sohail Fazeli reports personal fees from Doctor Evidence LLC. JoŃo Fernandes gratefully acknowledges funding from FCTŚFundašŃo para a Ciŕncia e a Tecnologia (grant number UID/Multi/50016/2013). Katherine B Gibney is supported by an NHMRC Early Career Fellowship. Shifalika Goenka is supported by the Bernard Lown Scholars in Cardiovascular Health Program, Harvard School of Public Health (2015ľ17) and a Wellcome Trust (Grant No 096735/B/11/Z). Amador Goodridge acknowledges support from Sistema Nacional de Investigaciˇn (SNI) de Panamß and SecretarÝa Nacional de Ciencia, TecnologÝa e Innovaciˇn (SENACYT). Simon I Hay is funded by grants from the Bill & Melinda Gates Foundation (OPP1106023, OPP1119467, OPP1093011, and OPP1132415). Shariful Islam received postdoctoral research fellowship from The George Institute for Global Health and career transition grants from High Blood Pressure Research Foundation of Australia; the Ministry of Education Science and Technological Development of the Republic of Serbia has co-financed Serbian parts of this GBD related contribution throughout the Grant OI 175 014; publication of results was not contingent upon Minsitry's prior censorship or approval. Peter James is supported by R00 CA201542 from NCI. Panniyammakal Jeemon acknowledges support from the Clinical and public health intermediate fellowship from the Wellcome Trust and Department of Biotechnology, India Alliance (2015-2020). Srinivasa Vittal Katikireddi reports grants from Chief Scientist Office and grants from Medical Research Council, during the conduct of the study. Anil Kaul has received funding (HR14-065) from the Oklahoma Council for Advancement of Science & Technology (OCAST). Christian Kieling has received support from Brazilian governmental research funding agencies Conselho Nacional de Desenvolvimento CientÝfico e Tecnolˇgico (CNPq), CoordenašŃo de Aperfeišoamento de Pessoal de NÝvel Superior (CAPES), FundašŃo de Amparo Ó Pesquisa do Estado do Rio Grande do Sul (Fapergs), and Hospital de ClÝnicas de Porto Alegre (FIPE/HCPA). Ai Koyanagi's work was supported by the Miguel Servet contract financed by the CP13/00150 and PI15/00862 projects, integrated into the National R + D + I and funded by the ISCIIIŚGeneral Branch Evaluation and Promotion of Health ResearchŚand the European Regional Development Fund (ERDF-FEDER). Tea Lallukka is supported by the Academy of Finland (Grants #287488 and #294096). Cheru T Leshargie would like to thank Debremarkos University for the arrangement of internate service to communicate for tasks such as registering and communicating with GBD organiser and to download the manuscript and other supportive document, send on comments, and sending the co-author form for the GBD. Miriam Levi acknowledges institutional support received from CeRIMP, Regional Centre for Occupational Diseases and Injuries, Local Health Unit Tuscany Center, Florence, Italy. Katharine J Looker thanks the National Institute for Health Research Health Protection Research Unit (NIHR HPRU) in Evaluation of Interventions at the University of Bristol, in partnership with Public Health England (PHE), for research support; and received separate funding from the World Health Organization and Sexual Health 24 during the course of this study; the views expressed are those of the authors and not necessarily those of the National Health Service, the NIHR, the Department of Health or Public Health England. Azeem Majeed and Imperial College London are grateful for support from the NW London NIHR Collaboration for Leadership in Applied Health Research & Care. Francisco Martins-Melo acknowledges support from the postdoctoral Fellowship, CoordenašŃo de Aperfeišoamento de Pessoal de NÝvel Superior (CAPES; Brazilian public agency). Winifred Mńrz reports grants and personal fees from Siemens Diagnostics, grants and personal fees from Aegerion Pharmaceuticals, grants and personal fees from AMGEN, grants and personal fees from AstraZeneca, grants and personal fees from Danone Research, personal fees from Hoffmann LaRoche, personal fees from MSD, grants and personal fees from Pfizer, personal fees from Sanofi, personal fees from Synageva, grants and personal fees from BASF, grants from Abbott Diagnostics, grants and personal fees from Numares AG, grants and personal fees from Berlin-Chemie, and other support from Synlab Holding Deutschland GmbH. Mohsen Mazidi was supported by The World Academy of Sciences studentship of the Chinese Academy of Sciences. John McGrath received John Cade Fellowship APP1056929 from the National Health and Medical Research Council, and Niels Bohr Professorship from the Danish National Research Foundation. Toni Meier would like to acknowledge institutional support from the ôCompetence Cluster of Nutrition and Cardiovascular Health (nutriCARD)ŚJena-Halle-Leipzig. Philip Mitchell's research is supported by an Australian NHMRC Program Grant number 1037196. Ulrich Mueller has received financial support from the German National Cohort Study (grant 01ER1511D). Charles Newton is supported by the Wellcome Trust, UK. Olanrewaju Oladimeji is a Senior Research Specialist at the Human Sciences Research Council (HSRC), South Africa and Doctoral Candidate at the University of KwaZulu-Natal (UKZN), South Africa; we acknowledge the institutional support by leveraging on the existing organizational research facilities at HSRC and UKZN. AO was supported by intensificacion ISCIII FEDER funds and RETIC REDINREN. Richard Osborne was funded in part through an Australian National Health and Medical Research Council (NHMRC) Senior Research Fellowship #APP1059122. MO is supported by U54HG007479 from the NIH, USA. Charles Parry would like to acknowledge support from the South African Medical Research Council. Norberto Perico acknowledges that work related to this paper has been done on behalf of the GBD Genitourinary Disease Expert Group supported by the International Society of Nephrology (ISN). Konrad Pesudovs is support by Flinders University. William Petri is support by NIH grant AI043596; Kazem Rahimi is funded by an NIHR Career Development Fellowship and is supported by the National Institute for Health Research (NIHR) Biomedical Research Centre (BRC) and the Oxford Martin School. Giuseppe Remuzzi acknowledges that the work related to this paper has been done on behalf of GBD Genitourinary Disease Expert Group supported by the International Society of Nephrology (ISN). Maria Dolores Sanchez-Ni˝o is supported by FIS PI15/00298 (ISCIII, Spanish Government). Aletta E Schutte received support from the South African Medical Research Council and National Research Foundation (DST/NRF SARChI Programme). Jeffrey Stanaway reports grants from Merck. Cassandra E I Szoeke reports grants from National Medical Health Research Council, during the conduct of the study; grants from Lundbeck, grants from Alzheimer's Association, outside the submitted work; and has a patent PCT/AU2008/001556 issued; Rafael TabarÚs-Seisdedos was supported in part by grant PROMETEOII/2015/021 from Generalitat Valenciana and the national grands PI14/00894 and PIE14/00031 from ISCIII-FEDER. Amanda G Thrift was provided fellowship support from the National Health & Medical Resarch Council (NHMRC; 1042600). Stefano Tyrovola's work was supported by the Foundation for Education and European Culture (IPEP), the Sara Borrell postdoctoral programme (reference no CD15/00019 from the Instituto de Salud Carlos III (ISCIII - Spain) and the Fondos Europeo de Desarrollo Regional (FEDER). Job F M van Boven's work was supported by the University Medical Center Groningen, University of Groningen, The Netherlands. Ronny Westerman would like to acknowledge that this work is on behalf of the German National Cohort funded by the German Ministry of Education and Research. Lijing L Yan is partly supported by the National Natural Sciences Foundation of China grants (71233001 and 71490732). Marcel Yotebieng is partially supported by the NIAID U01AI096299-01 and the NICHD R01HD087993. All other authors declare no competing interests.
References:
Mathers CD, Sadana R, Salomon JA, Murray CJ, Lopez AD.
Healthy life expectancy in 191 countries, 1999.
Lancet. 2001;357:1685ľ1691Murray CJ, Vos T, Lozano R.
Disability-adjusted life years (DALYs) for 291 diseases and injuries in 21 regions, 1990ľ2010:
a systematic analysis for the Global Burden of Disease Study 2010.
Lancet. 2012;380:2197ľ2223Murray CJ, Barber RM, Foreman KJ.
Global, regional, and national disability-adjusted life years (DALYs) for 306 diseases and injuries
and healthy life expectancy (HALE) for 188 countries, 1990ľ2013: quantifying the epidemiological transition.
Lancet. 2015;386:2145ľ2191Kassebaum NJ, Arora M, Barber RM.
Global, regional, and national disability-adjusted life-years (DALYs) for 315 diseases and injuries
and healthy life expectancy (HALE), 1990ľ2015: a systematic analysis for the Global Burden of Disease Study 2015.
Lancet. 2016;388:1603ľ1658Murray CJ, Salomon JA, Mathers CD, Lopez AD.
Summary measures of population health. Concepts, ethics, measurement and applications.
World Health Organization; Geneva: 2002.Murray CJ.
Quantifying the burden of disease: the technical basis for disability-adjusted life years.
Bull World Health Organ. 1994;72:429ľ445GBD 2016 Mortality Collaborators
Global, regional, and national under-5 mortality, adult mortality, age-specific mortality, and
life expectancy, 1970ľ2016: a systematic analysis for the Global Burden of Disease Study 2016.
Lancet. 2017;390:1084ľ1150GBD 2016 Disease and Injury Incidence and Prevalence Collaborators
Global, regional, and national incidence, prevalence, and years lived with disability for 328 diseases
and injuries for 195 countries, 1990ľ2016: a systematic analysis for the Global Burden of Disease Study 2016.
Lancet. 2017;390:1211ľ1259Sullivan DF.
A single index of mortality and morbidity.
HSMHA Health Rep. 1971;86:347ľ354GBD 2016 Causes of Death Collaborators
Global, regional, and national age-sex specific mortality for 264 causes of death, 1980ľ2016:
a systematic analysis for the Global Burden of Disease Study 2016.
Lancet. 2017;390:1151ľ1210GBD 2016 Risk Factors Collaborators
Global, regional, and national comparative risk assessment of 84 behavioural, environmental and
occupational, and metabolic risks or clusters of risks, 1990ľ2016:
a systematic analysis for the Global Burden of Disease Study 2016.
Lancet. 2017;390:1343ľ1420.Murray CJ, Ezzati M, Flaxman AD.
GBD 2010: design, definitions, and metrics.
Lancet. 2012;380:2063ľ2066Stevens GA, Alkema L, Black RE.
Guidelines for Accurate and Transparent Health Estimates Reporting: the GATHER statement.
Lancet. 2016;388:e19ľe23Stevens GA, Alkema L, Black RE.
Guidelines for Accurate and Transparent Health Estimates Reporting: the GATHER statement.
PLoS Med. 2016;13:e1002056Wang H, Naghavi M, Allen C.
Global, regional, and national life expectancy, all-cause mortality, and cause-specific mortality
for 249 causes of death, 1980ľ2015: a systematic analysis for the Global Burden of Disease Study 2015.
Lancet. 2016;388:1459ľ1544Flaxman AD, Vos T, Murray CJ, editors.
An integrative metaregression framework for descriptive epidemiology. first edn.
University of Washington Press; Seattle: 2015.Stanaway JD, Shepard DS, Undurraga EA.
The global burden of dengue: an analysis from the Global Burden of Disease Study 2013.
Lancet Infect Dis. 2016;16:712ľ723Gething PW, Casey DC, Weiss DJ.
Mapping Plasmodium falciparum mortality in Africa between 1990 and 2015.
N Engl J Med. 2016;375:2435ľ2445Salomon JA, Vos T, Hogan DR.
Common values in assessing health outcomes from disease and injury: disability weights measurement study
for the Global Burden of Disease Study 2010.
Lancet. 2012;380:2129ľ2143Salomon JA, Haagsma JA, Davis A.
Disability weights for the Global Burden of Disease 2013 study.
Lancet Glob Health. 2015;3:e712ľe723Omran AR.
The epidemiologic transition: a theory of the epidemiology of population change.
Milbank Q. 2005;83:731ľ757WHO .
The world health report 2000. Health systems: improving performance.
World Health Organization; Geneva: 2000.Bloom DE, Cafiero ET, JanÚ-Llopis E, Abrahams-Gessel S, Bloom LR.
The global economic burden of noncommunicable diseases.
World Economic Forum; Geneva: 2011.Fries JF.
Aging, natural death, and the compression of morbidity.
N Engl J Med. 1980;303:130ľ135Mundel T.
Honing the priorities and making the investment case for global health.
PLoS Biol. 2016;14:e1002376Institute for Health Metrics and Evaluation .
A hand up: global progress towards universal education.
Institute for Health Metrics and Evaluation; Seattle: 2015.Jamison DT, Summers LH, Alleyne G.
Global health 2035: a world converging within a generation.
Lancet. 2013;382:1898ľ1955Bhatt S, Weiss DJ, Cameron E.
The effect of malaria control on Plasmodium falciparum in Africa between 2000 and 2015.
Nature. 2015;526:207ľ211Gakidou E, Cowling K, Lozano R, Murray CJ.
Increased educational attainment and its effect on child mortality in 175 countries
between 1970 and 2009: a systematic analysis.
Lancet. 2010;376:959ľ974Wang H, Wolock TM, Carter A.
Estimates of global, regional, and national incidence, prevalence, and mortality of HIV,
1980ľ2015: the Global Burden of Disease Study 2015.
Lancet HIV. 2016;3:e361ľe387Murray CJ, Lopez AD, editors.
Global Burden of Disease: a comprehensive assessment of mortality and disability from diseases,
injuries, and risk factors in 1990 and projected to 2020. 1st edn.
Harvard School of Public Health; Cambridge: 1996.Stuckler D, King L, Robinson H, McKee M.
WHO's budgetary allocations and burden of disease: a comparative analysis.
Lancet. 2008;372:1563ľ1569Catalß-Lˇpez F, GarcÝa-AltÚs A, ┴lvarez-MartÝn E, GŔnova-Maleras R, Morant-Ginestar C.
Does the development of new medicinal products in the European Union address global and regional health concerns?
Popul Health Metr. 2010;8:34Chalmers I, Bracken MB, Djulbegovic B.
How to increase value and reduce waste when research priorities are set.
Lancet. 2014;383:156ľ165Emdin CA, Odutayo A, Hsiao AJ.
Association between randomised trial evidence and global burden of disease:
cross sectional study (Epidemiological Study of Randomized TrialsŚESORT)
BMJ. 2015;350:h117Lam J, Lord SJ, Hunter KE, Simes RJ, Vu T, Askie LM.
Australian clinical trial activity and burden of disease: an analysis of registered trials
in National Health Priority Areas.
Med J Australia. 2015;203:97ľ101Mitchell RJ, McClure RJ, Olivier J, Watson WL.
Rational allocation of Australia's research dollars: does the distribution of NHMRC funding
by National Health Priority Area reflect actual disease burden?
Med J Australia. 2009;191:648ľ652Aoun S, Pennebaker D, Pascal R.
To what extent is health and medical research funding associated with the burden of disease in Australia?
Aust N Z J Public Health. 2004;28:80ľ86Lamarre-Cliche M, Castilloux AM, LeLorier J.
Association between the burden of disease and research funding by the Medical Research Council
of Canada and the National Institutes of Health. A cross-sectional study.
Clin Invest Med. 2001;24:83ľ89WHO .
Global Health Estimates 2015: deaths by cause, age, sex, by country and by region, 2000ľ2015.
World Health Organization; Geneva: 2016.
http://www.who.int/healthinfo/global_burden_disease/estimates/en/index1.html
(accessed March 14, 2017).WHO .
WHO methods and data sources for global burden of disease estimates 2000ľ2015.
World Health Organization; Geneva: 2017.WHO WHO Member State DALY estimates, 2000ľ2015.
http://www.who.int/healthinfo/global_burden_disease/estimates/en/
(accessed April 24, 2017).Kuznik A, Lamorde M, Nyabigambo A, Manabe YC.
Antenatal syphilis screening using point-of-care testing in sub-Saharan African countries:
a cost-effectiveness analysis.
PLoS Med10: e1001545.Vogel JP, Habib NA, Souza JP.
Antenatal care packages with reduced visits and perinatal mortality:
a secondary analysis of the WHO Antenatal Care Trial.
Reprod Health. 2013;10:19Bhatt S, Weiss DJ, Cameron E.
The effect of malaria control on Plasmodium falciparum in Africa between 2000 and 2015.
Nature. 2015;526:207ľ211Baird JK.
Effectiveness of antimalarial drugs.
N Engl J Med. 2005;352:1565ľ1577Fewtrell L, Kaufmann RB, Kay D, Enanoria W, Haller L, Colford JM.
Water, sanitation, and hygiene interventions to reduce diarrhoea in less developed countries:
a systematic review and meta-analysis.
Lancet Infect Dis. 2005;5:42ľ52Quinn TC.
HIV epidemiology and the effects of antiviral therapy on long-term consequences.
AIDS. 2008;22:S7ľS12.Stover J, Johnson P, Hallett T, Marston M, Becquet R, Timaeus IM.
The Spectrum projection package: improvements in estimating incidence by age and sex,
mother-to-child transmission, HIV progression in children and double orphans.
Sex Transm Infect. 2010;86:ii16ľii21WHO .
Towards a grand convergence for child survival and health.
A strategic review of options for the future building on lessons learnt from IMNCI.
World Health Organization; Geneva: 2016.GBD 2015 Healthcare Access and Quality Collaborators Healthcare Access and
Quality Index based on mortality from causes amenable to personal health care in 195 countries and territories,
1990ľ2015: a novel analysis from the Global Burden of Disease Study 2015.
Lancet. 2017;390:231ľ266National AIDS and STI Control Programme .
Kenya AIDS Indicator Survey 2012: final report.
National AIDS and STI Control Programme; Nairobi: 2014.Ministry of Health .
Uganda AIDS Indicator Survey 2011.
Ministry of Health; Kampala: 2012.Uniting to Combat Neglected Tropical Diseases
The London Declaration on neglected tropical diseases.
http://unitingtocombatntds.org/resource/london-declaration
(accessed May 8, 2017).Hopkins DR.
Disease eradication.
N Engl J Med. 2013;368:54ľ63Brun R, Blum J, Chappuis F, Burri C.
Human African trypanosomiasis.
Lancet. 2010;375:148ľ159WHO Fifth meeting of the Emergency Committee under the International
Health Regulations (2005) regarding microcephaly, other neurological disorders and Zika virus.
Nov 18, 2016.
http://www.who.int/mediacentre/news/statements/2016/zika-fifth-ec/en/
(accessed May 8, 2017).Bogoch II, Brady OJ, Kraemer MU.
Potential for Zika virus introduction and transmission in resource-limited countries in
Africa and the Asia-Pacific region: a modelling study.
Lancet Infect Dis. 2016;16:1237ľ1245Wikan N, Smith DR.
Zika virus: history of a newly emerging arbovirus.
Lancet Infect Dis. 2016;16:e119ľe126Pan American Health Organization Zika cumulative cases.
http://www.paho.org/hq/index.php?option=com_content&view=article&id=12390:zika-cumulative-cases&
catid=8424:contents&Itemid=42090&lang=en
(accessed May 8, 2017).GBD 2015 Eastern Mediterranean Region Collaborators.
Mokdad AH. Danger ahead: the burden of diseases, injuries, and risk factors in the
eastern Mediterranean region, 1990ľ2015.
Int J Public Health. 2017 DOI:10.1007/s00038-017-1017-y published online Aug 3.Gˇmez-DantÚs H, Fullman N, Lamadrid-Figueroa H.
Dissonant health transition in the states of Mexico, 1990ľ2013: a systematic analysis for the
Global Burden of Disease Study 2013.
Lancet. 2016;388:2386ľ2402O'Donnell MJ, Xavier D, Liu L.
Risk factors for ischaemic and intracerebral haemorrhagic stroke in 22 countries
(the INTERSTROKE study): a case-control study.
Lancet. 2010;376:112ľ123Zhang LF, Yang J, Hong Z.
Proportion of different subtypes of stroke in China.
Stroke. 2003;34:2091ľ2096Andrade LH, Alonso J, Mneimneh Z.
Barriers to mental health treatment: results from the WHO World Mental Health surveys.
Psychol Med. 2014;44:1303ľ1317Degenhardt L, Glantz M, Evans-Lacko S, et al.
Estimating treatment coverage for people with substance use disorders: an analysis of
data from the World Mental Health surveys.
World Psychiatry (in press).Mathers BM, Degenhardt L, Ali H.
HIV prevention, treatment, and care services for people who inject drugs:
a systematic review of global, regional, and national coverage.
Lancet. 2010;375:1014ľ1028Jorm AF, Patten SB, Brugha TS, Mojtabai R.
Has increased provision of treatment reduced the prevalence of common mental disorders?
Review of the evidence from four countries.
World Psychiatry. 2017;16:90ľ99Ng M, Fleming T, Robinson M.
Global, regional, and national prevalence of overweight and obesity in children and adults during
1980ľ2013: a systematic analysis for the Global Burden of Disease Study 2013.
Lancet. 2014;384:766ľ781Global Burden of Disease Health Financing Collaborator Network.
Evolution and patterns of global health financing 1995ľ2014: development assistance for health,
and government, prepaid private, and out-of-pocket health spending in 184 countries.
Lancet389: 1981ľ2004.s.Global Burden of Disease Health Financing Collaborator Network.
Future and potential spending on health 2015ľ40: development assistance for health, and government,
prepaid private, and out-of-pocket health spending in 184 countries.
Lancet389: 2005ľ30.Dowell SF, Blazes D, Desmond-Hellmann S.
Four steps to precision public health.
Nature. 2016;540:189ľ191.Golding N, Burstein R, Longbottom J.
Mapping under-5 and neonatal mortality in Africa, 2000ľ15:
a baseline analysis for the Sustainable Development Goals.
Lancet. 2017 http://dx.doi.org/S0140-6736(17)31758-0 (in press).Roberts L.
Hunger amplifies infectious diseases for millions fleeing the violence of Boko Haram.
April 6, 2017.
http://www.sciencemag.org/news/2017/04/hunger-amplifies-infectious-diseases-millions-
fleeing-violence-boko-haram
(accessed March 24, 2017).Hoff PD.
A first course in Bayesian statistical methods.
Springer; New York: 2009. New York.
Return to GLOBAL BURDEN OF DISEASE
Since 12-24-2018
| Home Page | Visit Our Sponsors | Become a Sponsor |
Please read our DISCLAIMER |