

Global, Regional, and National Incidence, Prevalence,
and Years Lived with Disability for 301 Acute and
Chronic Diseases and Injuries in 188 Countries,
1990-2013: A Systematic Analysis for the
Global Burden of Disease Study 2013This section is compiled by Frank M. Painter, D.C.
Send all comments or additions to: Frankp@chiro.org


FROM: Lancet. 2015 (Aug 22); 386 (9995): 743–800 ~ FULL TEXT
OPEN ACCESS Global Burden of Disease Study 2013 Collaborators
School of Population Health,
Brisbane, QLD, Australia
BACKGROUND: Up-to-date evidence about levels and trends in disease and injury incidence, prevalence, and years lived with disability (YLDs) is an essential input into global, regional, and national health policies. In the Global Burden of Disease Study 2013 (GBD 2013), we estimated these quantities for acute and chronic diseases and injuries for 188 countries between 1990 and 2013.
METHODS: Estimates were calculated for disease and injury incidence, prevalence, and YLDs using GBD 2010 methods with some important refinements. Results for incidence of acute disorders and prevalence of chronic disorders are new additions to the analysis. Key improvements include expansion to the cause and sequelae list, updated systematic reviews, use of detailed injury codes, improvements to the Bayesian meta-regression method (DisMod-MR), and use of severity splits for various causes. An index of data representativeness, showing data availability, was calculated for each cause and impairment during three periods globally and at the country level for 2013. In total, 35,620 distinct sources of data were used and documented to calculated estimates for 301 diseases and injuries and 2337 sequelae. The comorbidity simulation provides estimates for the number of sequelae, concurrently, by individuals by country, year, age, and sex. Disability weights were updated with the addition of new population-based survey data from four countries.
FINDINGS: Disease and injury were highly prevalent; only a small fraction of individuals had no sequelae. Comorbidity rose substantially with age and in absolute terms from 1990 to 2013. Incidence of acute sequelae were predominantly infectious diseases and short-term injuries, with over 2 billion cases of upper respiratory infections and diarrhoeal disease episodes in 2013, with the notable exception of tooth pain due to permanent caries with more than 200 million incident cases in 2013. Conversely, leading chronic sequelae were largely attributable to non-communicable diseases, with prevalence estimates for asymptomatic permanent caries and tension-type headache of 2·4 billion and 1·6 billion, respectively. The distribution of the number of sequelae in populations varied widely across regions, with an expected relation between age and disease prevalence. YLDs for both sexes increased from 537·6 million in 1990 to 764·8 million in 2013 due to population growth and ageing, whereas the age-standardised rate decreased little from 114·87 per 1000 people to 110·31 per 1000 people between 1990 and 2013. Leading causes of YLDs included low back pain and major depressive disorder among the top ten causes of YLDs in every country. YLD rates per person, by major cause groups, indicated the main drivers of increases were due to musculoskeletal, mental, and substance use disorders, neurological disorders, and chronic respiratory diseases; however HIV/AIDS was a notable driver of increasing YLDs in sub-Saharan Africa. Also, the proportion of disability-adjusted life years due to YLDs increased globally from 21·1% in 1990 to 31·2% in 2013.
There are more like this at our
Global Burden of Disease PageINTERPRETATION: Ageing of the world's population is leading to a substantial increase in the numbers of individuals with sequelae of diseases and injuries. Rates of YLDs are declining much more slowly than mortality rates. The non-fatal dimensions of disease and injury will require more and more attention from health systems. The transition to non-fatal outcomes as the dominant source of burden of disease is occurring rapidly outside of sub-Saharan Africa. Our results can guide future health initiatives through examination of epidemiological trends and a better understanding of variation across countries.
From the FULL TEXT Article:
Introduction
The Global Burden of Disease Study 2013 (GBD 2013) is the first of a series of yearly updates for the GBD studies that began with estimates for 1990 and were most recently updated to 2010. The 2010 update (GBD 2010) systematically quantified prevalence of 1160 sequelae of 289 diseases and injuries across 21 regions. [1] National estimates for 187 countries were also derived on the basis of global and regional statistical analyses. [1] The metrics of years lived with disability (YLDs), equal to the sum of prevalence multiplied by the general public’s assessment of the severity of health loss, was used to explore patterns over time, age, sex, and geography. [1] Results for specific diseases and impairments have been extensively reported. [2–46] These results drew attention to the importance of disability from musculoskeletal disorders, mental and substance use disorders, and various other non-communicable diseases. [1] In developing countries, disorders such as anaemia and neglected tropical diseases remained important contributors to health loss. [18, 43, 47] More generally, the analysis showed the global transition towards a rapid increase in YLDs due to global population growth and ageing, combined with little progress in reduction of age-specific YLD rates.
In view of the ambitious goal of the GBD 2010, to synthesise the global evidence for the country–age–sex–year prevalence of all major disorders, several specific estimates were critiqued. Specific data sources, modelling assumptions, and aspects of the general approach were challenged and there was widespread recognition that more and higher quality data could improve the estimates. [48–52] Disability weights that were used to calculate YLDs were based on surveys of the general public in five countries (Bangladesh, Indonesia, Peru, Tanzania, and the USA) and an open internet survey. The validity of disability weights was questioned for selected states including hearing loss, vision loss, drug use, spinal cord lesion, intellectual disability, and musculoskeletal disorders. [53, 54] Some investigators questioned whether disability weights should be used to measure health or the loss of wellbeing associated with health states. [53, 55] Additionally, the YLD uncertainty intervals were large for several disorders because of scarce data, hence there was a need to statistically adjust for different case definitions, measurement methods, and wide uncertainty intervals for disability weights. Wide uncertainty intervals reduced the number of significant differences for some disorders reported across time and countries. Broad interest and crucial discourse about GBD also drew attention to many unpublished data sources in specific countries that could be used to strengthen the analysis.
With the prominent role attached to quantification of disease burden for health research and policy nationally and globally, up-to-date estimates based on the latest evidence for descriptive epidemiology constituted an essential global public good. [22–27, 32, 56–60] The GBD 2013 provides an opportunity to incorporate constructive criticism about GBD 2010 data sources, model development, methods, and interpretation. Additionally, the GBD 2013 shows methodological advances and includes new data for disability weights, capturing many new published or unpublished data sources for the disorders included in the GBD. Here, we report data, methods, and results from the analysis of 188 countries for 1990 to 2013 for 301 diseases and injuries and their 2337 sequelae. We report incidence for acute sequelae, prevalence for chronic sequelae, total prevalence by cause, in addition to YLDs for all causes. Because prevalence and YLDs for the entire period from 1990 to 2013 were reanalysed using consistent data and methods, these results supersede any previous publications about GBD.
Methods
Overview
Our general approach was similar to that for GBD 2010. The analysis of incidence and prevalence for HIV/AIDS, tuberculosis, and malaria for GBD 2013 have already been reported in detail. [61] Key changes from GBD 2010 were the inclusion of new data through updated systematic reviews and the contribution of unpublished data sources from many collaborators; elaboration of the sequelae list to include asymptomatic states, such as Plasmodium falciparum parasitaemia (without symptoms); use of more detailed nature-of-injury codes; improvements to the Bayesian meta-regression method; increased simulation size for comorbidity; estimation of the prevalence of injuries by cohort; and use of a novel method to estimate the distribution of mild, moderate, and severe anaemia by cause.
Cause and sequelae list changes
Based on feedback about GBD 2010, and input from the GBD 2013 collaborators, we expanded the cause and sequelae list (appendix pp 60–89). There were several key changes. First, we included asymptomatic states as explicit sequelae so that overall disease prevalence estimates were available, which might be useful for disease targeting, health service planning, or mass treatment strategies. Asymptomatic sequelae, by definition, were not associated with ill health and therefore were not assigned disability weights. Second, to deal with the challenge that some of the nature-of-injury categories used in the GBD 2010 were highly heterogeneous, these categories were expanded from 23 to 47. Third, we added several new causes and sequelae. All these additions to the cause list were done to either reduce the size of the large residual categories, such as other injuries, or recognition of substantial epidemiological heterogeneity within a disease category (appendix pp 60–89). With these changes, the cause list was expanded from 289 to 301 causes and from 1160 to 2337 sequelae. Most of the increase in sequelae was due to the expansion of the nature-of-injury sequelae, which applied to each of the external causes of injuries. The appendix pp 90–96 provides a list of the International Statistical Classification of Diseases and Related Health Problems, Tenth Revision (ICD-10) and International Classification of Diseases, Ninth Revision (ICD-9) codes for all GBD causes and the nature-of-injury categories.
Data sources
GBD 2010 collaborators undertook systematic reviews for most of the causes and sequelae. For some sequelae, the majority of the data came from household survey microdata reanalysis and administrative data such as hospital discharges. For others, most of the data were extracted from publications. Documentation of the GBD 2010 systematic reviews, however, was not centralised and only some of these reviews have been published. For this study, we updated systematic reviews through Aug 31, 2013. In some cases, studies published after Aug 31, 2013, were identified and included on the basis of GBD collaborator input; no data or studies were extracted after Nov 30, 2014. Household surveys including the demographic and health surveys, multiple indicator cluster surveys, living standards measurement surveys, reproductive health surveys, and various national health surveys included in the Global Health Data Exchange were systematically screened for data relevant to sequelae. For some diseases, case notifications reported to WHO were used as inputs and updated until the end of 2013. The appendix pp 97–653 provides a full list of citations for sources organised by country that were used for this analysis.

Table 1
Table 2 We computed an index of the geographical and temporal representativeness of the data sources available for non-fatal health outcomes for each cause or impairment—the data representativeness index (DRI). The overall DRI simply counts the fraction of countries that have any incidence, prevalence, remission, or excess mortality data available for causes that are prevalent in that country. We did not count cause of death data in this measure, even if it was used in the estimation of incidence or prevalence. We computed the same measure for three periods: before 1998, 1998–2005, and 2006 onwards. Table 1 provides the overall DRI and period-specific DRI measures for each cause and Table 2 provides the same information for estimation of total impairment prevalence.
The DRI was also computed for level 1 and level 2 causes (aggregate causes; see appendix pp 60–89) by counting data availability for any cause within that aggregate. This metric represents the availability of data and does not incorporate any assessment of data quality. The all-cause DRI was 100% overall and for each period, indicating that there was at least data for one cause for all 188 countries in each period. At more detailed levels, however, there was wide variation in the DRI across causes and time. DRI ranged from less than 2% for eight causes, including glucose-6-phosphate dehydrogenase deficiency trait and other mental and substance use disorders, to 100% for Chagas disease, African trypanosomiasis, and food-borne trematodiases. Causes with required infectious disease case reporting had high DRI values. Other disorders, such as cancers, had DRI values above 70% due to the network of population-based cancer registries. Although the time trend varied by disease, many of the highest DRI values were from 1998 to 2005. The lag in data analyses and publications might explain lower DRI values for 2006 to present.
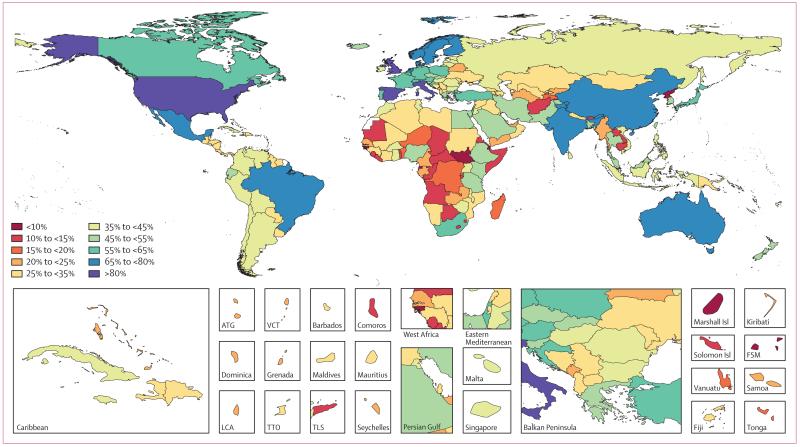
Figure 1 Data representativeness can also be assessed at the country level. Figure 1 shows a map of the percentages of causes for which there were data available in each of the 188 countries between 1990 and 2013. The DRI values ranged from 6% in South Sudan to 92% in the USA. Many developed countries had data for more than 65% of causes; Brazil, India, and China have similar levels. Low levels of data availability were noted in several sub-Saharan African countries, central Asia, the Caribbean, and the Balkans. There was substantial variation within regions; for example, Kenya had 49%, whereas Djibouti had less than 10%, Laos had 14%, and Thailand had 54%.
Sequelae incidence and prevalence
Table 3 The appendix pp 654–84 provides a brief description of the modelling strategy used for each sequela and cause. The most extensively used estimation method was the Bayesian meta-regression method DisMod-MR 2.0. For some causes such as HIV or hepatitis B and C, disease-specific natural history models were used in which the underlying three state model in DisMod-MR 2.0 (susceptible, cases, or dead) was insufficient to capture the complexity of the disease process. For some diseases with a range of sequelae differentiated by severity, such as chronic obstructive pulmonary disease (COPD) or diabetes mellitus, DisMod-MR 2.0 was used to meta-analyse the data for overall prevalence. Separate DisMod-MR 2.0 models were then used to analyse data for the proportion of cases with different severity levels or sequelae. Likewise, DisMod-MR 2.0 was used to meta-analyse data for the proportions of liver cancer and cirrhosis due to underlying causes such as hepatitis B, hepatitis C, and alcohol use. For acute sequelae, we report incidence (defined as a duration of 3 months or less) at the cause level in Table 3, because incidence is the preferred measure for disorders of short duration.
DisMod-MR 2.0 represents a major advance in the computational speed, geographical disaggregation of full internally consistent posterior estimation, and display of data results compared with DisMod-MR 1.0, which was used in GBD 2010. Through cross-validation tests, Flaxman and colleagues reported [62] that the log-rates specification of models worked as well or better than the negative binomial specification used in DisMod-MR 1.0. Based on these findings, and the substantial improvements in computational speed for log-rate models, this specification was the default method for DisMod-MR 2.0. The appendix pp 3–6 provides details of the DisMod-MR 2.0 likelihood estimation. The DisMod-MR 1.0 sequence of global estimation, regional estimation, and country prediction, which we call an analytical cascade, is illustrated in the appendix p 734. DisMod-MR 2.0 uses a more complete cascade (appendix p 735). At the global level, a mixed-effects non-linear regression with all available country data was used to generate initial global estimates that are passed to the next level of the DisMod cascade to inform the model for each super region. In turn, a super-region specific mixed-effects non-linear regression was used to estimate for regions. The same regression method was used for estimation of further geographical dis aggregation. The analyst could choose, depending on data density, to branch the cascade in terms of time and sex at different levels. In GBD 2010, DisMod-MR 1.0 was used to generate fits for three periods only: 1990, 2005, and 2010 because of long computational time. For GBD 2013, we generated fits for 1990, 1995, 2000, 2005, 2010, and 2013.
DisMod-MR 2.0 internal validity was assessed by use of R2 for adjusted data. Results for all DisMod-MR 2.0 models are provided in the appendix pp 654–84. Adjusted data were the original study data transformed to the reference case definition and measurement method, using the meta-regression component of DisMod-MR 2.0 to make the data from different studies with varying methods comparable. External validity was also evaluated through cross-validation on a small number of sequelae due to the computational time and complexity for this analysis. We selected ten DisMod-MR 2.0 models representing a range of data densities to evaluate. We held out 30% of datapoints for incidence and prevalence at random, refit the model, and compared predictions to the held-out data. We assessed model performance using two metrics: the root-mean squared error of the predictions compared with the data held out, and the coverage of the data prediction with 95% uncertainty intervals. The appendix pp 736–37 provides these metrics for the ten models tested. In all cases, external validity was equal to or only slightly worse than the internal validity.
As in GBD 2010, DisMod-MR was not used to model estimates for a shortlist of causes; custom models were created for many of these. For some of these causes, important improvements in the modelling strategy were implemented. Changes for HIV and malaria have been described elsewhere. [61] For dengue, the model was modified to use the first component of a principal components’ analysis of Bhatt and colleagues’ dengue transmission probability to improve estimation of case rates. [63] For lymphatic filariasis, precontrol levels were estimated from data reported in the lymphatic filariasis atlas. [64] Last, based on crucial input from GBD collaborators, we chose to model rheumatic heart disease in low-income and middle-income countries separately from high-income countries in view of potential differences in long-term cohort effects of treatment.
Estimation for cancer in GBD 2013 largely followed a similar analytical strategy to GBD 2010, which used a combination of incidence data, survival data, and sequelae durations to estimate cancer prevalence and YLDs. [65, 66] The analysis benefited from the inclusion of both the latest edition of Cancer Incidence in Five Continents and a larger number of other cancer registries particularly in China. In GBD 2013, we also incorporated new data from the US National Cancer Institute’s Surveillance, Epidemiology, and End Results Program (SEER) [67] and WHO’s International Agency for Research on Cancer’s Cancer Survival in Africa, Asia, the Caribbean, and Central America to update best and worst case survival, yearly survival trends, and sequelae durations for all cancers. [68] Based on evidence that individuals with most cancers continue to have higher mortality beyond 5 years than do the general population, we estimated the burden of cancer for up to 10 years after incidence. Estimates for cancer sequelae now represent the burden for all cancer patients by contrast with estimation of the burden just for cancer survivors (see appendix pp 7–8 for more detail on aspects of estimating non-fatal cancer outcomes that were different from the methods used in GBD 2010).
Injuries
We followed a similar strategy to GBD 2010 for estimating the burden of injuries, except for an expanded list of 26 external cause-of-injury categories (from 15) and 47 nature-of-injury categories (from 23) for both short-term outcomes and lasting disability (see appendix pp 90–96 for ICD codes). More detail was added to both external causes and nature-of-injury categories to reduce epidemiological heterogeneity within each combination of cause and nature-of-injury category. The key analytical steps are explained in greater detail in the appendix pp 9–14. Here we provide a summary of the methods.
First, for each external cause, DisMod-MR 2.0 was used to analyse incidence based on hospital, emergency department, and survey data. Second, we estimated the distribution of nature of injury for each external cause using data that had both types of code available. When individuals were coded with more than one nature-of-injury code, we used the most severe. Third, we analysed seven studies that provided at least 1 year of follow-up for various natures of injury to estimate long-term disability. [69–75] Fourth, we estimated cohort prevalence of long-term disability from the incident cases of injury for each external cause and nature-of-injury combination while accounting for excess mortality for the more severe post-injury sequelae. For some injuries, treatment modifies the disability weight. In these cases, we approximated the fraction of injuries receiving treatment as a function of an indicator of health system access. [76]
Short-term disability was estimated for all natures of injury by cause-of-injury categories as the product of prevalence (estimated by multiplying incidence by mean duration) and the appropriate disability weight. The duration for treated cases of injuries was determined by information in the Dutch Injury Surveillance System follow-up studies of 2001–04 and 2007–10. [71, 73] We used expert opinion to estimate a multiplier for the duration of short-term disability from untreated injuries and used the estimates of access to care by country and year as we have described for the long-term disability.
YLDs from 29 residual causes
Despite expanding our list of causes and sequelae in GBD 2013, many diseases remain for which we do not explicitly model disease prevalence and YLDs. The GBD cause list is collectively exhaustive such that all sequelae with an ICD code are mapped to a cause group (appendix pp 90–96). Many less common sequelae are included in 29 of the residual categories. For 14 of these cause groupings, epidemiological data for incidence or prevalence are available so that they can be modelled as other causes have been modelled—this set includes meningitis, cirrhosis, liver cancer, pneumoconiosis, and chronic kidney disease due to other causes, other neoplasms, other cardiovascular and circulatory diseases, other drug use disorders, other mental and substance use disorders, other gynaecological diseases, other musculoskeletal disorders, other skin and subcutaneous diseases, age-related and other hearing loss, other vision loss, other sense organ diseases, and other oral disorders. For 12 residual categories (other intestinal infectious diseases, other neglected tropical diseases, other maternal disorders, other neonatal disorders, other nutritional deficiencies, other infectious diseases, other chronic respiratory diseases, other digestive diseases, other neurological disorders, other urinary diseases, other haemoglobinopathies and haemolytic anaemias, and other congenital anomalies), epidemiological data for incidence and prevalence were not available for the entire residual cause groupings but sufficient cause of death data allowed for cause of death estimates. For each category, we identified causes within the larger cause group that had both estimates of years of life lost (YLLs) and YLDs, which we expected to have similar ratios of mortality to morbidity. We then computed the ratio of YLLs to YLDs for these specific causes (on a country–sex–year basis) and applied them to the residual category’s YLLs to estimate its YLDs. This approach makes the simplified assumption that on average within a level 2 disease grouping the disability is proportionate to mortality within a country–sex–year. For an additional three residual categories (other sexually transmitted diseases, other drug use disorders, and other mental and substance use disorders), there were no overall epidemiological data or sufficient deaths to generate cause of death estimates. For the last two, we used US outpatient data or prevalence data from the Medical Expenditure Panel Survey (MEPS), National Epidemiologic Survey on Alcohol and Related Conditions (NESARC), or the 1997 Australian mental health survey77 and applied a severity distribution from these surveys in all countries and periods. These two causes for which US and Australian data were applied worldwide account for 1·6% of global YLDs.
Impairments
As in GBD 2010, we estimated the country–age–sex–year prevalence of nine impairments: anaemia, epilepsy, hearing loss, heart failure, intellectual disability, infertility, vision loss, Guillain-Barré, and pelvic inflammatory disease. These impairments were selected because they are sequelae of more than one disease and data are available to estimate prevalence for the overall impairment. Generally, overall impairment prevalence was estimated using DisMod-MR 2.0. Cause-specific estimates of impairments, such as the 19 causes of blindness, are required to provide the total prevalence estimated for that impairment. Anaemia, epilepsy, hearing loss, heart failure, intellectual disability, and pelvic inflammatory disease are estimated for different levels of severity. Separate estimates were made for primary infertility (in couples who have not been able to conceive) and secondary infertility (in couples having trouble conceiving again) and, for each, if the impairment is affecting men or women, or both. The severity distribution of cause-specific prevalence of each impairment was estimated as explained above or, in the absence of severity-specific data, assumed to be proportionate across all levels of severity. In the case of epilepsy, severity levels were determined by mixed-effect models for the proportions of primary, severe, and treated epilepsy, and a meta-analysis for seizure-free treated epilepsy, and thus had values that were specific for country, age, sex, and year. DisMod-MR 2.0 models produced country-specific, age-specific, sex-specific, and year-specific levels of hearing loss and vision loss. Due to little information about the severity levels of intellectual disability, we assumed a similar distribution of severity worldwide based on meta-analysis of intelligence quotient (IQ)-specific data for the overall impairment. This was supplemented with cause-specific distributions for chromosomal causes and iodine deficiency, whereas the severity of intellectual disability included in the long-term sequelae of causes such as meningitis, neonatal tetanus, and malaria was combined with several impairments such as motor impairment, blindness, or seizures. The severity of heart failure is derived from our MEPS analysis and therefore is not specific for country, year, age, or sex.
Our method for estimating overall anaemia was largely the same as in GBD 2010 but with the addition of new data sources, specifically subnational data for the UK, China, and Mexico.43 We adopted different thresholds for defining anaemia during the neonatal period, because the GBD 2010 thresholds did not account for haematological realities of early life. The GBD 2013 thresholds match the WHO recommendations [78] with the exception of thresholds of less than 1 month because there is no international cutoff for diagnosis at that age. [43, 79] To disaggregate marginal estimates of anaemia severity and cause into a complete set of prevalence estimates for cause and severity pairs, we developed a new method for GBD 2013 that used techniques from Bayesian contingency table modelling. [80, 81]
In GBD 2010, hearing loss of more than or equal to 35 dB in DisMod-MR 1.0 was estimated and then broken down into six severity levels based on a series of regressions on the proportionate distribution across categories. In GBD 2013, we first estimated the prevalence of normal hearing, hearing loss of 20–34 dB (mild), and greater than 35 dB (moderate and above); these three categories were fixed to add up to 100%. We then ran separate DisMod-MR 2.0 models for five severity levels (ie, moderate 35–49 dB, moderately severe 50–64 dB, severe 65–79 dB, profound 80–94 dB, and complete ≥95 dB), which were then proportionally rescaled to fit in the 35 dB or greater envelope. In GBD 2010, the same severity distribution was assumed for each cause of hearing loss. In GBD 2013, we customised the prevalence estimation for each cause. Hearing loss due to otitis media and age-related hearing loss were estimated by DisMod-MR 2.0 using prevalence data. Hearing loss due to meningitis was estimated as a proportion of meningitis cases from a meta-analysis. [82] Congenital hearing loss was estimated using birth prevalence data in DisMod-MR 2.0, assuming a constant prevalence for all ages because there was no evidence of an increased mortality risk. We assumed all hearing loss from otitis media was mild or moderate on the basis of reported distribution of hearing loss. [83, 84] To account for hearing aids, we assumed that the use of a hearing aid reduces the severity of hearing loss by one severity level. The other causes were assumed to cover the full range of severities. More details about impairments are provided in the appendix pp 15–32.
Severity distributions
For 213 causes, a range of sequelae are defined in terms of severity. Important changes to the sequelae list with regards to severity include low back pain, alcohol and drug dependence categories, uterine prolapse, and epilepsy. Milder states for low back pain and alcohol and drug dependence categories were added because these disorders had a large gap between asymptomatic cases and the high value of the disability weight for the least severe symptomatic categories, whereas the epidemiological data for severity indicates a sizeable proportion of cases with milder disability. Stress incontinence was added as a sequela of uterine prolapse with a new disability weight that is distinct from full incontinence. Also, epilepsy health states are now better aligned with epidemiological data based on seizure frequency. In cases in which severity is related to a particular impairment, such as mild, moderate, and severe anaemia due to malaria, the analysis is driven by the impairment estimation described above. For some outcomes such as COPD or asthma, data have been gathered in different locations around the world and these have been modelled using DisMod-MR 2.0 (see appendix pp 694–733 for details). In other cases, published meta-analyses have been used to estimate the allocation of cases by severity. For the remaining causes, we used the same approach for estimating the distribution of severity as in the GBD 2010; empirical analysis of this model was updated through the addition of 2 years from the US MEPS. The appendix pp 685–87 lists the GBD causes that can be identified in MEPS and the corresponding ICD-9 CM codes. In total, 203 960 observations, covering 119,676 individuals, were used. In the cases of dementia, Parkinson’s disease, multiple sclerosis, osteoarthritis, schizophrenia, and bipolar disorder, data identified through literature reviews were used to inform the severity distribution. The introduction of a mild health state for four drug dependence categories required identification of epidemiological data to estimate the proportion of cases with mild versus more severe disability. For cannabis dependence, we used the NESARC survey in the USA and the Australian National Survey of Mental Health and Wellbeing. For the remaining three drug dependence categories, we only had access to one study on polydrug users in Australia, which led to about half of dependent cases being assigned to the more severe and mild health states. Although this information is derived from a non-representative cohort of drug users, it was thought to be more appropriate than deriving a severity distribution from a household survey like NESARC in which only a small proportion of individuals dependent on opioids, cocaine, or amphetamines would be represented.
Revisions to disability weights
The GBD 2010 disability weights measurement study introduced a new method of pairwise comparisons as a means of eliciting weightings for health states in population surveys. [85, 86] Data were gathered in five countries (Bangladesh, Indonesia, Peru, Tanzania, and the USA) and supplemented with a web survey. In total, responses were gathered from 30,230 people in 167 countries. Respondents were presented with a series of randomly selected pairwise comparisons of lay descriptions of health states and asked to state which health state is healthier than the other. Salomon and colleagues [85] developed a statistical model that yields from these pairwise comparisons disability weights on a scale from 0 (no health loss) to 1 (equivalent to death).
Based on important commentary and review of the GBD 2013 collaborators, we have revised the lay descriptions of 32 states and added 16 new states. The revised lay descriptions were based on identifying inconsistency in the way progression across levels of severity had been handled for some outcomes and the addition of social isolation to the descriptions for complete, profound, and severe hearing loss. New states included five milder health states for alcohol and drug dependence; two health states for the alignment of epilepsy with the epidemiological data defining severe epilepsy in individuals who had on average one or more fits per month and less severe epilepsy in those with between one and 11 fits in the past year; two milder health states for low back pain; and one each for stress incontinence, concussion, hypothyroidism, hyperthyroidism, thrombocytopenic purpura, vertigo, and amputation of one arm without treatment. The appendix pp 688–93 provides a complete list of the lay descriptions of all 235 GBD 2013 health states.
In 2013, we had the opportunity to collaborate with the European Centre for Disease Prevention and Control to gather new data for disability weights in four population-based national surveys (Hungary, Italy, Sweden, and the Netherlands) using the Salomon and colleagues’ protocol. [85, 87] Because of funding and questionnaire length, the surveys included 140 of 220 GBD 2010 health states for which the lay descriptions had not been revised, 32 health states with revised lay descriptions, and 42 new health states, 16 of which were included in GBD 2013. These nationally representative samples were comprised of 30,660 respondents. For GBD 2013, the data of GBD 2010 disability weights measurement study and the European disability weights measurement study [88] were pooled in a single analysis of individual responses, thus doubling the number of respondents to 60,890 in both studies. For states where the lay description was not previously included, revised, or new, only the European disability weights measurement study data were used. This means that all disability weights in GBD 2013 differ from the GBD 2010 disability weights. Most disability weights changed slightly, but some differ more widely (appendix pp 688–93). Some of the more substantial changes were due to the inclusion of incontinence in the lay descriptions for spinal cord injury and the inclusion of the psychological consequences of social isolation in people with more severe hearing loss, leading to much higher disability weights. The statistical analysis generates uncertainty distributions for each disability weight that are propagated into the uncertainty distributions of the estimates of YLDs.
Comorbidity
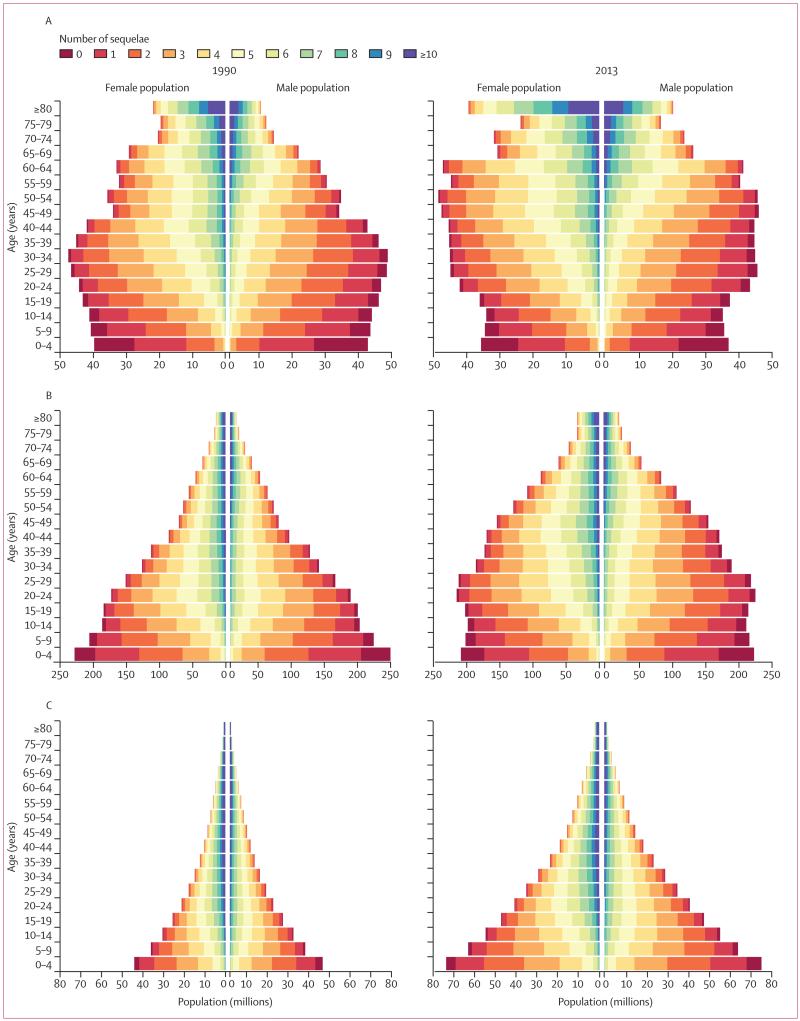
Figure 2 Many individuals have more than one disease or injury sequela at the same time. To accurately account for comorbidity and its effect on disability for individuals, we used the GBD 2010 microsimulation approach. In the microsimulations, a set of individuals are exposed to the probability of having all the different sequelae included in the GBD to estimate a distribution of the combinations that might be seen in each country–age–sex–year. We modelled the probabilities within each country–age–sex–year of different sequelae as independent. Although there are clear examples of the probability of one sequela changing the probability of other sequelae, such as diabetes and ischaemic heart disease, testing reported by Vos and colleagues [1] suggested that modelling assuming independence was a reasonable approximation. However, for less common sequelae the microsimulation tends to increase the estimated uncertainty in the number of YLDs substantially because, for example, a sequela that is estimated to have a prevalence of less than one in 10,000 will not appear randomly in many microsimulations of 20,000. Two steps have been taken to reduce the inflation of uncertainty for uncommon sequelae. First, the number of simulants in each country–age–sex–year was increased to 40,000; the main limiting factor for the number of simulants is computational resources needed to run each of the 62,880 country–age–sex–year simulations 1000 times to account for uncertainty in each of the input prevalence rates. Second, we excluded sequelae in a country–age–sex–year with a prevalence of less than one in 20,000 from the microsimulation. The combined disability weight for individuals with several sequelae was computed as in the GBD 2010 using a multiplicative model; namely, the individual’s disability weight is equal to one minus the cross product of one minus the disability weight for each sequela that the individual has. An output from the comorbidity microsimulation is counts of the number of sequelae for each simulant in the population. The numbers of simulants with different comorbidities in a country–age–sex–year was adjusted from 40,000 to equal the estimated population in each country–age–sex–year to produce the estimated distribution of individuals in each country with comorbidities. Sequelae with a prevalence of less than one in 20,000 that were not included in the microsimulation, are also not included in the population pyramids showing individuals by numbers of sequelae (Figure 2A–C). A technical description of the comorbidity simulation is given in the appendix p 2.
We have reported 95% uncertainty intervals for each quantity in this analysis. For disease or sequelae incidence or prevalence rates, age-standardised rates or counts, the models such as DisMod-MR 2.0 provide posterior distributions for each quantity from which 95% uncertainty intervals are computed. For YLDs, we incorporated uncertainty in prevalence and uncertainty in the disability weight into the posterior distribution of YLDs. In practice, we estimated the posterior distribution of YLDs by taking 1000 samples from the posterior distribution of prevalence and 1000 samples of the disability weight to generate 1000 samples of the YLD distribution. We estimated the 95% uncertainty interval by reporting the 25th and 975th values of the distribution. Uncertainty intervals for YLDs at different timepoints (1990, 1995, 2000, 2005, 2010, and 2013) for a particular disease or sequela are correlated because of the shared uncertainty in the disability weight.
Role of the funding source
The funder of the study had no role in study design, data collection, data analysis, data interpretation, or writing of the report. The corresponding author had full access to all the data in the study and had final responsibility for the decision to submit for publication.
Results
Figure 2A–C shows the population pyramid for developed countries, developing countries excluding sub-Saharan Africa, and sub-Saharan Africa in 1990 and 2013 broken down by the number of sequelae, ranging from none to more than ten sequelae. Most of the world’s population had at least one of the GBD sequelae and most people had several. As expected, in view of the strong relation between age and disease prevalence for most non-communicable diseases and injuries, the number of individuals with several morbidities rapidly increased with age. In developed countries in 2013, 35·9% of the age group 0–4 years had no sequelae with only 0·03% older than 80 years with no sequelae (figure 2A). In the age group older than 80 years, 10·3% had one to four sequelae, 64·6% had five to nine sequelae and 25·1% had ten or more sequelae in 2013. The percentage of each age group with several morbidities rose progressively with age irrespective of the cutoff used to define several morbidities. Due to this relation and the demographic shifts towards older ages in developed countries, the number of individuals with more than ten sequelae increased by 51·6% from 1990 to 2013. In the oldest age group, 23·6% of women and 27·8% of men had more than ten sequelae, but the large population imbalance at older age favouring women meant that there were 1·4 times more women than men with ten or more sequelae.
Figure 2B shows the pyramids for developing countries outside of sub-Saharan Africa, showing that the birth cohorts in 2013 were smaller than in 1990. The major demographic change was the large expansion of adults in the age groups 20–54 years for men and women from 1990 to 2013. Comparison of 1990 and 2013 showed little change in the distribution of the population in each age group by the number of sequelae. Rising numbers with several morbidities were attributable to ageing. 20·3% of the age group 0–4 years and 0·05% older than 80 years had no sequelae. In the oldest age group, 12·5% had one to four sequelae, 63·9% had five to nine sequelae, and 23·5% had ten or more sequelae.
As shown in figure 2C, the main result was the massive growth in population in sub-Saharan African countries from 1990 to 2013 and continued pattern of a low percentage of the population at older ages driven by high fertility and high mortality. Due to several very common sequelae that start early in life such as anaemia, soil-transmitted helminths, and schistosomiasis, only 7·8% of the age group 0–4 years and 0·002% at age 80 years and older in sub-Saharan Africa had no sequelae in 2013. Although there were few individuals reaching the oldest age groups, in the population aged 80 years and older, 1·9% had one to four sequelae, 42·6% had five to nine, and 55·5% had ten or more sequelae, which were higher than in developed countries. Multiple morbidities were also common in all regions in working age adults (20–64 years): 31·7% with five or more sequelae in developed countries, 37·9% in developing countries outside of sub-Saharan Africa, and 61·6% in sub-Saharan Africa. Of the 2·3 billion individuals in 2013 with more than five sequelae, 81·4% were younger than 65 years.
The comprehensive and systematic nature of GBD provides an opportunity to assess the most common acute disorders affecting people around the world and the trends from 1990 to 2013. Table 3 shows the 65 causes of acute disease (<3 months’ duration) and injury incidence with more than 1 million cases per year in 2013. For the causes with more than one acute sequela, such as typhoid fever (acute infection, intestinal perforation, and intestinal bleeding), maternal sepsis (puerperal sepsis and other maternal infections), or hypertension in pregnancy (eclampsia, pre-eclampsia, and other hypertensive disorders in pregnancy), we aggregated all the acute sequelae for a cause for presentation in table 3. Of note, there are two disorders with an incidence of greater than 2 billion in 2013: upper respiratory infections (18·8 billion) and diarrhoeal diseases (2·7 billion). Another 12 diseases and injuries accounted for between 100 million to 1 billion incident cases per year in 2013: injuries due to other exposure to mechanical force, acute otitis media, tooth pain due to caries of permanent teeth, bacterial skin diseases (including impetigo and abscess), falls; lower respiratory infections, clinical episodes of malaria, chlamydia infection, varicella (including chickenpox and herpes zoster episodes), acute hepatitis B, gallbladder and biliary tract disease, and acute hepatitis A. There were 28 diseases and injuries with incident cases between 10 million and 100 million per year including several injuries, such as non-venomous animal contact, motor vehicle road injuries, fire, heat, and hot substances, motorcycle and pedestrian injuries, and infections such as urinary tract infections, typhoid, hepatitis C and E, dengue, gonorrhoea, the initial episodes of genital herpes, trichomoniasis, and several disorders affecting the digestive system, including gastritis and duodenitis, peptic ulcer disease, pancreatitis, and appendicitis.
Among the most common causes of acute disease incidence, 47 increased in absolute numbers of incident cases from 1990 to 2013 but only 13 had rising age-standardised rates of which six had significant increases (upper respiratory infections, interstitial nephritis, urinary tract infections, dengue, pancreatitis, paralytic ileus, intestinal obstruction, and unintentional suffocation; table 3). Numbers declined for 18 of 65 causes in table 3, seven of which were infectious diseases that predominantly affected children. Two were maternal disorders and for one, peptic ulcer disease, the decline was not significant. Some injuries such as non-venomous animal contact, fire, heat, and hot substances, collective violence and legal intervention, exposure to forces of nature, venomous animal contact, poisoning, and drowning decreased in absolute incidence numbers. For 52 of 65 causes, age-standardised rates declined—for 34 causes, numbers increased due to demographic change even though age-standardised rates declined. In the set of causes of more than 1 million cases per year, dengue had the most striking increase in the age-standardised rates (447·3%; table 3).
Table 4 Table 4 summarises the prevalence of chronic disease and injury sequelae (>3 months) aggregated to the cause level. This table provides a high-level view of the leading causes of chronic disorders worldwide for the 59 causes with a global prevalence of greater than 1% in 2013. Leading causes were a mixture of oral disorders, neurological disorders, skin diseases, musculoskeletal disorders, neglected tropical diseases, gynaecological disorders, chronic kidney disease, some causes of anaemia, age-related hearing, other vision loss, and injuries. Eight causes affected more than 10% of the world population in 2013: permanent caries without pain, tension-type headaches, iron-deficiency anaemia, glucose-6-phosphate dehydrogenase deficiency trait, age-related and other hearing loss, genital herpes without symptoms, migraine, and ascariasis. Another 51 causes afflicted between 1% and 10% of the world’s population. In this set of disorders were those that were not prominent causes of YLDs because the average disability weight was low, but they might have been important in terms of health system resources or health service planning. These disorders included glucose-6-phosphate dehydrogenase deficiency, genital prolapse, premenstrual syndrome, edentulism, polycystic ovary syndrome, uterine fibroids, and several skin diseases.
Rates for only six causes of chronic disease (micronutrient deficiencies, worm infestations, and chronic hepatitis B; table 4) declined fast enough to lead to declines in the absolute numbers for each worldwide. As noted in table 3, several acute infectious diseases and other acute disorders also declined in absolute numbers. The numbers of cases increased for 17 other chronic disorders but there were significant reductions in age-standardised rates: age-related and other hearing loss, genital herpes, uncorrected refractive error, deciduous caries without pain, dermatitis, edentulism and severe tooth loss, osteoarthritis, uterine fibroids, chronic hepatitis C, viral skin diseases, chronic kidney disease due to hypertension, ischaemic heart disease (angina, post-myocardial infarction, and heart failure), alcohol use disorders, asthma, chronic kidney disease due to glomerulonephritis, injury due to other exposure to mechanical forces, and endocrine, metabolic, blood, and immune disorders. Five chronic disease and injury states showed significant increases in age-standardised rates of greater than 5% from 1990 to 2013: glucose-6-phosphate dehydrogenase deficiency, diabetes mellitus, sickle cell trait, other musculoskeletal disorders, and urolithiasis.
Table 5
Table 10 Table 5 show the estimated prevalence and the distribution of prevalence by cause and severity of five major impairments in 1990 and 2013 (the remaining four impairments are reported in the appendix pp 15–32). Table 5 also provides overall YLDs due to each impairment to provide context for the total burden related to each impairment.
We estimated that 1·83 billion individuals had anaemia in 1990, rising to 1·93 billion in 2013 (Table 5). Taking into account the distribution of anaemia across mild, moderate, and severe, total anaemia YLDs equalled 62·0 million in 1990, dropping slightly to 61·5 million in 2013. This number of YLDs made anaemia from all causes larger than the second leading disease contributing to YLDs, major depressive disorder (Table 10). In addition to the reduction in overall prevalence, there was a small but notable shift towards more cases of mild anaemia and less severe and moderate anaemia from 1990 to 2013. By 2013, 49·2% of individuals had mild anaemia, 46·9% had moderate anaemia, and 3·9% had severe anaemia (table 5). Iron-deficiency anaemia accounted for 62·6% of all cases and 31·5% of mild, 28·7% of moderate, and 2·4% of severe anaemia. The next five most common causes of anaemia overall were thalassaemia trait, malaria, gastritis, and duodenitis, other neglected tropical diseases, and other haemoglobinopathies and haemolytic anaemias. Hookworm and schistosomiasis together accounted for 55·2 million cases and malaria accounted for a further 80·6 million cases. From 1990 to 2013, the number of anaemia cases due to malaria increased by 38·9%. Causes with an increase in cases of more than 50% included chronic kidney disease due to diabetes mellitus, chronic kidney disease due to other causes, and sickle cell disorders.
Table 5 shows that the estimated number of individuals with some form of hearing impairment (20 dB or more) rose from 807·2 million in 1990 to 1·23 billion in 2013. Globally, hearing loss accounted for 25·1 million YLDs in 1990, increasing 45·3% to 36·5 million YLDs in 2013. In 2013, 800·7 million people had mild hearing loss (less than 35 dB), whereas 414·5 million had moderate or moderate to severe hearing loss. The number with complete hearing loss (8·0 million) was somewhat higher than in 1990 (6·7 million). Just over 90% of hearing loss was classified as age-related and other hearing loss in 2013. Otitis media was the next most important cause of overall hearing loss but only caused mild or moderate hearing loss. In 2013, congenital anomalies accounted for 2·1% of all hearing loss but 21·1% of complete hearing loss.
Table 5 provides a detailed breakdown at the global level of the 61·7 million cases of heart failure (left-sided and right-sided) in the world, more than half of which were classed as severe. Worldwide, the number of individuals who had heart failure increased 96·4% from 1990 to 2013. A third of heart failure was due to ischaemic heart disease (table 5). Five other causes accounted for 62·0% of heart failure: hypertensive heart disease, other cardiovascular and circulatory diseases, cardiomyopathy and myocarditis, COPD, and rheumatic heart disease (table 5). All other causes each accounted for about 5% of heart failure. Notably, in 2013, Chagas disease accounted for 0·6% of heart failure globally but 11·4% in Brazil. All causes of heart failure accounted for 8·6 million YLDs in 2013 (table 5).
Table 6
Table 7
Table 8
Table 9
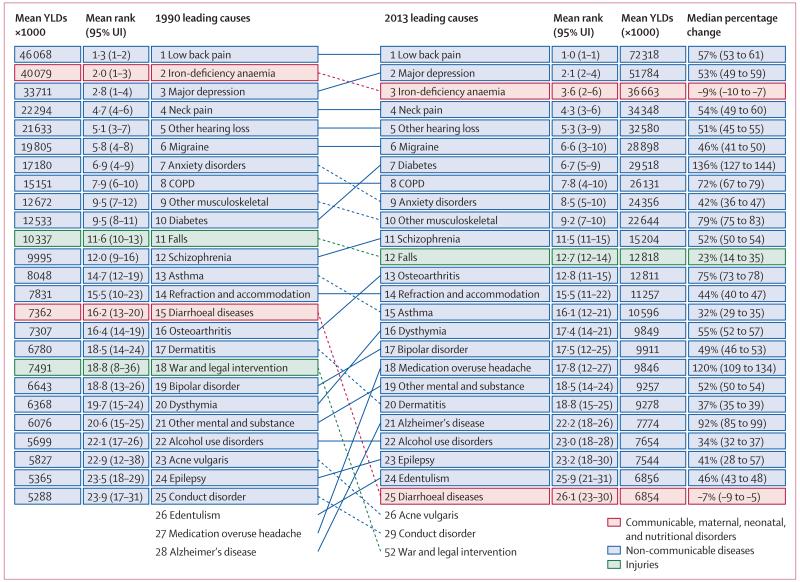
Figure 3 Table 5 shows that the number of individuals with intellectual impairment increased from 118·2 million in 1990 to 154·0 million in 2013. In 2013, we estimated that borderline (IQ 70–84) and mild intellectual impairment (IQ 50–69) accounted for 104·9 million cases and moderate, severe, and profound intellectual impairment around 49·1 million cases. The most important causes of intellectual impairment in 2013 were idiopathic intellectual disability (61·5%) followed by neonatal causes (mainly preterm birth complications and neonatal encephalopathy), congenital causes (mainly Down’s syndrome and chromosomal unbalanced rearrangements), cerebrovascular disease, and infectious causes (mainly meningitis; Tables 5–9). Comparison of the levels by cause in 1990 and 2013 showed that idiopathic intellectual disability increased 22·7%, intellectual disability from preterm birth complications increased 129·6%, and intellectual disability from neonatal encephalopathy decreased 5·8%.
Table 5 shows the distribution of visual impairment including presbyopia in 1990 and 2013. The numbers of individuals with visual impairment, taking into account the availability of visual aids, increased from 518·6 million in 1990 to 774·1 million in 2013. 72·4% of this total in 2013 was uncorrected presbyopia. Excluding presbyopia, in 1990 there were 137·0 million individuals with moderate or severe vision loss increasing to 178·8 million in 2013 (table 5). Over the same period there was an increase in blindness from 23·1 million to 33·0 million. The increase in age-standardised rates per 100 000 for visual impairment overall was from 12 702·2 to 11 740·9 and for blindness from 602·5 to 521·3. The most important cause of visual impairment in terms of prevalence and YLDs was uncorrected refractive error accounting for just over 85% of all cases and 56% of YLDs due to vision impairment. In terms of YLDs, the next most important cause was cataract followed by other vision loss, preterm birth complications, glaucoma, macular degeneration, and diabetes.
Figure 3 shows the comparison of the leading causes of global YLDs in 1990 and 2013, which provides detailed cause breakdowns that were most relevant to prioritising specific programmes or interventions. The top cause in 1990 and 2013 was low back pain. The second leading cause changed due to the decline in iron-deficiency anaemia and the rise in major depressive disorder. Two more top ten causes were musculoskeletal disorders: neck pain and the large category of other musculoskeletal disorders. Other top ten causes included migraine, age-related and other hearing loss, COPD, anxiety, and diabetes. Causes that increased more than two ranks from 1990 to 2013 included diabetes mellitus, osteoarthritis, dysthymia, medication overuse headache, and Alzheimer’s disease and other dementias. Declines of more than two ranks were noted for dermatitis, diarrhoeal diseases, acne vulgaris, conduct disorder, and war and legal intervention.
Table 10 provides the global estimates of prevalence and YLDs for 2013 and change from 1990 to 2013 for each cause (the full details at the levels of the sequelae; prevalence, YLD, and change between 1990 and 2013 by cause and age group; and prevalence, YLD, and change between 1990 and 2013 by cause and country are shown in the appendix pp 738–811). In the GBD framework, individuals should be assigned to a unique sequela such that the sum of the YLDs or prevalence by sequela should equal the total prevalence and YLDs for a disease or injury. Since specific sequelae are of substantive interest to help target interventions or needs for new interventions, and to enhance the transparency of computation, we have provided the full list of causes and sequelae. Comparison of the percentage change in absolute number of YLDs from 1990 to 2013 and the percentage change in the age-standardised YLD rate shows where demographic change, both population increase and rising mean age, had a major effect. Age-standardised YLDs and prevalence for several infectious diseases showed significant declines of greater than 10% including diarrhoeal diseases, typhoid, paratyphoid, lower respiratory infections, meningitis, encephalitis, diphtheria, whooping cough, tetanus, measles, Chagas, African trypanosomiasis, cysticercosis, cystic echinococcosis, lymphatic filariasis, onchocerciasis, trachoma, rabies, ascariasis, trichuriasis, and hookworm. By contrast, significant increases in age-standardised rates of greater than 10% were noted for HIV (from 1990 to 2013, but declines since 2005),61 cutaneous and mucocutaneous leishmaniasis, and dengue. Some other disorders such as malaria, tuberculosis, upper respiratory infections, varicella, and schistosomiasis did not show significant changes in either direction of greater than 10%.
Age-standardised YLD rates for all maternal causes and sequelae combined declined significantly. Overall age-standardised YLDs for neonatal disorders increased 80·5% from 1990 to 2013 (table 10). Large increases in age-standardised rates were noted for all neonatal causes. Age-standardised YLDs and prevalence of nutritional deficiencies decreased as did the absolute numbers of cases. Although there was a decline in the age-standardised rates for syphilis, they were either non-significant or small for chlamydia and gonorrhoea (table 10). The decline was significant for hepatitis B and C, but non-significant for hepatitis A and E. Of note, the number of individuals with hepatitis C infection increased.
Age-standardised YLD rates from all non-communicable diseases changed by only 1·4% from 1990 to 2013, but YLD numbers increased by 54·2% (table 10). Stagnant overall rates masked highly diverse trends for specific causes. Overall, neoplasm YLDs increased 82·5% and age-standardised rates increased significantly by 8·5%. However, within the category of neoplasms, significant declines were noted for stomach cancer, liver cancer due to alcohol use, liver cancer due to other causes, larynx cancer, cervical cancer, nasopharynx cancer, gallbladder and biliary tract cancer, and bladder cancer. Significant increases were noted for liver cancer due to hepatitis C, breast cancer, prostate cancer, colon and rectum cancer, pancreatic cancer, non-melanoma skin cancer, kidney cancer, thyroid cancer, non-Hodgkin lymphoma, and other neoplasms. Of note, there was no significant change in the trachea, bronchus, and lung cancer age-standardised rates. YLDs for cardiovascular diseases overall increased 89·2%, but age-standardised rates did not change significantly. Among cardiovascular causes, age-standardised YLD rates declined significantly for atrial fibrillation and flutter and peripheral vascular diseases. By contrast, age-standardised rates increased significantly by more than 5% for hypertensive heart disease and cardiomyopathy and myocarditis.
Numbers of YLDs from chronic respiratory diseases increased from 1990 to 2013 by 55·1% but age-standardised rates remained stagnant (table 10). Overall cirrhosis age-standardised prevalence and YLD rates declined, although for cirrhosis caused by hepatitis C the change was not significant. Among the digestive diseases, gastritis and duodenitis, appendicitis, inguinal, femoral, and abdominal hernia, gallbladder and biliary diseases, and other digestive diseases increased in absolute terms but declined in age-standardised rates. By contrast, inflammatory bowel diseases, paralytic ileus and intestinal obstruction, and pancreatitis increased in numbers and rates. YLDs from neurological disorders, as a group, increased 59·6%, but age-standardised rates increased by only 5·0%. There was no change in age-standardised rates for Alzheimer’s and other dementias but YLD numbers increased by 91·8%. The age-standardised rates of Parkinson’s disease and primary epilepsy increased but not significantly, consistent with the consideration that they are largely genetically determined. YLDs from multiple sclerosis increased in age-standardised rates and numbers. It is not clear whether this increase in rates was due to improvements in case ascertainment or indicates a true increase in disease prevalence. Among the headache disorders, only medication overuse headache had a significant change in rates of 43·3%.
Overall, the YLDs for mental and substance use disorders increased 45·0% from 1990 to 2013, but there was only a 1·0% increase in the age-standardised rate (table 10). For all disorders in this group, including autism, Asperger’s syndrome, anorexia nervosa, and bulimia, there were increases and decreases in age-standardised rates of less than 10%. Diabetes mellitus YLDs increased by 135·7%, but age-standardised rates increased only 43·4%. By contrast, chronic kidney disease YLDs increased 49·5% but rates declined by 2·8%. Patterns in age-standardised rates were different between specific causes of chronic kidney disease with an increase in chronic kidney disease due to diabetes but a reduction in chronic kidney disease due to hypertension and glomerulonephritis. Among urinary diseases, the increase in numbers and age-standardised rates for urolithiasis was notable. For most gynaecological diseases, numbers increased, but the changes in age-standardised rates were small; the category uterine fibroids was an exception with a reduced rate and only a small increase in numbers.
YLDs for the large category of musculoskeletal disorders increased by 60·7%, but there was no change in the age-standardised rate (table 10). The only exception to this general pattern was rheumatoid arthritis for which age-standardised rates declined significantly by 4·6%. YLDs due to congenital disorders, as a group, increased 61·4% and age-standardised rates by 19·7%. These large increases in numbers and age-standardised rates were noted for all congenital causes except Klinefelter’s syndrome, for which the rate did not increase significantly. The reason for the large increases in prevalence and YLDs was the improved survival because birth prevalence for congenital disorders remained stable or declined (data not shown). Although skin diseases, as a group, did not show a significant pattern for age-standardised YLDs, some causes including cellulitis, bacterial skin diseases, and decubitus ulcer declined significantly. Most causes of vision and hearing loss included in the sense organ category increased in absolute numbers of YLDs but the age-standardised rates declined.
Injury age-standardised YLD rates decreased substantially from 1990 to 2013. There were reductions of more than 30% in age-standardised YLD rates for road injuries, drowning, fire, heat, and hot substances, poisoning, venomous animal contact, non-venomous animal contact, and self-harm (table 10).
The main disorders that drove changes in rates varied with age (appendix pp 776–811). In childhood, most infectious diseases and iron-deficiency anaemia showed decreases in YLD rates, whereas neonatal disorders and congenital disorders showed increases, largely due to lower initial case fatality and better long-term survival, and in the case of preterm birth complications an increase in the birth prevalence (data not shown). For ages 15–49 years, large increases from 1990 to 2013 were noted in disability associated with diabetes (appendix pp 776–811), HIV, and medication overuse headache, whereas there were large decreases in the YLD rates of iron-deficiency anaemia, falls, and collective violence. In adults aged 50–69 years, reductions in YLD rates for all injuries (appendix pp 776–811) and increase in diabetes YLD rates were notable.
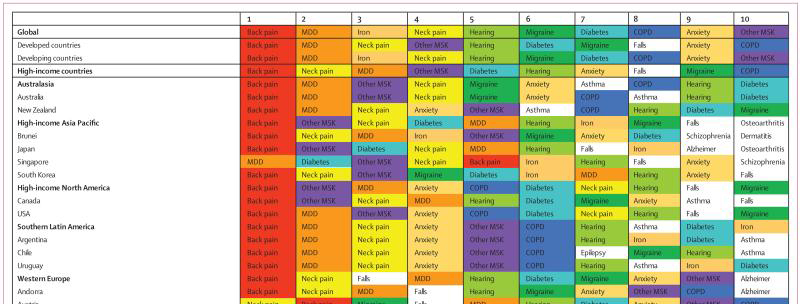
Figure 4 Figure 4 shows the ten leading causes of YLDs for each country. Causes are colour coded by their global rank to emphasise where they vary substantially in the leading set. There was substantial consistency in the top causes. Low back pain and major depressive disorder were among the top ten causes of YLDs in every country. 40 causes were in the top ten list across all countries but only 16 of these causes were in the top ten of more than 20 countries. Low back pain was the leading cause in 45 of 50 developed countries and major depressive disorder was the leading cause in three countries, with neck pain and diabetes leading in one country each. Across developing country regions, there was more variation in leading causes. Low back pain or major depressive disorder was the leading cause in 94 of 138 developing countries. But other causes such as iron-deficiency anaemia, HIV, and war were leading causes in more than one country. Regional patterns emerged such as the more prominent role of falls in central Europe where they were ranked second in 11 of 13 countries. The category other musculoskeletal — which includes disorders such as shoulder problems, pathological fractures from osteoporosis, osteomyelitis, pyogenic arthritis, and systemic lupus erythematous — was prominent in high-income Asia and high-income North America. Anxiety disorders ranked more highly in many Caribbean nations and diabetes was prominent in Mexico, Nicaragua, Panama, and Venezuela. In Oceania, some soil-based helminths were highly prevalent, pushing them into the top five of the YLD rank list. Onchocerciasis, predominantly the onchocercal skin sequela, was ranked highly in Liberia, Cameroon, and South Sudan. The disability from past war and conflict ranked as the top cause of YLDs in Cambodia, Nicaragua, and Rwanda, and number two in Vietnam.
The figure appendix provides an analysis of the change in the YLDs per person from 1990 to 2013 by country and region. The countries were ordered by YLDs per person in 1990. Across countries in 1990, YLDs per person ranged from 0·072 to more than double at 0·170. Generally, developed countries with higher mean age for the population had higher YLDs per person, but there were many exceptions to this pattern. Changes in the YLDs per person were decomposed into contributing causes for YLDs — for convenience these cause groups were chosen to represent the major causes of YLDs at the global level. The figure provides a summary of what causes contributed to increases or decreases in YLDs per person for each country.
From 1990 to 2013, 139 of 188 countries had increases in the YLDs per person. Although the drivers of increased YLDs per person varied by region and country, generally, musculoskeletal, mental, substance use, neurological, and chronic respiratory disorders played important parts across most of the regions and countries. In sub-Saharan Africa, increases were largely driven by HIV/AIDS. Declining levels of iron-deficiency anaemia contributed to a decline in YLDs per person in many countries. In the subset of countries where the overall YLDs per person declined, specific factors such as long-term disability due to war were important factors—most strikingly evident in Lebanon. However, declines due to neglected tropical diseases and malaria, as well as diarrhoea and lower respiratory infections (represented as other communicable diseases in the figure appendix) also pushed YLD per person lower in some countries. Mostly increasing YLDs per person meant that by 2013 the range across countries was from 0·076 to 0·153. It is important to note that the figure appendix shows YLDs per person and not age-standardised YLD rates; therefore, changes in YLD rates were affected by changes in population age structure and changes in age-specific disease rates.
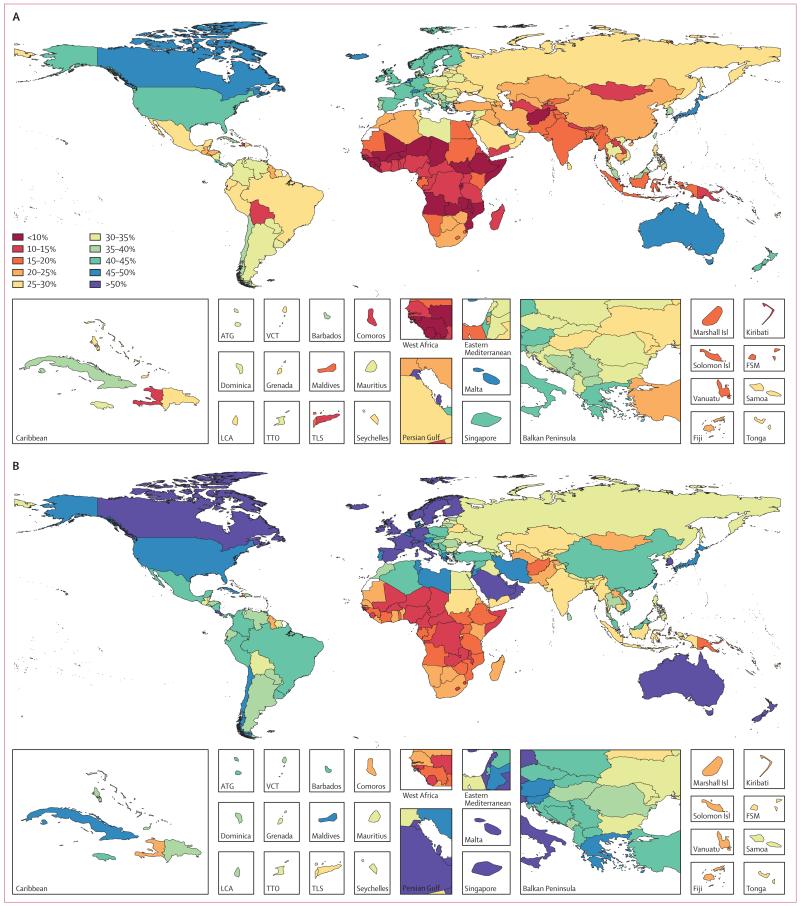
Figure 5 From 1990 to 2013, YLDs per person rose in most countries and YLLs per person declined. Both trends led to a shift towards greater disability as a share of the overall burden. Figure 5 shows the shift from 1990 to 2013 towards greater disability as the ratio of YLDs to YLDs plus YLLs76 (namely disability-adjusted life years [DALYs]). 30 countries as of 2013 had the most DALYs due to YLDs, representing a major change from historical patterns of premature mortality being the dominant set of health issues. In 1990, premature mortality still represented more than half of DALYs in every country. By 2013, the lowest YLD to DALY ratio outside of sub-Saharan Africa was in Afghanistan, but most developing countries outside of sub-Saharan Africa had ratios of greater than 35%. In sub-Saharan Africa, however, the ratio of YLDs to DALYs ranged from 10·4% in Mali to 38·9% in Cape Verde.
Discussion
We analysed more than 35 620 epidemiological sources from 188 countries spanning the past three decades to provide the most up-to-date empirical assessment of the leading causes of acute disease incidence, chronic disease prevalence, and YLDs for 6 years (1990, 1995, 2000, 2005, 2010, and 2013) for 188 countries using consistent and comparable methods. Importantly, our study provides the first comprehensive assessment of the extent, pattern, and trend of non-fatal health loss in countries, with important implications not only for health policy, but also for the provision and financing of health services (panel).
A wide array of disease and injury sequelae affects the world’s population. Globally, only 4·3% of the population had no burden of disease or injury sequelae in 2013, up slightly from 4·2% in 1990. There were 59 diseases and injuries with a global prevalence of greater than 1%, but each caused little disability. These disorders comprised various causes of mild to moderate vision impairment, hearing loss, soil-transmitted helminths, mild anaemia, caries, and many others. For many of these common but fairly mild disorders, there are effective interventions. [89–92] The GBD provides several insights into the health of different populations by quantifying the prevalence of a wide range of disorders and YLDs that take into account the general public’s view of severity.
Of the 240 GBD causes that led to mortality, Naghavi and colleagues76 reported that global age-standardised death rates were declining by 80%. For YLDs, the distribution of causes where age-standardised rates were declining, stagnant, or increasing was different. For 140 causes, distributed across communicable diseases, non-communicable diseases, and injuries, age-standardised rates declined significantly from 1990 to 2013. For 89 causes, changes in age-standardised rates were statistically indistinguishable from zero over the same period. For 72 causes, including epidemic disorders like HIV and dengue but also cancers, diabetes, and COPD, age-standardised rates increased significantly. Of 301 causes, the percentage change in the age-standardised rate for YLDs was higher than the percentage change in the age-standardised YLLs for 213 causes. Divergence in rates for diseases and injuries between mortality and morbidity could be because of reductions in case-fatality rates due to treatment or improved background risks such as malnutrition. To the extent that mortality is declining faster than disease prevalence due to treatment, access to care might be a crucial driver of trends in health. The mortality–disability temporal disconnect, however, is further evidence of the importance of paying attention to trends in disease incidence, prevalence, and YLDs and not simply focusing on mortality. Diabetes is an important example in which age-standardised prevalence rates increased 43% while death rates increased only 9%. Stagnant or increasing age-standardised rates combined with rising mean age of the world’s population implies substantial future increases in burden from these causes. The documented shift in many developed and developing countries to a larger fraction of DALYs due to YLDs is another manifestation of this global shift. Despite the evidence for this shift, global health policy discussion remains focused mostly on premature mortality. For example, in the Sustainable Development Goals Open Working Group proposal [93] with 13 targets for the health goal, only one on narcotic drug abuse and harmful use of alcohol was focused on a disability.
Although the general pattern of the past 23 years has been for infectious disease mortality and morbidity, measured through incidence or prevalence, to decline, there are some very notable exceptions that stress that such trends are not inevitable with rising income per person and educational attainment. Compared with 1990, both HIV and malaria YLDs increased in 2013. More careful examination of our estimates for the six periods shows that malaria and HIV YLDs have been declining since at least 2005. Increases for dengue (nearly 450%) and for cutaneous and mucocutaneous leishmaniasis have continued throughout the period. Increases in dengue have been ascribed to the rise of breeding sites for the mosquito vector in urban and periurban areas. [94] Increases for cutaneous leishmaniasis have been related to the expansion of previously non-endemic areas as a result of urbanisation and deforestation with domestic animals as potential reservoirs. Additionally, economic hardship, natural disasters, armed conflict, movement of seasonal workers, development of new projects, and bringing non-immune labour forces into endemic areas are contributing causes. Also, pressure on populations throughout the world is pushing migration into areas where the infection is endemic, thereby bringing many more humans into contact with the natural vectors and resulting in increased infection rates. [95–98] These counter trends for infectious diseases are a reminder that active surveillance of infectious diseases at a fine-grained geospatial level are essential to detect changes that might run against the general trend towards lower rates.
The GBD 2010 reported that the burden of musculoskeletal disorders was much larger than previously appreciated. [7, 8, 19, 20, 37, 38] In this analysis, we show that musculoskeletal disorders ranged from 9·6% of YLDs to 28·9% of YLDs between 188 countries. Low back pain was the leading cause of YLDs in 86 countries and the second or third leading cause in 67 countries. Although the GBD 2010 analysis brought more attention to these disorders, there remains little policy discussion of the options available to address and prevent these disorders. [1, 99] From a health service point of view, it is important to note that there is a connection between the injury analysis of fractures and soft tissue injury and musculoskeletal disorders. We estimated 22 million YLDs from fractures, most of which were long-term disabilities. Most of the individuals afflicted would present with a musculoskeletal chief complaint in surveys and therefore to avoid double counting we subtracted the long-term disability from fractures and dislocations out of the estimates of the category of other musculoskeletal disorders. Musculoskeletal disorders combined with fractures and soft tissue injuries reached a total of 20·8% of global YLDs in 2013; across countries this total ranged from 10·8% in Mali to 30·0% in South Korea. Our analysis of time trends showed that this category of disorders was an important driver of rising YLD rates per person. Increases were driven by ageing of the population in most countries with trends in obesity and physical inactivity likely exacerbating the problem. [100, 101] Musculoskeletal disorders were not only an important contributor to the burden of disease but were also a crucial component of health expenditure in many high-income and middle-income countries. [102–106]
Mental and substance abuse disorders accounted for 21·2% of YLDs, ranging from 15·4% in Germany to 36·7% in Qatar. Major depressive disorder was a crucial contributor in developed and developing countries alike: it is the leading cause of YLDs in 56 countries, the second leading cause in 56 countries, and the third in 34 countries. Although major depressive disorder, anxiety disorders, schizophrenia, and bipolar disorder are leading causes in nearly all countries, there is much greater country variation in substance use disorders including alcohol. YLDs from alcohol use disorders ranged from a high of 2·9% in Russia to a low of 0·3% in Iran; YLDs from drug use disorders ranged from a high of 13·5% in Qatar to a low of 0·6% in Slovenia. New data in the GBD 2013 suggested that Iran and Afghanistan had particular problems with opioid dependence. The GBD 2013 analysis confirmed that common mental disorders had well established sex patterns in most countries: higher rates in women for major depressive disorder and anxiety and similar rates for bipolar and schizophrenia for men and women. Treatments if widely and appropriately deployed could lead to substantial reductions in the burden of these disorders; some studies suggest that up to half of YLDs could be averted in some countries. [1, 107, 108] As new studies accumulate on the role of childhood sexual abuse, intimate partner violence, non-sexual child abuse, and bullying, the possibility of prevention programmes is increasing. [109–113] Systematic quantification of these risks will help establish where prevention programmes could be developed and tested.
For the first time in the GBD studies, we provide a systematic quantification of the geographical and temporal coverage of the input epidemiological data for nearly all sequelae. For several diseases with sequelae representing different levels of severity such as major depressive disorder (mild, moderate, and severe sequelae), the data representativeness metrics show there are often more data for overall disease prevalence than for determining the distribution of severity for a cause. Sequelae with the highest DRI tend to be those where administrative data such as notifiable disease reporting or hospital discharge data can be corrected for completeness or selection bias, or both. For some sequelae, such as drug use disorders only one study was available to ascertain the distribution of cases by level of severity. Despite attempts to quantify uncertainty from various sources in the estimates (see limitations below), it is highly likely that for sequelae with low DRIs uncertainty might be larger than estimated. At the global level, 12 of the top causes of YLDs had a DRI of less than 0·25. Priorities for further data collection in a country might usefully be informed by comparison of the estimated YLDs and the DRI for the country for each cause. Examining countries, the fraction of sequelae with any data available in a country, shows marked variation across countries within a region or within income group—eg, Nigeria with a DRI of 47% and Mauritania at 10% or the UK at 81% and Greece at 52%. Our computation of the DRI was based on the data available to the GBD through published studies or reports, publicly released datasets, and unpublished data. In view of our experience in China and Mexico with subnational burden of disease estimation, it is likely data coverage could be improved through detailed national burden of disease studies, which often lead to several unpublished sources. Ministries of health and national statistics authorities in countries with low coverage should carefully assess which high burden disorders with low data availability would benefit from new data collection efforts.
With each iteration of the GBD, the cause and sequelae list has expanded. Expansion involves taking an existing cause and splitting it into more detailed component causes—eg, eating disorders were broken down into anorexia nervosa and bulimia. Residual categories, such as other mental disorders, other neurological disorders or other musculoskeletal disorders contain many rarer causes and some common causes that have very low levels of disability. One of the key values of the GBD was the comprehensive and systematic nature of the analysis; it is likely that in future iterations based on health service use data or new epidemiological studies or policy demand, the cause and sequelae list will be expanded further. The GBD cause list, even in the current expanded form, still has only 301 causes compared with the 11,299 four-digit ICD-10 codes. The GBD cause list provided a more manageable public health and health service planning focused approach to the complexity of disease coding. The sequelae list also had many potential applications, such as facilitating the mapping of data collected through different studies and typologies into a common framework.
For GBD 2013, the study benefited from use of a larger computational cluster than for GBD 2010 (22 teraflops compared with 8 teraflops). The optimised recoding of DisMod-MR 1.0 to DisMod-MR 2.0, combined with greater computational capacity, allowed us to generate country-specific posterior estimates for incidence, prevalence, remission, and excess mortality for each of the six periods. We estimated and reported internal validity of different models and conducted cross-validation studies for ten of the models. We believe DisMod-MR 2.0 is a substantial improvement over DisMod-MR 1.0, but there is still much opportunity to improve these data synthesis programs in the future. In particular, work is underway to develop the next iteration of DisMod-MR that would allow for variation of incidence, remission, excess mortality rates simultaneously over age, geography, and time unlike the present approach, in which variation in rates over time is captured by independent estimation of the available data for six different periods. Despite progress in the estimation software, a fundamental challenge in epidemiological synthesis of sparse and heterogeneous data is distinguishing between true variation in the underlying rates and study heterogeneity due to variation in, for example, case definitions, assays, instruments, and sampling frames. DisMod-MR 2.0 allows explicit modelling of these factors, but true resolution of this challenge requires more data to be collected with consistent definitions and study design.
The comorbidity microsimulation for each country–age–sex–year has been used to both quantify comorbidity and allocate to contributing causes of each disability weight. By weighting each country–age–sex–year microsimulation by the true population in each age group, we have created a working model of individual health for all 7·3 billion individuals in the world consistent with the entire GBD non-fatal health outcome results. With future iterations of the GBD, we intend to incorporate data for risk factors into the global microsimulation providing an even more comprehensive working model of each country’s population. This global and national microsimulation has many potential applications from inequality measurement to comprehensive forecasting of multiple interventions. For example, the GBD microsimulations provide an ideal environment for modelling the effect of interventions that would represent the complex interplay between disorders that is often missing in many intervention impact assessments. The distribution of functional health status across individuals in each country for different timepoints can also be used to compute measures of individual inequality in functional health. If the correlations between socioeconomic indicators within each country–age–sex–year group with health outcomes and risk factors can be estimated, then the microsimulation environment could also be used to look at the relation between health and income inequality.
Disability weights through the inclusion of new data from national surveys in Italy, Hungary, Sweden, and the Netherlands and revisions in lay descriptions for selected health states have changed from those used in the GBD 2010. The severe hearing loss disability weight increased from 0·05 to 0·18 with similar increases for profound hearing loss and deafness. Through the inclusion of incontinence in the lay descriptions for spinal cord lesion below the neck, the disability weight increased from 0·047 to 0·296. These findings draw attention to the importance of the exact wording of lay descriptions for use in population surveys. We revised lay descriptions in the latest round of data collection based on commentary in the literature and a careful review of all lay descriptions checking for symmetry and consistency. We believe that future iterations of the GBD will benefit from further data collection and vigorous scrutiny and debate by the scientific community of the exact lay descriptions in use—the full listing is provided in the appendix pp 688–93 and further details are provided in Salomon and colleagues. [85] In many countries undertaking subnational burden of disease studies, there may be opportunities to collect further disability weight data using the latest iteration of the GBD lay descriptions and measurement protocol. Such data would help establish whether there was any notable national variation in disability weights from the global average and strengthen the global empirical database for disability weight measurement.
Another important component determining average disability weight was the empirical analysis of the distribution of severity controlling for comorbidity. The number of studies or data sources that allowed for teasing apart functional health limitations from a particular cause from other comorbid causes were few. Very low DRIs for many sequelae in table 1 document this limitation. More datasets like the US MEPS that include both functional health limitation measurement and ICD-coded diagnoses would be extremely helpful in strengthening the empirical assessment of severity controlling for comorbidity. This must be regarded as one of the most important data gaps for the quantification of many chronic disorders.
Because the GBD 2013 has re-estimated prevalence and YLDs for all disease and injury sequelae for 1990, 1995, 2000, 2005, 2010, and 2013, we can compare the results of GBD 2013 directly with GBD 2010. The leading global causes of YLDs estimated for 2010 in this study (low back pain, major depressive disorder, iron-deficiency anaemia, neck pain, and age-related and other hearing loss) were similar to those reported in GBD 2010 (low back pain, major depressive disorder, iron-deficiency anaemia, neck pain, and COPD) for 2010. For 97 diseases or injuries, global YLDs from GBD 2013 for 2010 were significantly different from the GBD 2010 estimates for 2010. For 27 diseases and injuries, there were changes in YLDs greater than 30% but these changes were not significantly different from GBD 2010. Generally, changes stemmed from the inclusion of new data, exclusion of studies used in GBD 2010 due to changes of inclusion criteria for each sequela that emerged through the process of replicating many GBD 2010 systematic reviews, the shift to DisMod-MR 2.0, which reduced the effect of large sample size outlier studies, changes in covariates, changes in disability weights, or changes in severity distributions. The appendix pp 33–54 provides a more detailed account for each of these cases including changes in inclusion criteria where relevant. At the level of global YLDs, the most notable effect of these changes was the inclusion of age-related and other hearing loss in the top ten causes of global YLDs; this change was almost exclusively due to the revision of the hearing loss disability weights. The yearly updating cycle for GBD provides a much more rapid cycle for incorporating new data and scientific feedback from GBD collaborators and the broader scientific community. We expect that with each iteration there will be important changes driven by the collection and release of new data, but that the number of changes driven by uncovering older studies, exclusion of older studies on quality grounds, or changes in modelling strategy will tend to get smaller with each iteration.
A study of this scope has several limitations, many of which were detailed in the GBD 2010 analysis. [1] Here we focus on selected major limitations that are not specific to the data sources or analysis of a specific sequela. First, for comorbidity simulation to work effectively, especially with the assumption of independence, individuals with a disease need to be uniquely mapped to a single sequela. For some diseases that have several distinct functional impairments such as motor and cognitive dysfunction for some neonatal disorders, several combinations are possible. In some cases, to map all of the possible combinations was not feasible because of increased computational load and the lack of epidemiological data to accurately describe these combinations. In a very small number of cases, we did not follow the principle of mapping one individual to a unique sequela including schistosomiasis, lymphatic filariasis, and onchocerciasis.
Second, a major limitation that might affect many sequelae is that important unpublished data sources might be missing. The collaborations with investigators in Mexico, China, and England to generate subnational burden of disease estimates for 2013 identified unpublished data sources or more detailed age and time breakdowns for published studies. Other countries are likely to have similar data sources, which after being identified could enrich the estimation of the burden of disease for a country.
Third, in this analysis of prevalence and YLDs, we attempted to capture uncertainty from model estimation and available data but 95% uncertainty intervals might be too narrow because we cannot capture uncertainty that comes from the possibility that countries with data might in some way be different for a given sequela from countries with data. Further, unlike the GBD analysis of causes of death, we do not capture uncertainty that comes from model specification. We undertook cross-validation studies for a few models but the move to using out of sample validity testing to then create ensembles of good models will require further advances in computational speed of DisMod-MR to make this viable.76
Fourth, for GBD 2013 we made a substantial effort to enhance the transparency in all aspects of the estimation. In GBD 2010, in some cases contributors who undertook systematic reviews provided results but without study references. For GBD 2013, we have included in the Global Health Data Exchange 31,950 citations with metadata covering essentially all sources used in any aspect of this analysis. We have provided more detail about modelling strategies and internal validity of model fits. In view of the complexity of the GBD analysis spanning so many sequelae, estimation requires a tremendous investment across the network of collaborators measured in person-years. Replication of the entire effort was possible but would have required many resources and negotiated access to the few datasets provided to the GBD through data use agreements that are not in the public domain. With the public release of the Epi Viz tool, everyone will be able to examine the specific studies and datapoints used for each disease sequela and the model fit. To further satisfy the reasonable scientific curiosity of academics about particular sequelae, the GBD collaborators remain committed to answering detailed questions about all steps of the analysis and many disease-specific publications will follow in which much greater detail of the modelling assumptions and data for each sequela can be provided.
Fifth, when data for a sequela are collected using different definitions, assays, or instrument items, we have cross-walked between these differences using fixed effects in the meta-regressions. For example, in the DisMod-MR 2.0 model for major depressive disorder, the coefficient for symptom scale measures as opposed to a diagnostic interview schedule was 0·83 (95% uncertainty interval 0·64–1·04) in log space and 2·30 (1·90–2·83) after exponentiation. By dividing symptom scale prevalence datapoints by 2·3, we predicted the corresponding values for the reference case. Another example of an important cross-walk was between data for opioid dependence from household surveys and the more inclusive estimates from triangulation of data from treatment centres, needle exchange programmes, and the justice system.9 DisMod-MR 2.0 estimated a coefficient of 0·31 (0·15–0·74) after exponentiation indicating the household survey prevalence was an underestimate by more than a factor of three. Several factors could account for this large difference including lack of a steady residence, lower response to surveys, and fear of reprisals for admitting to illegal behaviours. [114] We used a similar covariate for triangulated data for cocaine and amphetamine dependence but did not note systematic bias compared with household survey data. There is no equivalent approach to address the potential bias from non-response to surveys or the effect of stigma on responses for cannabis and alcohol dependence. In the DisMod-MR 2.0 model of alcohol dependence we use several study characteristics such as the type of survey and the measurement questionnaire. A review of Chinese studies on alcohol dependence showed that variation in prevalence between studies was strongly related to such study characteristics. [115] Of particular interest in the Chinese review was the finding that large surveys often rely on proxy reporting for absent household members to improve the response rate and that these surveys tend to underestimate the prevalence of alcohol dependence. Although there is substantial evidence for stigma and alcohol dependence, there was no quantification of the magnitude and direction of the bias on population prevalence estimates, probably because a gold standard measurement that would be unaffected by stigma is difficult to define. [116–118] Experience in the GBD 2013 compared with GBD 2010 shows that these fixed-effect coefficients for study level characteristics can be substantially affected by the inclusion of new data sources. For large cross-walks, new data in one country can alter results in many other countries. This sensitivity of statistical cross-walks in models with sparse data draws attention to the value of standardising case definitions, assays, and instruments in future data collection. The comprehensive nature of GBD provides an opportunity to identify what is the reference case approach to measurement with the current knowledge for each sequela. We plan to summarise our assessment of best practice for each sequela in a future publication.
Sixth, in models using DisMod-MR 2.0 or natural history models, the associations between incidence, remission, excess mortality, prevalence, and cause-specific mortality are modelled simultaneously. However, if there are no models for the age pattern and level of excess mortality across countries, simultaneous estimation does not ensure any correlation in the age-specific rates of prevalence and cause-specific mortality across countries. In this iteration of the GBD, we have devoted much more attention to this estimation challenge by incorporating into many models more direct information about the credible range of excess mortality across age, sex, and country. However, country variation in excess mortality has not been as extensively debated in the literature about burden of disease estimation as it has for incidence, prevalence, or causes of death. More attention to these associations and the determinants of excess mortality such as access to care will be beneficial in future iterations of the GBD.
Seventh, comorbidity simulation, used for quantifying the burden of disease and undertaking intervention analysis, has a major limitation, namely that we assume that within a country–age–sex–year group prevalence values are independent. For some disorders such as diabetes and ischaemic heart disease or anxiety disorders, depression, and alcohol dependence, we expect probabilities are dependent. Empirical assessments [119, 120] of comorbidity tend to show that age is the dominant driver of comorbidity, ignoring dependent comorbidity, for example in the MEPS data, leads to minimal errors in estimated burden. [1] Incorporating dependent comorbidity into the microsimulation environment is not technically challenging; the issue is that there are insufficient data to generally estimate the age-specific correlation matrix of all 2337 sequelae. As compelling and albeit incomplete evidence on dependence accumulates, we intend to incorporate this into the comorbidity simulation microsimulations.
Eighth, in the current version of DisMod-MR 2.0, we were unable to incorporate estimates of the subnational units for China, Mexico, and the UK as a fifth level in the estimation cascade (figure 2). Instead, subnational units were modelled as though they were independent countries. If data were sparse, that meant that subnational units might borrow strength from the regional estimate rather than the country estimate. In some cases, when only national data were available, we used these data for each subnational unit after dividing the effective sample size of each datapoint by the number of subnational units to avoid overemphasising the national data used in each unit in the overall estimation. A fifth level of the cascade will be added in the next version of DisMod-MR.
Ninth, there was a steady drop in the age-standardised rates of YLDs for all injury categories between 1990 and 2013. For the unintentional injury categories, with the exception of falls, the steady drop was partly driven by a downward trend in case fatality rates accompanied by a drop in incident cases. The larger change affecting the downward trend in YLD rates was related to the difference between disability with and without treatment. In the absence of robust national data for the injury treatment rates, we have assumed access to treatment scales according to the indicator health system access. [76] The health system access indicator was based on a principal component analysis of coverage of mostly maternal and child health interventions and health system infrastructure. There have been steady global improvements in health system access as captured in this indicator reducing the estimated injury YLDs.
Tenth, substantial efforts have been made in the data preparation and analysis to address issues of ascertainment bias that might affect trends. In another example of dealing with ascertainment bias we cross-walked between diagnostic assays from creatine kinase-myocardial band enzymes to troponins for the detection of acute myocardial infarction. Despite these efforts, there are some upward trends that might still relate to residual issues of ascertainment including multiple sclerosis and prostate cancer.
Eleventh, in a study with more than half a million YLD estimates generated from sometimes sparse and always disparate data sources there remain areas where additional evidence or a change in the modelling strategy could lead to better estimates. Yearly updates of GBD allowed for a continued effort to search for new data and improve methods, particularly for disorders with sparse data or inconsistencies between data sources. We are already compiling a list of issues to address in the next iteration. For example, with our collaborators in Qatar, we are searching for data to verify the high YLD estimate for opioid dependence, which in the models is affected by data from studies in Iran and Afghanistan. In other cases, further data for the clinical severity associated with paragonimiasis would help determine the relevance of the health state used to select the disability weight for this sequela. Generally, we will search for additional evidence of the severity of all disorders for the next iteration of GBD.
Despite the limitations, the implications of our findings are substantial. By extending the GBD analysis to report the commonly understood measures of morbidity and disability in populations, by age, by sex, by country, and over time, this study represents an enormous resource for national, regional, and global policy debates about health priorities, not just to keep people alive well into old age, but to also keep them healthy. Without this health intelligence, large, preventable causes of health loss in populations, particularly mental and behavioural disorders and serious musculoskeletal disorders, have thus far not received the attention that they deserve in national health debates.
The GBD 2013 covers a comprehensive, exhaustive, and mutually exclusive set of causes and their sequelae at the country level over 23 years. By shifting to a process of yearly updating, the GBD provides a rapid mechanism for incorporating new data, development of methods, and new insights into old data or disease mechanisms. By steadily increasing the transparency of input sources, documenting in detail the methods used, sharing crucial code such as DisMod-MR 2.0, and facilitating online exploration of new results using dynamic data visualisations, we believe GBD can progressively become a means for global health surveillance, not just for mortality but also for reducing health loss among populations everywhere. As a group of investigators, we seek to accommodate within the GBD framework epidemiological debate about each cause, and based on scientific principles, describe the functional health of all individuals in the world. Studies such as this provide the important comprehensive, comparative, and consistent evidence to guide policy and practice, evidence that will become progressively more reliable as more data and information are identified and included as part of the global collaboration.
Panel: Research in context
Systematic review
The GBD 2013 assessment of morbidity is a major improvement in the evidence base compared with GBD 2010 through the inclusion of new data from surveys, disease registries, and hospital inpatient and outpatient registrations. GBD 2013 also benefits from improvements in the Bayesian meta-regression tool DisMod-MR. The fifty-fold increase in computational speed allowed consistent estimation of prevalence and incidence for each country and time period.
Interpretation
This study provides a comprehensive description of morbidity levels and patterns worldwide. Because the study provides a complete re-analysis of trends for each cause from 1990 to 2013, it supersedes the results of the GBD 2010 study. This is the first time that country-specific results for all 188 countries with populations of more than 50 000 people have been comprehensively published. In all countries, the share of disability in total burden is increasing because of ageing populations and a slower decline in disability rates compared to the decline in mortality.
References:
Return to GLOBAL BURDEN OF DISEASE
Since 9-07-2019
| Home Page | Visit Our Sponsors | Become a Sponsor |
Please read our DISCLAIMER |