

Cut-off Points for Mild, Moderate, and Severe Pain
on the Visual Analogue Scale for Pain in Patients
with Chronic Musculoskeletal PainThis section is compiled by Frank M. Painter, D.C.
Send all comments or additions to: Frankp@chiro.org


FROM: Pain 2014 (Dec); 155 (12): 2545–2550 ~ FULL TEXT
Anne M Boonstra, Henrica R Schiphorst Preuper, Gerlof A Balk, Roy E Stewart
Revalidatie Friesland Centre for Rehabilitation,
Beetsterzwaag, The Netherlands.
The aim of this study was to find the cut-off points on the visual analogue scale (VAS) to distinguish among mild, moderate, and severe pain, in relation to the following: pain-related interference with functioning; verbal description of the VAS scores; and latent class analysis for patients with chronic musculoskeletal pain. A total of 456 patients were included. Pain was assessed using the VAS and verbal rating scale; functioning was assessed using the domains of the Short Form (36) Health Survey (SF-36). Eight cut-off point schemes were tested using multivariate analysis of variance (MANOVA), ordinal logistic regression, and latent class analysis. The study results showed that VAS scores ≤ 3.4 corresponded to mild interference with functioning, whereas 3.5 to 6.4 implied moderate interference, and ≥ 6.5 implied severe interference. VAS scores ≤ 3.4 were best described for patients with chronic musculoskeletal pain as mild pain, 3.5 to 7.4 as moderate pain, and ≥ 7.5 as severe pain. Latent class analysis found that a 3-class solution fitted best, resulting in the classes 0.1 to 3.8, 3.9 to 5.7, and 5.8 to 10 cm. Findings from our study agree with those of some other studies, although many other studies found different optimal cut-off point schemes. As there appear to be no universally accepted cut-off points, and in view of the low-to-moderate associations between VAS scores and functioning and between VAS and verbal rating scale scores, the correct classification of VAS scores as mild, moderate. or severe in clinical practice seems doubtful.
Keywords: Chronic pain; Musculoskeletal pain; Verbal rating scale; Visual analogue scale.
From the FULL TEXT Article:
Introduction
Assessment of pain intensity is considered to be 1 of the core outcome domains in clinical pain research. [21] Pain intensity is therefore widely assessed. [8] Pain intensity is often measured with a self-report single-item measure such as a visual analogue scale (VAS), numeric rating scale (NRS), or verbal rating scale (VRS). [8] An advantage of VAS and NRS is that these scales tend to approximate ratio-level scales for groups of patients [16, 19], allowing parametric tests to be used in statistical analysis. The VAS and NRS have been found to be more sensitive than the VRS when 4 or fewer categories were used in the VRS. [3] However, estimating pain intensity with the VAS or NRS requires the ability to transform a subjective experience into a visuospatial display or numbers, and this ability may influence the results. The advantage of VRS is that mild, moderate, and severe are categories often used in communications between patient and health care provider in clinical practice. [4]
However, translating continuous measures such as VAS and NRS into discrete categories such as VRS is not straightforward. Simply dividing a VAS or NRS into equal parts and using these for the comparison with VRS scores is not a valid method. [6, 27] Serlin et al. [20] tried to solve this problem by comparing pain intensity with the impact of the pain on daily functioning, using a specific statistical technique for patients with pain due to cancer. Their statistical technique has been repeated in the same patient population, that is, cancer patients [18], as well as in other patient populations, for example, patients with subacute low back pain [13, 22, 28], diabetic peripheral neuropathy [29], and spinal cord injury. [11] The cut-off points on scales derived from the association between pain intensity and functioning, however, is a matter of interpretation rather than being based solely on the perception of pain. Although moderate to high correlations have been found between NRS, VAS, and VRS scores, there is large variation in individual scoring. [3, 27] The individual differences may be caused by the fact that words have various nuances of meaning, and ratings of pain intensity may differ greatly from 1 person to the next. A newly emerging method to distinguish classes in scores for a specific construct scored with a VAS—in our case, pain—is that of latent class analysis. Latent class analysis [26] is based on the assumption that chronic musculoskeletal pain (complaints) measured with a VAS can be represented by a model in which patients are divided into a number of groups. The average VAS scores differ across groups and are randomly distributed within groups. The groups are called latent classes because group membership is not directly observed. As far as we know, latent class analysis has not yet been applied to VAS scores.
The aim of our study was to identify the cut-off points on the VAS using the above-mentioned 3 methods, and to compare the results. We chose the VAS as the measure to score pain intensity, as it is commonly used in clinical practice.
Methods
Patients
Patients with chronic musculoskeletal pain admitted to the ‘Revalidatie Friesland’ Rehabilitation Centre (the Netherlands) were included in the study. Revalidatie Friesland offers in-patient treatment in 1 department, and outpatient treatment in 5 rehabilitation departments of hospitals in the northern region of the Netherlands. It offers multidisciplinary treatment for patients with pain-related disabilities of a wide range of complexity. The majority of patients have back or neck pain, fibromyalgia, or widespread pain. The area where the Centre is situated, in the northern Netherlands, is partly rural and partly industrialized, with medium-sized towns. The study sample consisted of patients who were participating in a research project to assess the outcomes of rehabilitation at the ‘Revalidatie Friesland’ Rehabilitation Centre. The present survey was added to the outcome study after it had been underway for some years. The study included patients treated between April 2008 and December 2011. Patients were included at the beginning or immediately after their treatment, and 1 year after treatment. Inclusion criteria were: age >18 years, pain due to musculoskeletal problems that had been present for >3 months, and having been admitted to or being treated in a rehabilitation program. Exclusion criteria were inability to understand the questions in Dutch, current major psychiatric disorder (eg, active psychosis, severe depression with risk of suicide attempt, addiction), unwillingness to provide data for research purposes, and a score of ‘‘no pain’’ on the VAS and VRS (see Section 2.2, Measurements). The first assessment in the outcome study, using questionnaires, was done just before the start or during the first 2 weeks of treatment; the second assessment was done in the last week of treatment or during the first 4 weeks after the end of the treatment; and the third assessment was done 12 to 18 months after the end of treatment. The present study used the first questionnaire received from each patient within in the study period. A total of 466 patients returned at least 1 questionnaire within the study period (estimated response rate, 60%). Eleven patients had missing data on at least 1 essential question, and 4 patients had a score of ‘No pain’ on the VRS and a score <5 on the VAS (for all 4 patients, this concerned the questionnaire sent after 1 year). Five patients did not give permission to use their data for research purposes. Thus, a total of 456 patients were included in the analysis.
Measurements
The following characteristics were assessed using a selfconstructed questionnaire: age, gender, marital status (married or living together; single), educational level (8 levels, from primary school to university level) and duration of current pain. Missing data from patients were supplemented, insofar as possible, with data retrieved from the medical files.
The VAS for pain consists of five 10-cm lines, the left end labeled ‘No pain’ (0 cm) and the right end ‘Very severe pain’ (10 cm). Patients were asked to draw a vertical mark on the top line for their current pain, on the second line for their average pain during the last week, on the third line for their worst pain in the last week, on the fourth line for their lowest pain level in the last week, and on the fifth line for their average pain during the last 4 weeks.
Interference with daily life functioning was assessed using the domains of the Short Form (36) Health Survey (SF-36). [1] This instrument consists of 36 questions, relating to 8 dimensions: physical functioning, social functioning, physical role restriction, emotional role restriction, mental health, vitality, pain, general health, and health change. Scores range from 0 to 100 for each dimension, with a lower score indicating more disability or more pain. In view of our study aims, we used only the domains of functioning (ie, physical functioning, social functioning, physical role restriction, emotional role restriction, mental health, and vitality) as parameters to assess interference with daily life functioning.
The VRS we used was the seventh question in the SF-36 [1], which asks about the average pain level during the last 4 weeks, with answering options of none, very mild, mild, moderate, severe, and very severe.
Study design
The study was a cross-sectional study within usual care.
Statistical analysis
Descriptive statistics were used for the characteristics of the study sample. Marital status was dichotomized into living alone versus being married or living with a partner, and educational level was trichotomized, with low meaning primary school to lower vocational education, intermediate meaning secondary vocational education, and high meaning pre-university secondary education and higher, including university degree.
Cut-off points on the VAS in relation to interference of pain with functioning
We studied the cut-off points on the VAS in relation to the interference of pain with functioning by means of the statistical method described by Serlin et al. [20] to determine the optimal boundaries for mild, moderate, and severe pain. We used the VAS for the average pain over the last 4 weeks in the models, as the SF-36 also assesses pain and functioning over the last 4 weeks. We classified each patient’s pain intensity rating on the VAS as mild, moderate, or severe using 8 different classification schemes, referred to by the upper values used for the mild and moderate categories, in accordance with other studies, as follows [11, 18, 20]:1. Cut-off point (CP) scheme 3,5 with 1 to 3 classified as mild, 4 to 5 as moderate, and 6 to 10 as severe;
2. CP scheme 3,6 with 1 to 3 classified as mild, 4 to 6 as moderate, and 7 to 10 as severe;
3. CP scheme 3,7 with 1 to 3 classified as mild, 4 to 7 as moderate, and 8 to 10 as severe;
4. CP scheme 4,5 with 1 to 4 classified as mild, 5 as moderate, and 6 to 10 as severe;
5. CP scheme 4,6 with 1 to 4 classified as mild, 5 to 6 as moderate, and 7 to 10 as severe;
6. CP scheme 4,7 with 1 to 4 classified as mild, 5 to 7 as moderate, and 8 to 10 as severe;
7. CP scheme 5,6 with 1 to 5 classified as mild, 6 as moderate, and 7 to 10 as severe; and 8. CP scheme 5,7 with 1 to 5 classified as mild, 6 to 7 as moderate, and 8 to 10 as severe.Because our study used a scale of 0 to 10 cm, we rounded off using the usual rules. For example, 5.4 cm was rounded off to 5 and 7.5 cm was rounded off to 8, so that CP scheme 3,7 in our study meant 0.5 to 3.4 being classified as mild, 3.5 to 7.4 as moderate, and 7.5 to 10 as severe. We used the VAS in this way to allow comparisons with other studies.
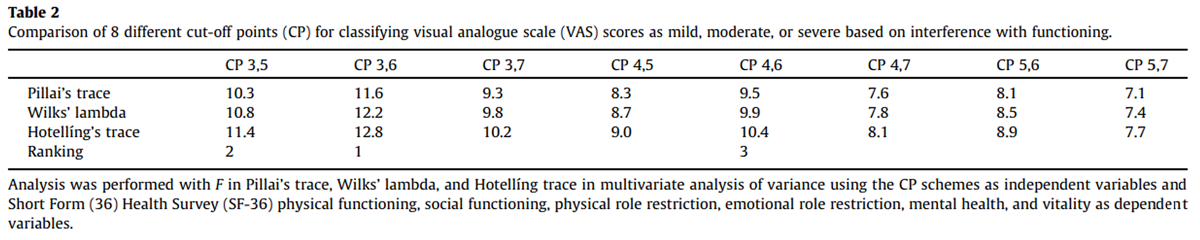
To determine which classification scheme was best able to distinguish among mild, moderate, and severe pain, we conducted 1-way multivariate analyses of variance (MANOVAs), using the General Linear Model in SPSS software for each of the 8 classification schemes. We used VAS score (8 CP schemes for mild, moderate, or severe) as the independent variable and SF-36 scores on physical functioning, social functioning, physical role restriction, emotional role restriction, mental functioning, and vitality as the dependent variables. A significant F value indicated that there were significant differences among the 3 pain severity groups in terms of pain-related interference; in accordance with Serlin et al. [20], we interpreted the highest F value as indicating the classification scheme that maximized the differences among the groups and was therefore the most useful for distinguishing mild, moderate, and severe pain.
Cut-off points for the VAS in comparison with the VRS
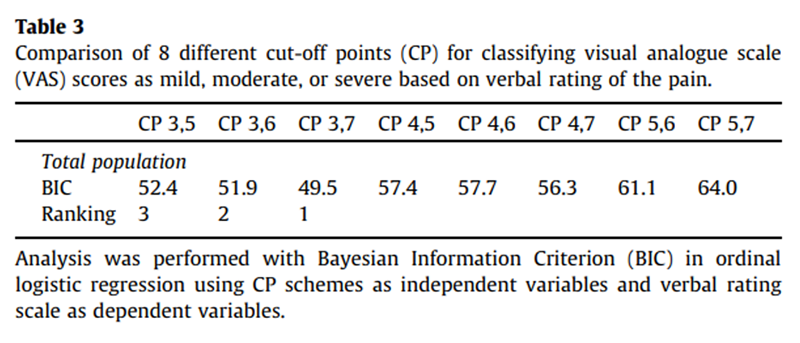
We determined the cut-off points for the VAS by comparing the VAS and VRS scores using 8 ordinal logistic regression analyses (Generalized Linear Model in SPSS) for the above 8 VAS cut-off schemes, with the VAS score as independent variable and the VRS score as dependent variable. We re-coded the VRS scale to a 3-point scale, by giving very mild and mild a score of 1, moderate a score of 2, and severe and very severe a score of 3. The Bayesian Information Criterion (BIC) was used as a measure of the fit of the model. The lowest BIC indicated the best classification scheme.
A scatter plot and a box plot were constructed to get an impression of the association between the VAS scores and the impact on functioning and the verbal rating. The scatter plot depicts the VAS score and the sum score for the SF-36 domains of physical functioning, social functioning, physical role restriction, emotional role restriction, mental functioning, and vitality, normalized to a percentage of the maximum score. The box plot was based on the VAS and VRS scores. In addition, Spearman correlation coefficients (rho) were calculated between the VAS and the normalized sumscore of the abovementioned SF-36 domains, and between the VAS and VRS scores.
Latent class analysis
We applied a mixture modeling with a latent class model to split the VAS scores of the patients into latent classes. Latent class analysis is a statistical method for finding subtypes of related cases (latent classes) from the VAS data. The classes thus found are called ‘‘latent’’ because the class membership of a particular case is not directly observed. Latent class analysis is used to try to find the cut-off points that optimize a mathematical criterion (the criterion of maximum likelihood). Advantages over traditional types of analysis include the following: probability-based classification is possible (cases are classified into clusters based upon membership probabilities estimated directly from the model); variables may be continuous, categorical (nominal or ordinal), or counts or any combination of these; demographics and other covariates can be used for cluster description. There are no limitations of latent class analysis as long as the method is used for the proper study question. The model fit can be assessed by several statistical methods, each having its own criterion. The most common goodness-of-fit criteria are the Bayesian Information Criterion (BIC), Akaike’s Information Criterion (AIC), and Consistent AIC (CAIC). Smaller values correspond to better models. In comparing different models for the same data, models with lower values for these indices are preferable. [25] In our study, we were interested not only in the model with the best goodness-of-fit but also in finding a model with 3 classes, as this might correspond to the interpretation of the classes as mild – moderate – severe pain. Latent class analysis was done using the computer program Latent GOLD. [24–26]
All other data were analyzed using SPSS, version 19.0
Results

Table 1
Table 2
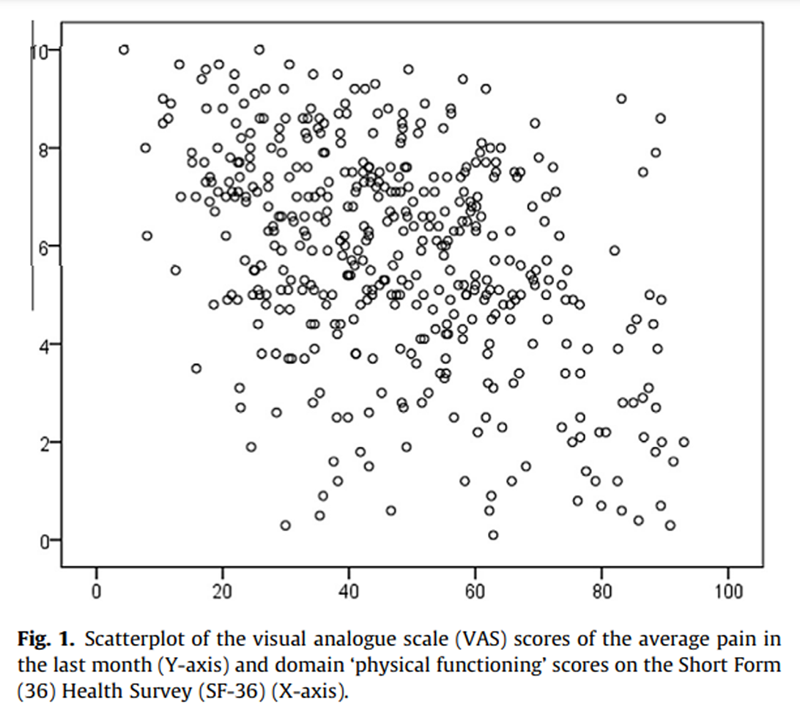
Figure 1
Table 3
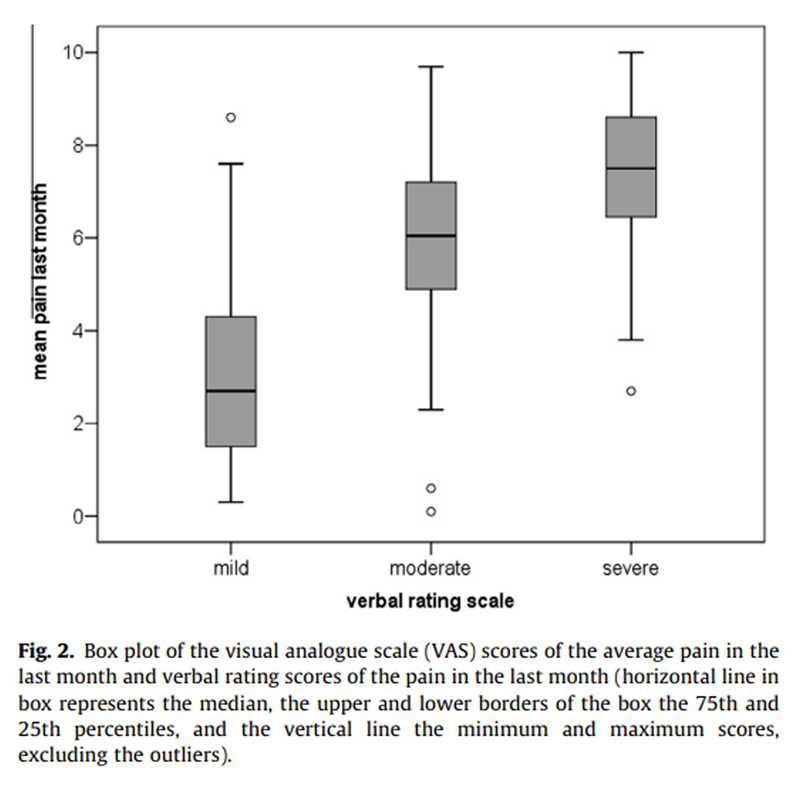
Figure 2
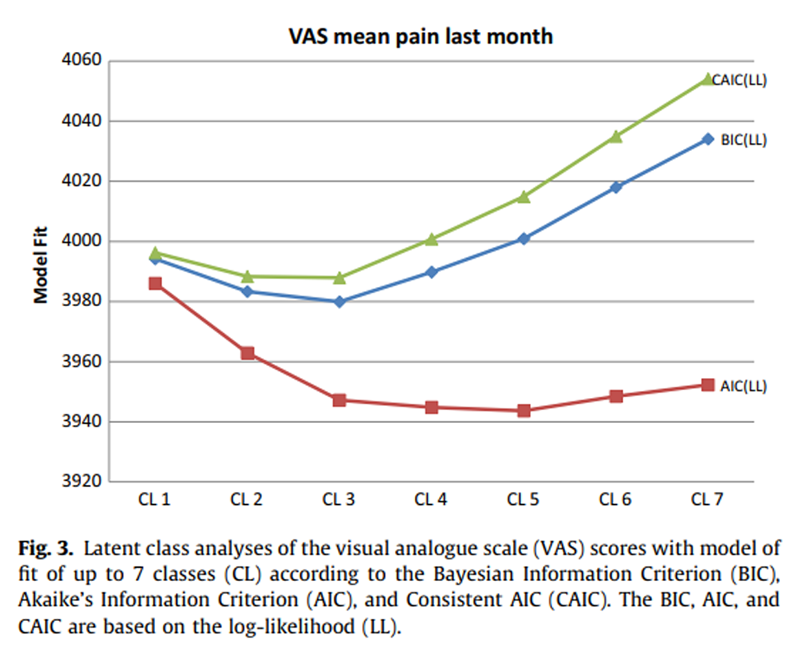
Figure 3
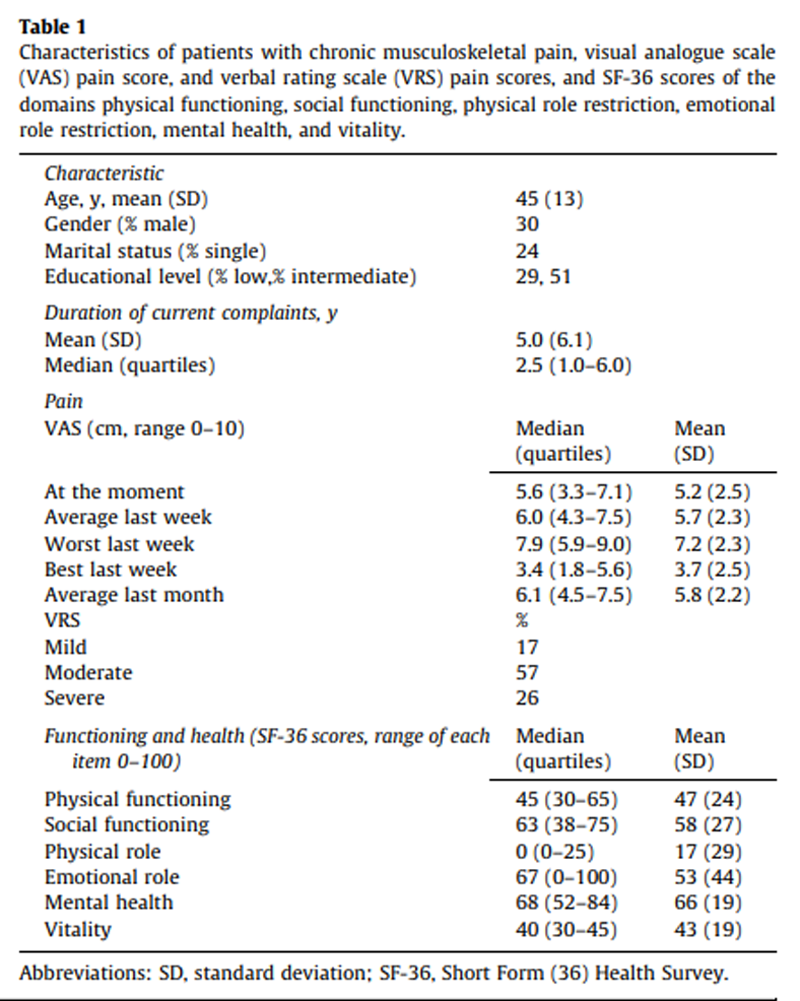
Table 4 Patient characteristics are presented in Table 1.
The results of the MANOVAs on the total population indicated that the CP scheme 3,6 provided the best fit for distinguishing pain with a mild, moderate, and severe impact on functioning (Table 2). This means that a VAS score 63.4 cm corresponds to mild interference of pain with the functioning of patients with chronic musculoskeletal pain, a score of 3.5 to 6.4 represents moderate interference, and a score P6.5 corresponds to severe interference with functioning. A scatter plot with VAS and the normalized sum score of the 6 domains of the SF-36 is shown in Figure 1.
Ordinal logistic regression showed that the CP scheme 3,7 provided the best fit for the model of the association between VAS and VRS (Table 3). This means that a VAS score 63.4 corresponds best with mild pain, 3.5 to 7.4 with moderate pain, and P7.5 with severe pain. The BIC, AIC, and CAIC produced the same ranking. The box plot with VAS and VRS scores is given in Figure 2.
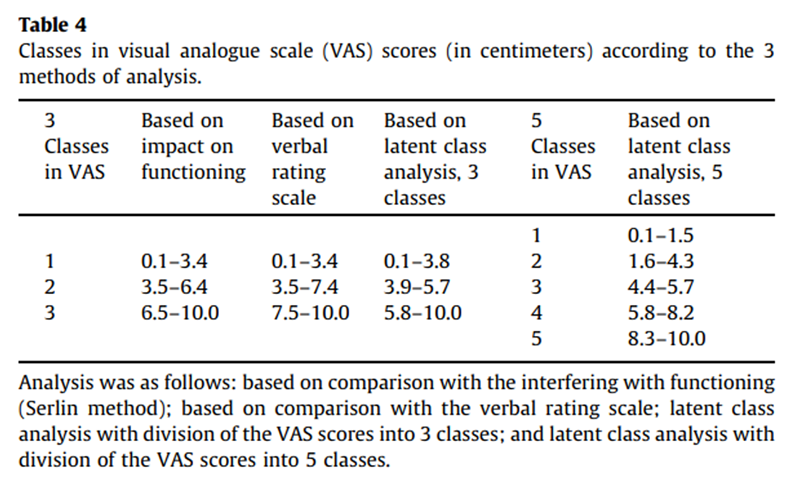
As can be seen from Figure 3, the 3-class solution is the one preferred according to the BIC and CAIC criteria, whereas the 5-class solution is preferred according to the AIC. The estimated latent class proportions in the 3-class model for the VAS are 0.53, 0.28, and 0.19. The estimated means (ranges) are 7.5 (5.8–10.0), 4.9 (3.9–5.7) and 2.3 (0.1–3.8), respectively. The estimated latent class proportions in the 5-class model are 0.40, 0.24, 0.18, 0.14, and 0.05. The estimated means (ranges) are 7.0 cm (5.8–9.2), 5.1 cm (4.4–5.7), 3.1 cm (1.6–4.3), 8.9 cm (8.3–10.0), and 0.8 cm (0.0–1.5), respectively.
Table 4 summarizes the results obtained with the 3 methods used.
Discussion
The aim of our study was to identify the cut-off points on the VAS for mild, moderate, and severe pain, in relation to pain-related interference with functioning, in relation to the verbal description of the VAS score, and tby latent class analysis. The VAS score cutoff points for pain-related interference with functioning were 63.4 cm for mild interference, 3.5 to 6.4 for moderate interference, and P6.5 for severe interference. Cut-off points for verbal equivalents of VAS pain scores were found to be 63.4 cm for mild pain, 3.5–7.4 for moderate pain, and P7.5 for severe pain. Latent class analyses also identified 3 classes, namely 63.8 cm, 3.9–5.7, and P5.8. Comparing the 3 methods shows that the first class is almost equal in all 3 methods, so VAS 63.5 can be best described as mild. The cut-off point between moderate and severe pain is not fully clear. Comparing the cut-off points between moderate and severe for the VAS scores in terms of pain-related interference with functioning and in terms of verbal rating (ie, scores of 4–6 or 4–7 representing moderate pain) shows that although patients may score their pain on a VRS as moderate, the impact on functioning can be severe. When patients refer to their pain as moderate, this might be an underestimate of the impact of their pain on functioning. This was not found in previous studies, because we were the first to compare the results of the cut-off points in terms of impact and in terms of verbal rating. The intermediate class in the 3 latent classes is more similar to moderate interference with functioning than with moderate pain on the verbal rating scale, so the latent classes are most probably determined by interference with functioning. The 5 classes in the latent class analysis do not seem to have a connection with the interference classes or with verbal rating. The clinical importance of our findings is not yet clear, because we could not find an explanation for the classes identified in our study. Future studies will need to explore these latent classes further.
Most studies in literature have focused on acute or subacute pain. This study is 1 of the few that has focused on chronic musculoskeletal pain. Moreover, as far as we know, we were the first to use 3 methods to determine the cut-off points in the same population, and this was the first study using latent class analysis. The present study confirms the findings of other studies [9, 13, 12], by identifying the CP scheme 3,6 as the optimal scheme.
This cut-off point scheme for pain-related interference with functioning was also found among patients with the‘‘pain in general’’ category [13],
diabetic neuropathy [12, 29], and
neck pain. [9]Other schemes have been found for patients with
cancer pain, viz 4,6 [20] and 4,7 [18],
back pain, viz 4,6 [13], 4,7 [28], 5,8 [22],
phantom pain, viz 4,7 [13],
neck pain in female patients, viz 4,7 [9],
spinal cord injury, viz 3,7 [11],
osteoarthritis, viz 5,7 [28], and
4,6 for hip patients and 4,7 for knee patients. [14]Results from the literature and our own study show that the cut-off point between mild and moderate pain, in terms of pain-related interference with functioning, is placed between 2.5 and 4.5 and the cut point between moderate and severe pain is between 5.5 and 7.4. These ranges may be explained by different study samples, different pain definitions, and different measures of functioning.
The 3,7 cut-off scheme for verbal description of the VAS scores found in our study is partly in accordance with the findings of Collins et al. [5] for patients with postoperative pain, viz 3,5 and those of Palos et al. [17] for the general population, viz 4,6/7. This means that the cut-off point for the descriptions of mild and moderate pain also lies between 2.5 and 4.5, and the cut-off point for moderate and severe pain between 4.5 and 7.4. The scatter and box plot with the VAS scores and functioning scores or VRS scores show that the variability of the VAS score for each category of the other scores is large. This is also reflected by the low-to-moderate correlation coefficients, with rho values of 0.38 (between VAS and functioning) and 0.59 (between VAS and VRS). The low correlation coefficient of the association between VAS and functioning is in line with findings reported in the literature. [2, 22, 23] These low correlation coefficients may be partly due to a nonlinear association between pain and functioning [13, 18], although this nonlinearity is not very clear in our data.
Comparing the correlation coefficient of the association between VAS and VRS scores with those found in other studies shows that we found a lower coefficient than others, viz 0.71–0.79. [3, 4, 7] Unlike our analysis, however, the other studies also included patients with no pain, which may explain the difference. In view of the low-to-moderate associations, it is questionable whether it is useful in clinical practice to translate the VAS scores into mild, moderate, or severe pain. The different instruments seem to measure different constructs. Comparing the cut-off points found in the literature shows that there seem to be no universal optimal cut-off points, either for the cut-off points on the VAS in relation to pain-related interference with functioning, or for cut-off points on the VAS in relation to verbal rating. This would also make such a classification difficult to use in practice.
Our study was subject to some limitations, which must be considered when interpreting the results. First, we studied only the VAS score for the average pain over the last 4 weeks. Using a different pain assessment as ‘‘worst pain’’ might have resulted in a different result. [11] However, as we wanted to compare the VAS scores with the SF-36 questions asking about functioning and average pain during the last 4 weeks, using the average pain over the same period was the most appropriate choice. Second, potential confounders or effect modifiers, such as age [10], ethnicity [17], and depressive symptoms [15], were not included in our study. These will need to be assessed in future studies. Third, the patients in our study included few men (30%); this is, however, in line with other studies. [15, 17] Fourth, interference with daily life functioning was assessed using the domains of the SF-36. Although frequently used in pain research [8], the SF-36 is a generic measure. A more specific measure for pain interference, such as the Brief Pain Inventory (BPI), might have given other results, and this should be used in future studies.
Conclusion
In conclusion, we found that VAS scores 63.4 cm corresponded to mild pain-related interference with functioning, scores of 3.5–6.4 to moderate interference, and scores P6.5 to severe interference. VAS scores 63.4 cm were best described as mild pain, 3.5–7.4 as moderate pain, and P7.5 as severe pain for patients with chronic musculoskeletal pain. When patients refer to their pain as moderate, this might be an underestimate of the impact of their pain on functioning. A 3-class solution offered the best fit according to 2 models in our latent class analysis, yielding the classes 0.1–3.8 cm, 3.9–5.7 cm, and 5.8–10 cm. VAS scores lower than approximately 3.5 might be called mild pain, but the cut-off point between moderate and severe pain was not fully clear and differed with the statistical methods used. In any case, the variability within each of the VAS categories was large, so the cut-off points must be used with caution.
Conflict of interest
The authors report no conflicts of interest.
References:
Aaronson NK, Muller M, Cohen PDA, Essenk-Bot M-L.
Translation, validation, and norming of the Dutch language version
of the SF-36 Health Survey in community and chronic disease populations.
J Clin Epidemiol 1998;51:1055–68.Boonstra AM, Schiphorst Preuper HR, Reneman MF, Posthumus JB, Stewart RE.
Reliability and validity of the visual analog scale for disability
in patients with chronic musculoskeletal pain.
Int J Rehabil Res 2008;31:165–9.Breivik EK, Björnsson GA, Skovlund E.
A comparison of pain rating scales by sampling clinical trial data.
Clin J Pain 2000;16:22–8.Clark P, Lavielle P, Martinez H.
Learning from pain scales: patient perspective.
J Rheumatol 2003;30:1584–8.Collins SL, Moore A, McQuay HJ.
The visual analogue pain intensity scale:
what is moderate pain in millimetres?
PAIN 1997;72:9597.Dijkers M.
Comparing quantification of pain severity by verbal rating
and numeric rating scales.
J Spinal Cord Med 2010;33:232–42.Downie WW, Leatham PA, Rhind VM, Wright V, Branco JA.
Studies with pain rating scales.
Ann Rheum Dis 1978;37:378–81.Dworkin RH, Turk DC, Farrar JT, Haythornthwaite JA, et al.
Core outcome measures for chronic pain clinical trials:
IMMPACT recommendations.
PAIN 2005;113:9–19.Fejer R, Jordan A, Hartvigsen J.
Categorising the severity of neck pain: establishment of cut-points
for use in clinical and epidemiological research
Pain 2005 (Dec 15); 119 (1-3): 176-182Gibson SJ, Farrell M.
A review of age differences in the neurophysiology of nociception
and the perception and the perceptual experience of pain.
Clin J Pain 2004;20:227–39.Hanley MA, Masedo A, Jensen MP, Cardenas D.
Pain interference in persons with spinal cord injury:
classification of mild, moderate, and severe pain.
J Pain 2006;7:129–33.Hoffman DL, Sadosky A, Dukes EM, Alvir J.
How do changes in pain severity levels correspond to changes in health
status and function in patients with painful diabetic peripheral neuropathy?
PAIN 2010;149:194–201.Jensen MP, Smith DG, Ehde DM, Robinson LR.
Pain site and the effects of amputation pain: further clarification
of the meaning of mild, moderate, and severe pain.
PAIN 2001;91:317–22.Kapstad H, Hanestad BR, Rustoen T, Stavem K.
Cutpoints for mild, moderate and severe pain in patients with osteoarthritis
of the hip or knee ready for joint replacement surgery.
BMC Musculoskelet Disord 2008;9:55.Lati C, Guthrie LC, Ward MM.
Comparison of the construct validity and sensitivity to change of the
visual analog scale and a modified rating scale as measures
of patient global assessment in rheumatoid arthritis.
J Rheumatol 2010;37:717–22.Littman GS, Walker BR, Schneider BE.
Reassesment of verbal and visual analog ratings in analgesic studies.
Clin Pharmacol Ther 1985;38:16–23.Palos GR, Mendoza TR, Mobley GM, Cantor SB, Cleeland CS.
Asking the community about cutpoints used
to describe mild, moderate and severe pain.
J Pain 2006;7:49–56.Paul SM, Zelman DC, Smith M, Miaskowski C.
Categorizing the severity of cancer pain:
further exploration of the establishment of cutpoints.
PAIN 2005;113:37–44.Price DD, McGrath PA, Rafii A, Buckingham B.
The validation of visual analog scales as ratio
scale measures for chronic and experimental pain.
PAIN 1983;17:45–56.Serlin RC, Mendoza TR, Nakamura Y, Edwards KR, Cleeland CS.
When is cancer pain mild, moderate of severe?
Grading pain severity by its interference with function.
PAIN 1995;61:277–84.Turk DC, Dworkin RH, Allen RR, Bellamy N, Brandenburg N. et al.
Core outcome domains for chronic pain clinical trials:
IMMPACT recommendations.
PAIN 2003;106:337–45.Turner JA, Franklin G, Heagerty PJ, Wu R, Egan K.
The association between pain and disability.
PAIN 2004;112:307–14.Van Duijn M, Lötters F, Burdorf A.
Interrelationships between pain, disability, general health, and quality
of life and associations with work-related and individual factors.
Spine 2004;29:2178–83.Vermunt JK, Magidson J.
Latent class models for classification.
Comput Stat Data Anal 2003;41:531–7.Vermunt JK, Magidson J.
Latent GOLD 4.0 user guide.
Belmont, MA: Statistical Innovations Inc.; 2005.Vermunt JK, Magidson J.
Technical guide for Latent GOLD 4.0:
basic and advanced.
Belmont, MA: Statistical Innovations Inc.; 2005.Wallenstein SL, Heidrich G, Kaiko R, Houde RW.
Clinical evaluation of mild analgetics:
the measure of clinical pain.
Br J Clin Pharmacol 1980;10:319S–27S.Zelman DC, Hoffman DL, Seifeldin R, Dukes EM.
Development of a metric for a day of manageable pain control:
derivation of pain severity cut-points for low
back pain and osteoarthritis.
PAIN 2003;106:35–42.Zelman DC, Dukes E, Brandenburg N, Bostrom A, Gore M.
Identification of cutpoints for mild, moderate and severe
pain due to diabetic peripheral neuropathy.
PAIN 2005;115:29–36.
Return to LOW BACK PAIN
Return to CHRONIC NECK PAIN
Return to OUTCOME ASSESSMENT
Since 9-24-2023
| Home Page | Visit Our Sponsors | Become a Sponsor |
Please read our DISCLAIMER |