

Cut Points for Mild, Moderate, and Severe Pain on the
VAS for Children and Adolescents: What Can Be
Learned from 10 Million ANOVAs?This section is compiled by Frank M. Painter, D.C.
Send all comments or additions to: Frankp@chiro.org


FROM: Pain 2013 (Dec); 154 (12): 2626–2632 ~ FULL TEXT
Gerrit Hirschfeld • Boris Zernikow
German Paediatric Pain Centre,
Children's Hospital Datteln,
Germany Children's Pain Therapy and Paediatric Palliative Care,
Witten/Herdecke University, Germany.
Cut points that classify pain intensity into mild, moderate, and severe levels are widely used in pain research and clinical practice. At present, there are no agreed-upon cut points for the visual analog scale (VAS) in pediatric samples. We applied a method based on Serlin and colleagues' procedure (Serlin RC, Mendoza TR, Nakamura Y, Edwards KR, Cleeland CS. When is cancer pain mild, moderate or severe? Grading pain severity by its interference with function. PAIN(®) 1995;61:277-84) that was previously only used for the 0 to 10 numerical rating scale to empirically establish optimal cut points (OCs) for the VAS and used bootstrapping to estimate the variability of these thresholds. We analyzed data from the German Health Interview and Examination Survey for Children and Adolescents (KiGGS) study and defined OCs both for parental ratings of their children's pain and adolescents' self-ratings of pain intensity. Data from 2276 children (3 to 10 years; 54% female) and 2982 adolescents (11 to 17 years; 61% female) were analyzed. OCs were determined in a by-millimeter analysis that tested all possible 4851 OC combinations, and a truncated analysis were OCs were spaced 5 mm apart, resulting in 171 OC combinations. The OC method identified 2 different OCs for parental ratings and self-report, both in the by-millimeter and truncated analyses. When we estimated the variability of the by-millimeter analysis, we found that the specific OCs were only found in 11% of the samples. The truncated analysis revealed, however, that cut points of 35:60 are identified as optimal in both samples and are a viable alternative to separate cut points. We found a set of cut points that can be used both parental ratings of their children's pain and self-reports for adolescents. Adopting these cut points greatly enhances the comparability of trials. We call for more systematic assessment of diagnostic procedures in pain research.
Keywords: Bootstrap; Optimal cut points; Pain intensity; VAS.
From the FULL TEXT Article:
Introduction
The ability to accurately measure and interpret pain intensity is central to any research endeavors in the domain of pain. Research with children and adolescents is sometimes considered especially problematic because it is unclear whether young children can understand and follow the instructions, and because pain intensity in very young children can only be inferred from parental ratings. Most of the research in children has focused on demonstrating the feasibility of collecting ratings in children and adolescents. [20, 24] In contrast to this, much less attention has been paid to the question of how these ratings can be interpreted in clinical settings. In adults, there is some disagreement on how to establish cut points that aid the interpretation of the continuous pain intensity or changes therein. [7] For children, only one study has investigated optimal cut points (OCs) for the 0 to 10 numerical rating scale (NRS) in children with chronic pain admitted to a tertiary pain clinic. [11] Several other studies have tried to identify clinically meaningful changes in acute pain intensity [3, 16, 23], but these too were enrolled in emergency departments. The aim of the present research was to empirically define cut points for mild, moderate, or severe pain for the visual analog scale that can be used in population-based studies with children and adolescents.
There exist several methods to empirically establish meaningful cut points for pain intensity ratings. [4] The most widely used method to empirically define thresholds has been developed by Serlin and colleagues. [19] According to their method, cut points optimal to classify pain intensity are those that best predict the level of functional interference. Several authors have applied this method to various adult populations and have found a whole range of OCs (for an overview, see [11]). In adults, a number of reasons have been put forward that might account for the differences in OCs: pain location, recruitment setting, and type of anchor. [4, 7] Accordingly, a number of studies have established specialized cut points for different subgroups.
The problem with this method is that it yields only 1 OC, irrespective whether there are close seconds or not. Differences between groups are thus hard to interpret and possibly due to chance. [11] Although this poses problems when trying to compare groups on the basis of these scores, estimating the variability, and determining a range of alternative OCs, researchers can make an informed decision on whether separate cut points are needed or whether the same OC is viable in more than 1 group. Bootstrapping has been introduced to assess this variability. [14]
The aim of the present study was to use a method similar to that developed by Serlin and colleagues [19] to establish OCs for mild, moderate, and severe pain to be used in population-based pediatric research. We analyze publicly available data from the German Health Interview and Examination Survey for Children and Adolescents study (KiGGS). [5] We explicitly estimated the variability of the OCs to test whether OCs can be found that are suitable for both children (as assessed by parental report) and adolescents (as assessed by self-report).
Methods
Subjects

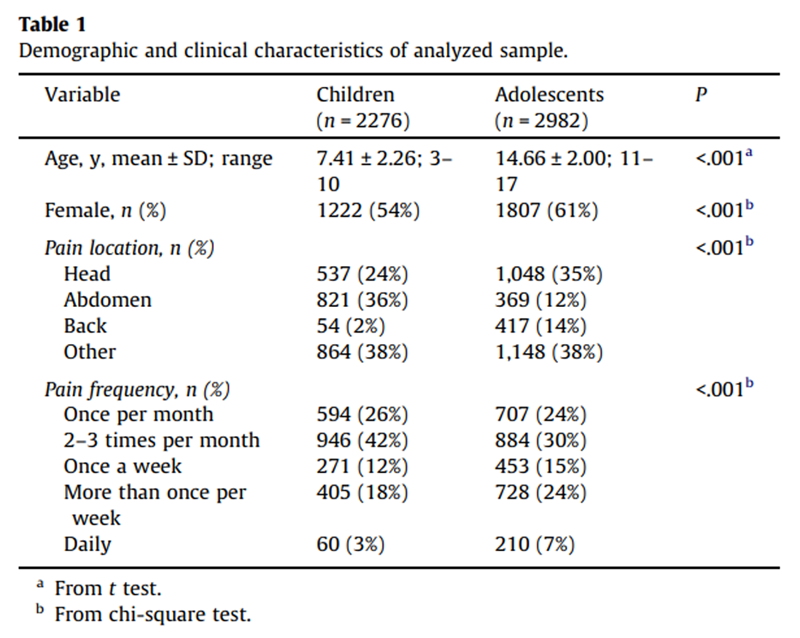
Table 1 The design of the Kinder KiGGS study [13] as well as children’s pain reports [5] have been described previously. In this study, we analyze only a subset of the total 17,641 respondents who reported having had pain in the past 3 months and who reported that they experienced this pain at least once a month. We analyzed data from 2,276 children (3 to 10 years; 7.41 years ± 2.26; 54% female) and 2,982 adolescents (11 to 17 years; 14.66 years ± 2.00; 61% female). Importantly, we used nonweighted analysis. Core demographic information about the sample analyzed is provided in Table 1.
Questionnaires
Two measurements were used in the present study; a pain intensity rating and a pain-related disability rating. Pain intensity was assessed by means of a visual analog scale (VAS) ranging from 0 to 100. Pain intensity was assessed by parental reports of children (<11 years) and self-reports for adolescents (11 to 17 years). The end points were anchored verbally as ‘‘hardly noticeable pain’’ and ‘‘strongest imaginable pain.’’ A ‘‘no pain’’ anchor is frequently omitted in population-based research [17], where screening questions ensuring that some pain is perceived precede ratings of the pain intensity. Pain-related disability was measured with 10 items that each assessed to what extent the child or adolescent was disabled in specific domains (eg, school, friends, hobbies) and how often medication was taken or a physician visited. Each item had 5 response options. These 10 items were averaged to yield an average disability score, ranging from 1 ‘‘no disability’’ to 5 ‘‘high disability.’’ Cronbach’s alpha for these scales was .78 for children and .83 for adolescents. Although this is worse than established scales for disability [12], these reliabilities are still acceptable.
Data analysis
The relationship between pain intensity and disability in children and adolescents was visualized as scatter plots and quantified by bivariate correlations. Differences between the correlations were assessed by Fisher’s r-to-z transformation.
OCs were defined on the basis of a method similar to the analysis developed by Serlin and colleagues. [21] Because the aim of our study was to test whether similar cut points emerged in the 2 age groups, we focused on a separate analysis instead of the combined analysis used by Serlin and colleagues (Appendix A). The OCs according to this procedure are the pair that explain the largest amount of variance (as indicated by the highest F value) in pain-related disability scores. Two different kinds of cut points were tested. First, we performed a by-millimeter analysis that went through all possible cut points millimeter by millimeter. The lower cut points ranged from 1 to 98 and the higher cut points from 2 to 99. This resulted in 4851 possible combinations in which the higher cut point was higher than the lower cut point. Second, we performed a truncated analysis that only used cut points spaced 5 mm (ie, 5 points) apart. The lower cut points ranged from 5 to 90 and the higher cut points from 10 to 95. This resulted in 171 possible combinations. Each cut point combination was used to classify pain ratings into low, medium, or high pain and was entered as a between-subject factor in an analysis of variance (ANOVA) with the disability score as the predicted variable. The OCs were defined as those cut points that resulted in the largest amount of explained variance, indexed by the largest F value. Here we use an inclusive naming convention—that is, cut points are named after the upper bound for mild and the upper bound for moderate pain. For example, a cut point of 25:60 indicates that ratings from 0 to 25 indicate mild pain, ratings from 26 to 60 indicate moderate pain, and ratings from 61 to 100 indicate severe pain.
A bootstrap resampling procedure was used to quantify the variability of the OCs. [11] This entailed drawing (with replacement) 1000 pseudosamples with the same number of participants from the original sample. For each pseudosample, the OC procedure was used to determine OCs. The performance of the various cut points was inspected in the whole sample, and the resulting frequency distribution of OCs was inspected by descriptive statistics. Overall, 10,054,044 (2002 4851 + 2002 171) ANOVAs were computed. R software [19] was used for data analysis.
Results
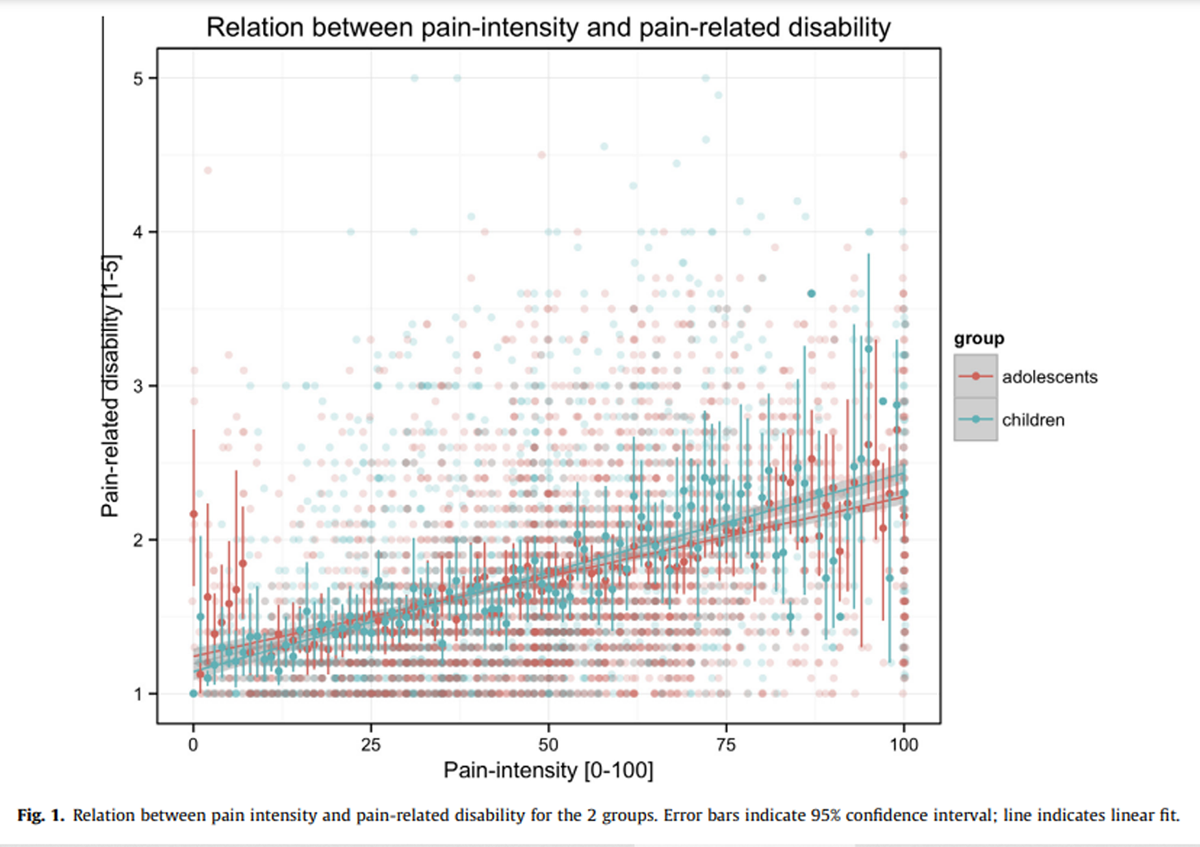
Figure 1
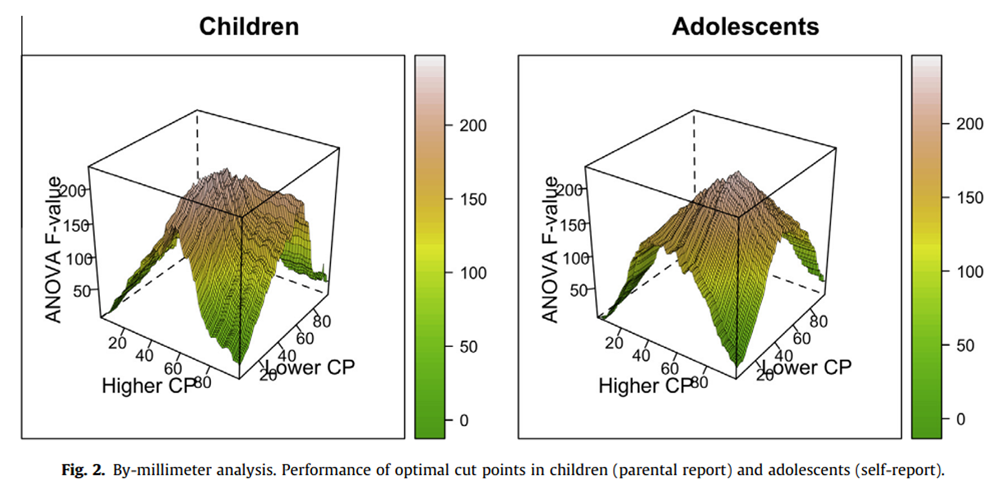
Figure 2
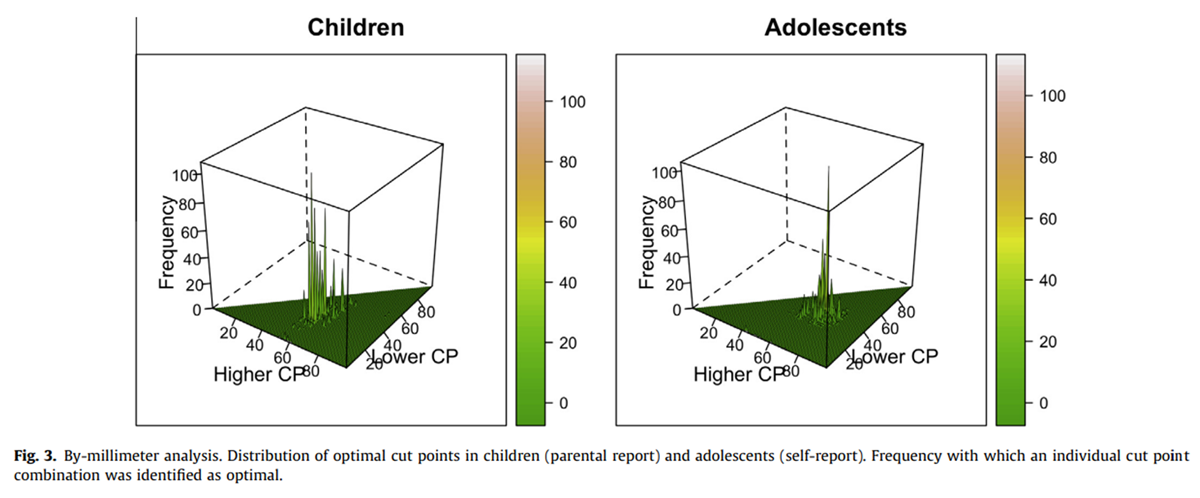
Figure 3
Table 2
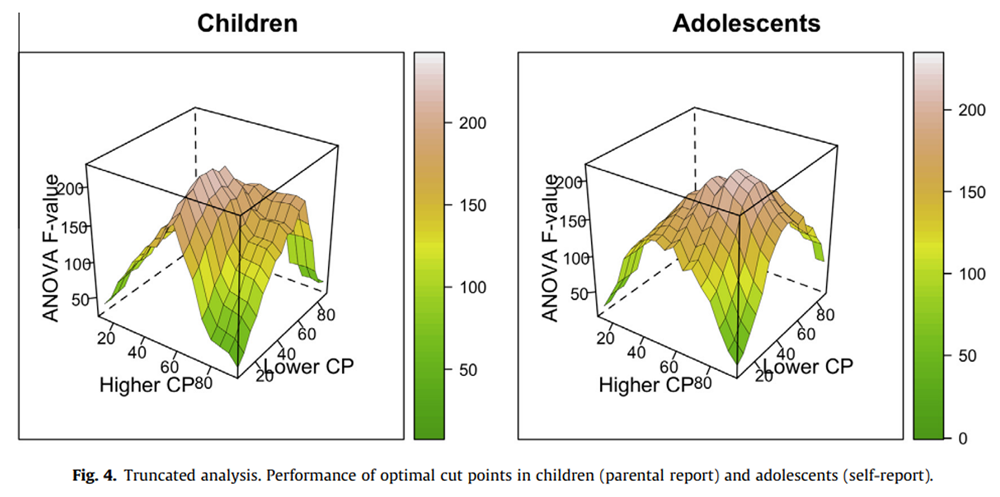
Figure 4

Figure 5
Table 3 The overall relation between pain intensity and pain-related disability is depicted in Figure 1. There were significant mediumsize correlations between pain and disability for children (r = .42; 95% confidence interval .38–.45; P < .001) and adolescents (r = .37; 95% confidence interval .34–.40; P < .001). A test of the equality of the population correlations was not statistically significant (P > .05).
By-millimeter analysisOCs in children and adolescents
The F values were relatively smoothly distributed in the 2 groups, with adjacent cut points yielding very similar F values (Figure 2).
For children, we found that the peak of this distribution, ie, the OC, in the original sample was 25:59; that is,parental ratings from 0 to 25 indicate mild pain;
ratings between 26 and 59 indicate moderate pain; and
ratings higher than 59 indicate severe pain.
For the adolescents, the OC for the original sample was 43:71; that is,self-ratings from 0 to 43 indicate mild pain;
ratings between 44 and 71 indicate moderate pain; and
ratings higher than 72 indicate severe pain.As can be seen from Figure 2, there are several other cut points that also result in large amount of variance explained for the 2 groups.
Bootstrapping
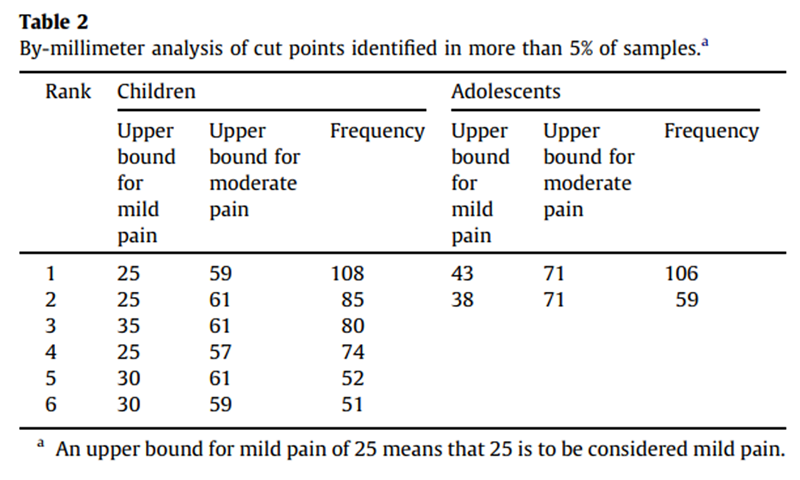
The results of the bootstrapping analysis demonstrate a much less smooth distribution of results (Figure 3), with large differences in the frequency at which cut points were being identified as optimal even for cut points that are numerically very similar. Further more, we found that the OC of the original sample was identified as optimal in only 108 (11%) of children’s pseudosamples and 106 (11%) of adolescents’ pseudosamples. In both groups, several alternative cut points were found in more than 5% of the samples (Table 2). For example, in children, 35:61 was identified as optimal in 8% of the pseudosamples and in adolescents, 38:71 was identified as optimal in 6% of the pseudosamples.
Truncated analysisOCs in children and adolescents
The truncated analysis revealed 25:60 as OCs for children’s pain intensity as assessed by parental report and 40:70 for adolescents’ pain intensity as assessed by self-report. Again, there was a relatively smooth distribution of F values, with many alternative cut points also resulting in large amounts of variance explained (Figure 4).
Bootstrapping
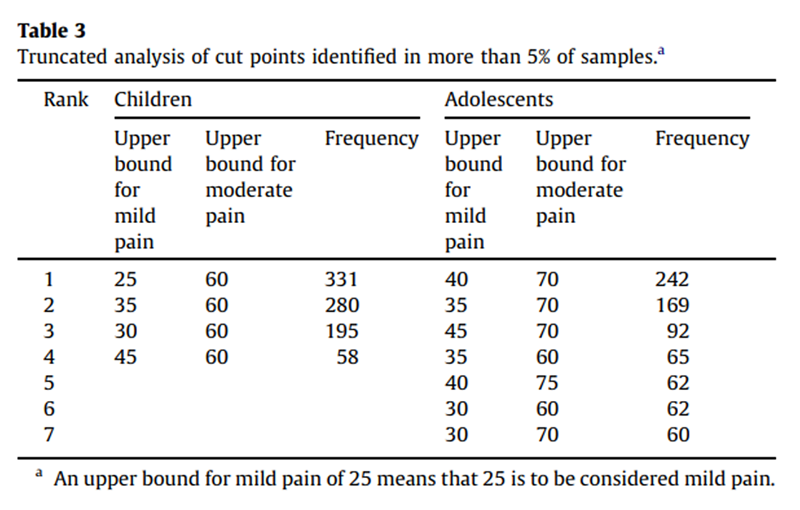
The inspection of the results of the bootstrapping analysis now also yielded a smooth distribution of the frequency at which specific cut points are selected as optimal. Specifically, we found that the OCs of the original samples were identified in 331 (33%) of children’s pseudosamples and in 242 (24%) of adolescents’ pseudosamples (Figure 5). Inspection of the alternative cut points that were found in at least 5% of the samples (Table 3) revealed that a combination of 35:60 was found in 280 (28%) of the children’s pseudosamples and in 65 (7%) of the adolescents’ samples.
Discussion
The aim of the present study was to establish meaningful cut points for mild, moderate, and severe pain for pediatric samples. Serlin and colleagues’ [19] procedure was adopted to identify OCs for the NRS to the VAS and used bootstrapping to estimate the variability of the procedure. [11] A method based on this procedure yielded different cut points for parental reports of their children’s pain intensity and adolescents’ self-report. Instead of arguing for 2 different sets of cut points, our analysis of the variability of the OCs suggests that 35:60 is a viable cut point combination for both groups. In the following, we put our finding into perspective before turning to the study’s limitations and our general conclusions.
So far, Serlin and colleagues’ method has only been applied to the 0 to 10 NRS. Even though VASs and NRSs are systematically correlated, they also exhibit systematic mean differences and random fluctuations [25], indicating that there is no simple correspondence between ratings collected with these scales. Thus, it is necessary to establish cut points specifically for the VAS. There are several ways to implement Serlin’s method based on either F ratios or F values. In the original study, F ratios were used to identify cut points that maximize the variance explained by pain while minimizing the variance explained by the interaction of pain intensity and nation. When data are collected in only 1 group, the F value of the pain factor is typically used as a criterion. [10] As the F ratio criterion always generates OCs, this procedure cannot be used to test whether similar cut points emerge in separate groups. In contrast, when analyzing groups separately, bootstrapping is needed to the assess overlap between the groups. An advantage of this procedure is that it can be used when raw data for the 2 groups are not available. Furthermore, the use of F values rather than F ratios as criterion avoids problems when all possible combinations of cut points are tested. The F ratio criterion is strongly biased toward extreme cut points, as these yield very small interaction terms (Appendix A). Serlin’s original study only tested between 4 [21] of the 45 possible cut point combinations. Although previous research may guide the a priori exclusion of cut point combinations, it highlights an important limitation when F ratios are used to define OCs.
We found that a by-millimeter implementation of the method yielded very unstable results in the sense that the individual OCs were only identified in a minority of the samples. This simply reflected the fact that it was less likely to find the same OC if there were more possible combinations. The number of possible combinations is related to the resolution at which the pain intensity is assessed. For the 0 to 10 NRS, only 45 different combinations are possible, while for the VAS 4851 different combinations can be tested. However, it is highly unrealistic to assume that pain intensity can be assessed at that precision by the use of the VAS. We believe that the 5-mm steps chosen for the truncated analysis is a more realistic measure for pain intensities. But the high precision makes it very transparent that the variability needs to be taken into account when OCs are defined. In line with this, a few studies that determine patient acceptable symptom states (PASS) for VAS ratings estimate confidence intervals for PASS [21, 22], while only one study has estimated the variability cut points for the NRS. [11] In principle, the problem of variable thresholds being identified as optimal pertains also to other empirically defined thresholds, eg, when thresholds for minimally clinically significant changes in pain scores are determined. [8] It will be interesting to check whether variability can also explain the differences between studies in this domain as well.
On a more general level, we ask for a shift in the balance between 2 contradicting trends in diagnostic pain research: developing novel measures and systematically evaluating existing diagnostic measures. At present, there is a trend toward novel diagnostic measures, as exemplified by more and more specialized cut points, eg, different cut points for osteoarthritis of the hip vs of the knee. [12] The reason for this is that publishing novel cut points may be easier for individual researchers, and it ultimately results in more publications and citations. The costs of this practice to the research and ultimately clinical community is immense, as results from studies in which different cut points were used can no longer be compared. [1, 2, 9] A recent review also demonstrated that the cut points used to define clinically significant changes varied widely between randomized controlled trials. [18] It seems highly likely that there is a similar variation in the use of cut points for mild, moderate, and severe pain.
Systematically evaluating diagnostic measures would most importantly include an assessment of predefined cut points. It is well known that the post hoc determination of cut points [6] grossly overestimates the diagnostic performance of diagnostic markers. In contrast to this, most studies are post hoc analysis that establish novel OCs. As a result, a recent systematic review concludes, ‘‘We should hold back using a certain cut point in quality indicators and be cautious about strongly recommending a certain cut point in guidelines’’. [15] A requirement to prospectively assess the performance of measures and cut points would be relevant not only for mild, moderate, and severe pain, but also for all procedures where thresholds are sought to dichotomize discrete scales, eg, minimally clinically significant/relevant changes [7] or PASS. [21] Estimating the variability of the cut points might make it easier to identify a sensible starting point.
There are several limitations that need to be kept in mind when evaluating this study. First, we did not use a standardized disability score. Although an earlier study found that different OCs depended on the measure of functional disability used [10], it may be that these differences are due to chance. Second, the collection of pain ratings differs from clinical practice. The pain intensity measure used here omitted a ‘‘no pain’’ anchor because it was preceded by a screening question, as typically used in epidemiological research. Because children without pain were not asked about their pain-related disability, these had to be omitted from the analysis. Furthermore, parental reports were gathered from children younger than 11 years, even though children’s self-reported pain should be used to guide clinical decisions from age 6 onward. [24] However, whereas clinical situations afford asking follow-up questions that resolve misunderstandings this is rarely possible in questionnaire-based research, it is prudent that the latter uses more strict criteria. As the source of information and anchors systematically affect pain intensity ratings, the cut points developed here may be most applicable to ratings collected that way. Third, no detailed diagnoses for the individual children were available. The only other study that investigated the variability of OCs also analyzed subsets of patients with homogeneous diagnoses (eg, chronic daily headache) and found similar levels of variability for all groups studied. [11] Furthermore, the cut points proposed here are most applicable to population-based samples, for which detailed diagnostic information is seldom available.
Conclusion
The present study aimed to establish cut points for the VAS that could be used in pediatric samples. Acknowledging the effect of variability, we found that it is not necessary to develop specialized cut points for children’s and adolescents’ pain intensity as assessed by parent and self-report. Rather, 35:60 could be used as cut points in both populations. We emphasize the need for more systematic studies in diagnostics. Specifically, we highlight the need to assess the performance of predefined cut points in prospective follow-up studies rather than defining new OCs for each sample studied. Although this has yielded a number of high-impact publications in the past, this also resulted in great uncertainty for individual researchers who utilize cut points in their analysis and clinicians who want to understand their patients’ pain.
Acknowledgements
The following data were used in this study: Public Use File KiGGS, German Health Survey for Children and Adolescents, 2003–2006, Robert Koch Institute, Berlin, Germany, 2008.
Conflict of interest statement
The authors report no conflict of interest
References:
Altman DG, Lausen B, Sauerbrei W, Schumacher M.
Dangers of using ‘‘optimal’’ cutpoints in the evaluation of prognostic factors.
J Natl Cancer Inst 1994;86:829–35.Altman DG, Royston P.
Statistics notes: the cost of dichotomising continuous variables.
BMJ 2006;332:1080.Bulloch B, Tenenbein M.
Assessment of clinically significant changes in acute pain in children.
Acad Emerg Med 2002;9:199–202.Dworkin RH, Turk DC, Wyrwich KW, Beaton D, Cleeland CS, Farrar JT. er al.
Interpreting the clinical importance of treatment outcomes
in chronic pain clinical trials: IMMPACT recommendations.
J Pain 2008;9:105–21.Ellert U, Neuhauser H, Roth-Isigkeit A.
Pain in children and adolescents in Germany: the prevalence and usage
of medical services. Results of the German Health Interview and
Examination Survey for Children and Adolescents (KiGGS).
Bundesgesundheitsblatt Gesundheitsforschung Gesundheitsschutz 2007;50:711–7.Ewald B.
Post hoc choice of cut points introduced bias to diagnostic research.
J Clin Epidemiol 2006;59:798–801.Farrar JT.
Cut-points for the measurement of pain:
the choice depends on what you want to study.
PAIN 2010;149:163–4.Farrar JT, Young Jr JP, LaMoreaux L, Werth JL, Poole RM.
Clinical importance of changes in chronic pain intensity
measured on an 11-point numerical pain rating scale.
PAIN 2001;94:149–58.Fedorov V, Mannino F, Zhang R.
Consequences of dichotomization.
Pharm Stat 2009;8:50–61.Fejer R, Jordan A, Hartvigsen J.
Categorising the severity of neck pain: establishment of
cut-points for use in clinical and epidemiological research.
PAIN 2005;119:176–82.Hirschfeld G, Zernikow B.
Variability of ‘‘optimal’’ cut points for mild, moderate, and
severe pain—neglected problems when comparing groups.
PAIN 2013;154:154–9.Kapstad H, Hanestad B, Langeland N, Rustoen T, Stavem K.
Cutpoints for mild, moderate and severe pain in patients with osteoarthritis
of the hip or knee ready for joint replacement surgery.
BMC Musculoskelet Disord 2008;9:55.Kurth BM, Kamtsiuris P, Holling H, Schlaud M, Dolle R, Ellert U.
The challenge of comprehensively mapping children’s health in a
nation-wide health survey: design of the German KiGGSStudy.
BMC Public Health 2008;8:196.Leeflang MMG, Moons KGM, Reitsma JB, Zwinderman AH.
Bias in sensitivity and specificity caused by data-driven
selection of optimal cutoff values: mechanisms, magnitude, and solutions.
Clin Chem 2008;54:729–37.Oldenmenger WH, de Raaf PJ, de Klerk C, van der Rijt CCD.
Cut points on 0–10 numeric rating scales for symptoms included in the
Edmonton Symptom Assessment Scale in cancer patients: a systematic review.
J Pain Symptom Manage 2013;45:1083–93.Powell CV, Kelly AM, Williams A.
Determining the minimum clinically significant difference
in visual analog pain score for children.
Ann Emerg Med 2001;37:28–31.Roth-Isigkeit A, Thyen U, Stoven H, Schwarzenberger J, Schmucker P.
Pain among children and adolescents: restrictions in
daily living and triggering factors.
Pediatrics 2005;115:e152–162.Ruyssen-Witrand A, Tubach F, Ravaud P.
Systematic review reveals heterogeneity in definition
of a clinically relevant difference in pain.
J Clin Epidemiol 2011;64:463–70.Serlin RC, Mendoza TR, Nakamura Y, Edwards KR, Cleeland CS.
When is cancer pain mild, moderate or severe?
Grading pain severity by its interference with function.
PAIN 1995;61:277–84.Tomlinson D, von Baeyer CL, Stinson JN, Sung L.
A systematic review of faces scales for the self-report
of pain intensity in children.
Pediatrics 2010;126:e1168–1198.Tubach F, Pham T, Skomsvoll JF, Mikkelsen K, Bjorneboe O.
Stability of the patient acceptable symptomatic state over
time in outcome criteria in ankylosing spondylitis.
Arthritis Rheum 2006;55:960–3.Tubach F, Ravaud P, Baron G, Falissard B, Logeart I, Bellamy N
Evaluation of clinically relevant changes in patient reported outcomes
in knee and hip osteoarthritis: the minimal clinically important improvement.
Ann Rheum Dis 2005;64:29–33.Voepel-Lewis T, Burke CN, Jeffreys N, Malviya S, Tait AR.
Do 0–10 numeric rating scores translate into
clinically meaningful pain measures for children?
Anesth Analg 2011;112:415–21.von Baeyer CL.
Children’s self-reports of pain intensity:
scale selection, limitations and interpretation.
Pain Res Manag 2006;11:157–62.von Baeyer CL, Spagrud LJ, McCormick JC, Choo E, Neville K, Connelly MA.
Three new datasets supporting use of the numerical rating scale
(NRS-11) for children’s self-reports of pain intensity.
PAIN 2009;143:223–7
Return to LOW BACK PAIN
Return to CHRONIC NECK PAIN
Return to OUTCOME ASSESSMENT
Since 10-03-2023
| Home Page | Visit Our Sponsors | Become a Sponsor |
Please read our DISCLAIMER |