

Baseline Characteristics May Help Indicate the Best Choice of
Health Care Provider for Back Pain Patients in Primary Care:
Results From a Prospective Cohort StudyThis section is compiled by Frank M. Painter, D.C.
Send all comments or additions to: Frankp@chiro.org


FROM: J Manipulative Physiol Ther. 2020 (Jan); 43 (1): 13–23 ~ FULL TEXT
Lisbeth Hartvigsen, DC, PhD, Alice Kongsted, MSc, PhD, Werner Vach, PhD, Louis-Rachid Salmi, MD, PhD, Lise Hestbaek, DC, PhD
Department of Sports Science and Clinical Biomechanics,
University of Southern Denmark,
Odense, Denmark
lha@rygklinik.dk

OBJECTIVE: Baseline characteristics of patients low back pain differ substantially between care settings, but it is largely unknown whether predictors are of equal importance across settings. The aim of this study was to investigate whether 8 known predictors relate differently to outcomes in chiropractic practice and in general practice and to which degree these factors may be helpful in selecting patients benefiting more from one setting or the other.
METHODS: Patient characteristics were collected at baseline, and outcomes of pain intensity (numeric rating scale 0-10) and activity limitation (Roland-Morris Disability Questionnaire 0-100) after 2, 12, and 52 weeks. Differences in the prognostic strength between settings were investigated for each prognostic factor separately by estimating the interaction between setting and the prognostic factor using regression models. Between-setting differences in outcome in high-risk and low-risk subgroups, formed by single prognostic factors, were assessed in similar models adjusted for a propensity score to take baseline differences between settings into account.
RESULTS: Prognostic factors were generally associated more strongly with outcomes in general practice compared with chiropractic practice. The difference was statistically significant for general health, duration of pain, and musculoskeletal comorbidity. After propensity score adjustment, differences in outcomes between settings were insignificant, but negative prognostic factors tended to be less influential in chiropractic practice except for leg pain and depression, which tended to have less negative impact in general practice.
CONCLUSION: Known prognostic factors related differently to outcomes in the 2 settings, suggesting that some subgroups of patients might benefit more from one setting than the other.
KEYWORDS: Cohort Study; Low Back Pain; Primary Health Care; Prognosis; Prognostic Factors
From the FULL TEXT Article:
Introduction
Low back pain (LBP) is the most common physical condition for which patients consult primary care clinicians, and thus the largest contributor to health care expenses in primary care, [1] and numbers are rising. [2]
Most evidence-based clinical guidelines recommend advice, education, exercises, and manual therapy as first-line treatments for LBP but offer no guidance as to which patients may benefit from which care pathways. [3, 4] An exception is the National Institute for Health and Care Excellence guidelines, which recommend considering the use of a risk stratification tool (eg, the STarT Back tool) for patients consulting a health care provider for a new episode of LBP. [5]
Low back pain is regarded as a multifactorial pain syndrome and biological, psychological, and social factors affect the course of LBP. [6] Historically, diagnosis is regarded as the primary guide to treatment and prognosis, but in the field of LBP, this model is challenged because a pathoanatomical cause cannot be identified in 85% of patients with LBP. [7] As a consequence, it is more useful for clinicians to use prognostic information from the patient history and clinical examination to inform their patients, to stratify patients for targeted intervention, or to identify specific factors in need of modification through treatment to improve patient outcomes. [8]
In line with other reviews,6 a systematic review including 20 studies (10,842 patients) found the most valuable prognostic factors of persistent disabling LBP at a 1–year follow-up to be poor general health, psychiatric comorbidities, maladaptive pain coping behaviors, nonorganic signs, and functional impairment. [9] Widespread pain, [6] previous episodes,6 patients’ recovery expectations, [10] leg pain location, [11, 12] and social factors, such as economic status and educational level, [13, 14] have also been shown to be associated with the course of LBP.
Several studies show that patient profiles differ between settings, [15–17] but it is largely unknown whether the aforementioned prognostic factors are of equal importance in different care settings and whether the presence or absence of any of these factors can indicate the best choice of care. One study investigated whether the prognostic ability of the STarT Back Tool was influenced by care setting (chiropractic practice [CP], general practice [GP], physiotherapy, and spine center) and found that it was unaffected by care setting on its own, but affected by a number of patient characteristics that differed among the 4 patient populations. [16]
Thus, the STarT Back Tool did not have the same prognostic ability in the 4 settings when used as an individual prognostic tool. Likewise, a study on patients’ expectations for recovery showed a stronger association with outcomes in GP compared with CP, [10] and a study on LBP patients visiting CP and GP found that one of the strongest predictors of outcomes was an interaction between care setting and pain below the knee, indicating less negative influence of leg pain in CP than in GP. [18] Identification of patient characteristics associated with better or worse outcomes in relation to different treatments/settings may help to individualize patient care pathways and thus improve outcomes.
The aim of this study was to investigate whether known prognostic factors (leg pain, nerve root involvement [NRI], duration of pain, general health, recovery expectations, depression, number of previous episodes, and musculoskeletal comorbidity) relate differently to pain intensity and activity limitation at 2–week, 3–month, and 1–year follow-ups in CP and GP, and to which degree these factors may be helpful in selecting patients who will benefit from one or the other of the 2 settings.
Methods
Setting and Participants
General practitioners and chiropractors invited patients with LBP to participate in a prospective observational study. General practitioners (n = 800) in the Region of Southern Denmark were invited to participate in a quality development initiative by the Audit Project Odense. Eighty-eight of them agreed to participate and to include LBP patients over a period of 10 weeks in 2011. [15]
Chiropractors (n = 36) from 17 chiropractic clinics in a Danish practice-based research network of the Nordic Institute of Chiropractic and Clinical Biomechanics agreed to include consecutive LBP patients from September 2010 until January 2012. Patient recruitment, in addition to the cohort, has previously been described in detail. [15, 19]
In Denmark, general practice care is fully reimbursed, whereas chiropractic care is only partially covered (20%–40%) by national health insurance. Chiropractors are authorized by The Danish Health and Medicines Authority to diagnose and treat patients without referral. Thus, apart from the financial issue, there are no formal differences between the doctor–patient encounter in the 2 settings. Patients received care as usual from their general practitioner or chiropractor, and this study was performed according to Danish law (DNcoBR, 2011). [20] The project was approved by the Danish Data Protection Agency (J-no. 2012-41-0762).
Patients were included if they sought care for LBP of any duration, with or without leg pain, were 18 to 65 years of age, could read and understand Danish, did not have any other pathology or inflammatory pain, did not require acute referral for surgery, and were not pregnant. Chiropractic patients were furthermore excluded if they had had more than 1 health care consultation for their LBP within the previous 3 months. Before giving consent, patients received oral and written information about the study procedures by the chiropractor or by a secretary.
Data Collection
Patients consulting GP were given the baseline questionnaire after the first consultation and were asked to complete it at home and return it to the research unit in a prepaid envelope. Chiropractic patients completed a baseline questionnaire in the reception area before the first consultation and returned it in a sealed envelope to the clinic secretary, who sent it to the research unit. In both settings, the included patients were given the 2–week follow-up questionnaire and a prepaid envelope at the initial consultation, and follow-up questionnaires were mailed after 3 months and after 1 year.
MeasurementsPatient-Reported Baseline Information Sociodemographic characteristics were as follows: age, sex, height (meters), weight (kilograms), physical workload (mainly sitting, sitting and walking, light physical work, or hard physical work), work status (9 categories compiled into employed, unemployed, or other), educational level (no qualification, vocational training, higher education of <3 years, higher education of 3–4 years, or higher education of >4 years), and smoking (smoker, ex-smoker, or nonsmoker). LBP characteristics included duration of pain (<2 weeks, 2–4 weeks, 1–3 months, or >3 months), previous LBP episodes (0, 1–3, or >3), LBP last year (≤30 days or >30 days), LBP intensity (typical intensity of LBP during the last week measured on a numeric rating scale [NRS] 0–10 [0: no pain, 10: worst imaginable pain]), [21–23] leg pain intensity (typical intensity of leg pain during the last week measured on an NRS 0–10 [0: no pain, 10: worst imaginable pain]), [21, 22, 24] sick leave (days off work owing to LBP within the previous month, proportion reporting any days), and activity limitation (Roland-Morris Disability Questionnaire [RMDQ] proportional score [0–100]). [23, 25, 26]
Psychological factors included recovery expectations measured on an NRS 0–10 (“How likely do you think it is that you will be fully recovered in 3 months?” [0: no chance, 10: high chance]), [10] depressive symptoms (Major Depression Inventory [MDI] 0–50, sum score), [27, 28] Fear-Avoidance Beliefs Questionnaire physical activity scale (0–24, sum score), and Fear-Avoidance Beliefs Questionnaire work scale (0–42, sum score). [29] General health was self-perceived and measured by the EuroQol-5D Visual Analogue Scale 0 to 100 (0: worst imaginable health state, 100: best imaginable health state).24,30 The STarT Back Tool used 3 prognostic profiles: low-, medium-, and high-risk groups for persisting LBP disability. [31–33]
Practitioner-Reported Baseline Information Pain location included local LBP, LBP and leg pain above the knee, and LBP and leg pain below the knee. NRI was determined, in GP, based on a yes/no question on the presence of abnormal neurologic findings and, in CP, based on a lumbar neurologic examination (straight leg raising test, femoral nerve stretch test, muscle strength, deep tendon reflexes, and sensitivity to touch or pinprick). Treatment plans were registered in CP as part of the examination form with 4 categories: manual treatment (6 options), advice or information (4 options), exercise (5 options), and other (3 options). In GP, registered by the general practitioner as part of a questionnaire with 3 categories: medication (8 options), nonpharmacological treatment or exercises (4 options), and referral (10 options). In both settings, this was recorded during the first consultation.
Outcomes
Outcomes were LBP intensity (NRS 0–10) and activity limitation (RMDQ 0–100) measured by questionnaires at 2–week, 3–month, and 12–month follow-ups.
Analyses
Baseline characteristics were summarized using proportions with 95% confidence intervals (CIs) for binary variables, and medians and 10th and 90th percentiles for continuous variables. Treatment in the 2 settings was described using proportions with 95% CIs. A dropout analysis was performed in relation to the prognostic factors, comparing patients who responded to the activity limitation questions at the 3–month follow-up with patients who did not respond. The analysis was performed in the 2 settings separately. Statistical significance of differences between groups was assessed by Pearson’s chi-square test for binary variables and by the Kruskal-Wallis test for continuous variables.
To facilitate comparisons, we dichotomized each potential prognostic factor aiming at a smaller group with poor prognosis (low-risk vs high-risk subgroups of patients). Cut points for dichotomization were chosen based on distribution of the data and consensus among the authors on what seemed most clinically relevant.
This resulted in the following definitions:
Pain location: No pain below the knee vs pain below the knee or signs of NRI
NRI: No signs of NRI vs signs of NRI
Duration of pain: <2 weeks vs ≥2 weeks
Previous episodes: <4 previous episodes vs ≥4 previous episodes
General health: 75% of patients reporting the best health vs 25% of patients reporting the worst health
Recovery expectations: 75% of patients reporting the highest recovery expectations vs 25% of patients reporting the lowest recovery expectations
Depressive symptoms: MDI ≤ 19 vs > 19 (19 suggested as an optimal cutoff score in a population-based sample [34])
Musculoskeletal comorbidity: Patients in GP were asked 3 questions:
Do you have:(1) “osteoarthritis?”
(2) “rheumatoid arthritis or other rheumatic disease?” and
(3) “pain in the neck and shoulders?”These variables were combined to create the variable musculoskeletal comorbidity (yes/no). Chiropractic patients were asked: “Do you have musculoskeletal pain other than LBP?”
Both outcomes showed a skewed distribution in our population at all 3 follow-up points, and hence we hesitated to use them as continuous outcomes in the primary analyses. To improve interpretation, we entered the outcome variables as ordinal outcomes based on the trichotomization <8, 8 to 29, and ≥30 for activity limitation, and 0, 1 to 3, and ≥4 for pain intensity. Values of NRS = 0 and RMDQ <8 correspond to patients considering themselves recovered. [35] The upper cut points were chosen as the 75th percentile of the full sample. Consequently, ordinal logistic regression was the main tool.
In the secondary analyses, we used the variables as continuous outcomes after log transformation in a linear regression model, thus avoiding potential loss of information owing to the trichotomization. Specifically, we transformed the outcomes to a scale from 0 to 100 and then used the transformation log(10 + x). In the interpretation of the results, we focused primarily on the 3–month outcomes because the 2–week follow-up may be too soon after initiating care, and after 12 months, the relation to the baseline status is reduced.
First, we focused on the association between each prognostic factor and outcome. We addressed this by first reporting risk ratios from a multinomial logistic regression model allowing to depict the relation across the whole outcome range (3 categories). Second, we used odds ratios (ORs) from an ordinal logistic regression model to illustrate the OR for belonging to the group with the worst outcome (activity limitation scores ≥30 or LBP intensity scores ≥4) by using the group with the best outcome (activity limitation scores <8 or LBP intensity scores = 0) as a reference category and ignoring the middle category.
This allowed a simple comparison of the 2 settings. The difference of the OR between the 2 settings was visualized in forest plots and assessed by introducing an interaction term between the prognostic factor and setting in the ordinal logistic regression model. Interactions above 1 indicated a stronger association between the prognostic factor and poor outcome in the GP setting than in the CP setting.
Next, we wanted to quantify differences in odds of poor outcome between the 2 settings within groups of patients defined as either high-risk or low-risk in relation to each prognostic factor. However, we had to take the substantial differences between the populations in the 2 settings into account. We approached this by a propensity score adjustment. [36, 37] In this approach, we first modeled the probability of belonging to each of the 2 settings as a function of potential prognostic factors. We used the predicted probability of visiting 1 setting, that is, the propensity score, and also its square as the covariate, in the ordinal logistic regression model to estimate the OR for poor outcome in GP vs CP for high-risk and low-risk subgroups, defined by each prognostic factor.
We reported the estimated between-setting outcome differences separately for the high-risk and low-risk groups, with ORs >1 indicating worse outcome in the GP setting, that is, an advantage of CP. The difference in ORs between high-risk and low-risk groups was assessed by the interaction term between setting and risk group. An interaction >1 can occur if the odds of poor prognosis are larger in GP than CP for both risk groups but are more pronouncedly so in the high-risk group, or if the odds of poor outcome are lower in GP than CP for low-risk patients and the reverse is true for high-risk patients, that is, there is an advantage for only the high-risk group in the CP setting. An interaction <1 can occur when the role of CP and GP are reversed.
Thus, interactions in this analysis were computed as the ratios between the OR (GP vs CP) in the high-risk groups and OR (GP vs CP) in the low-risk groups, with CIs and P values based on Wald tests, using the statistical independence of the 2 analyses.
Covariates to be included in the propensity score were chosen based on existing evidence on prognostic factors. [6, 38, 39] Thus, to investigate the feasibility of a propensity score–based analysis, we first generated a propensity score based on a logistic model including all variables described under patient-reported baseline information in addition to pain location and signs of NRI. We excluded, a priori, 37 participants with missing values in 7 more variables. Remaining missing values were handled by the missing indicator approach whenever at least 10 missing values were present in the variable. This way, 1,226 (of overall 1,274) participants could be included in the analysis.
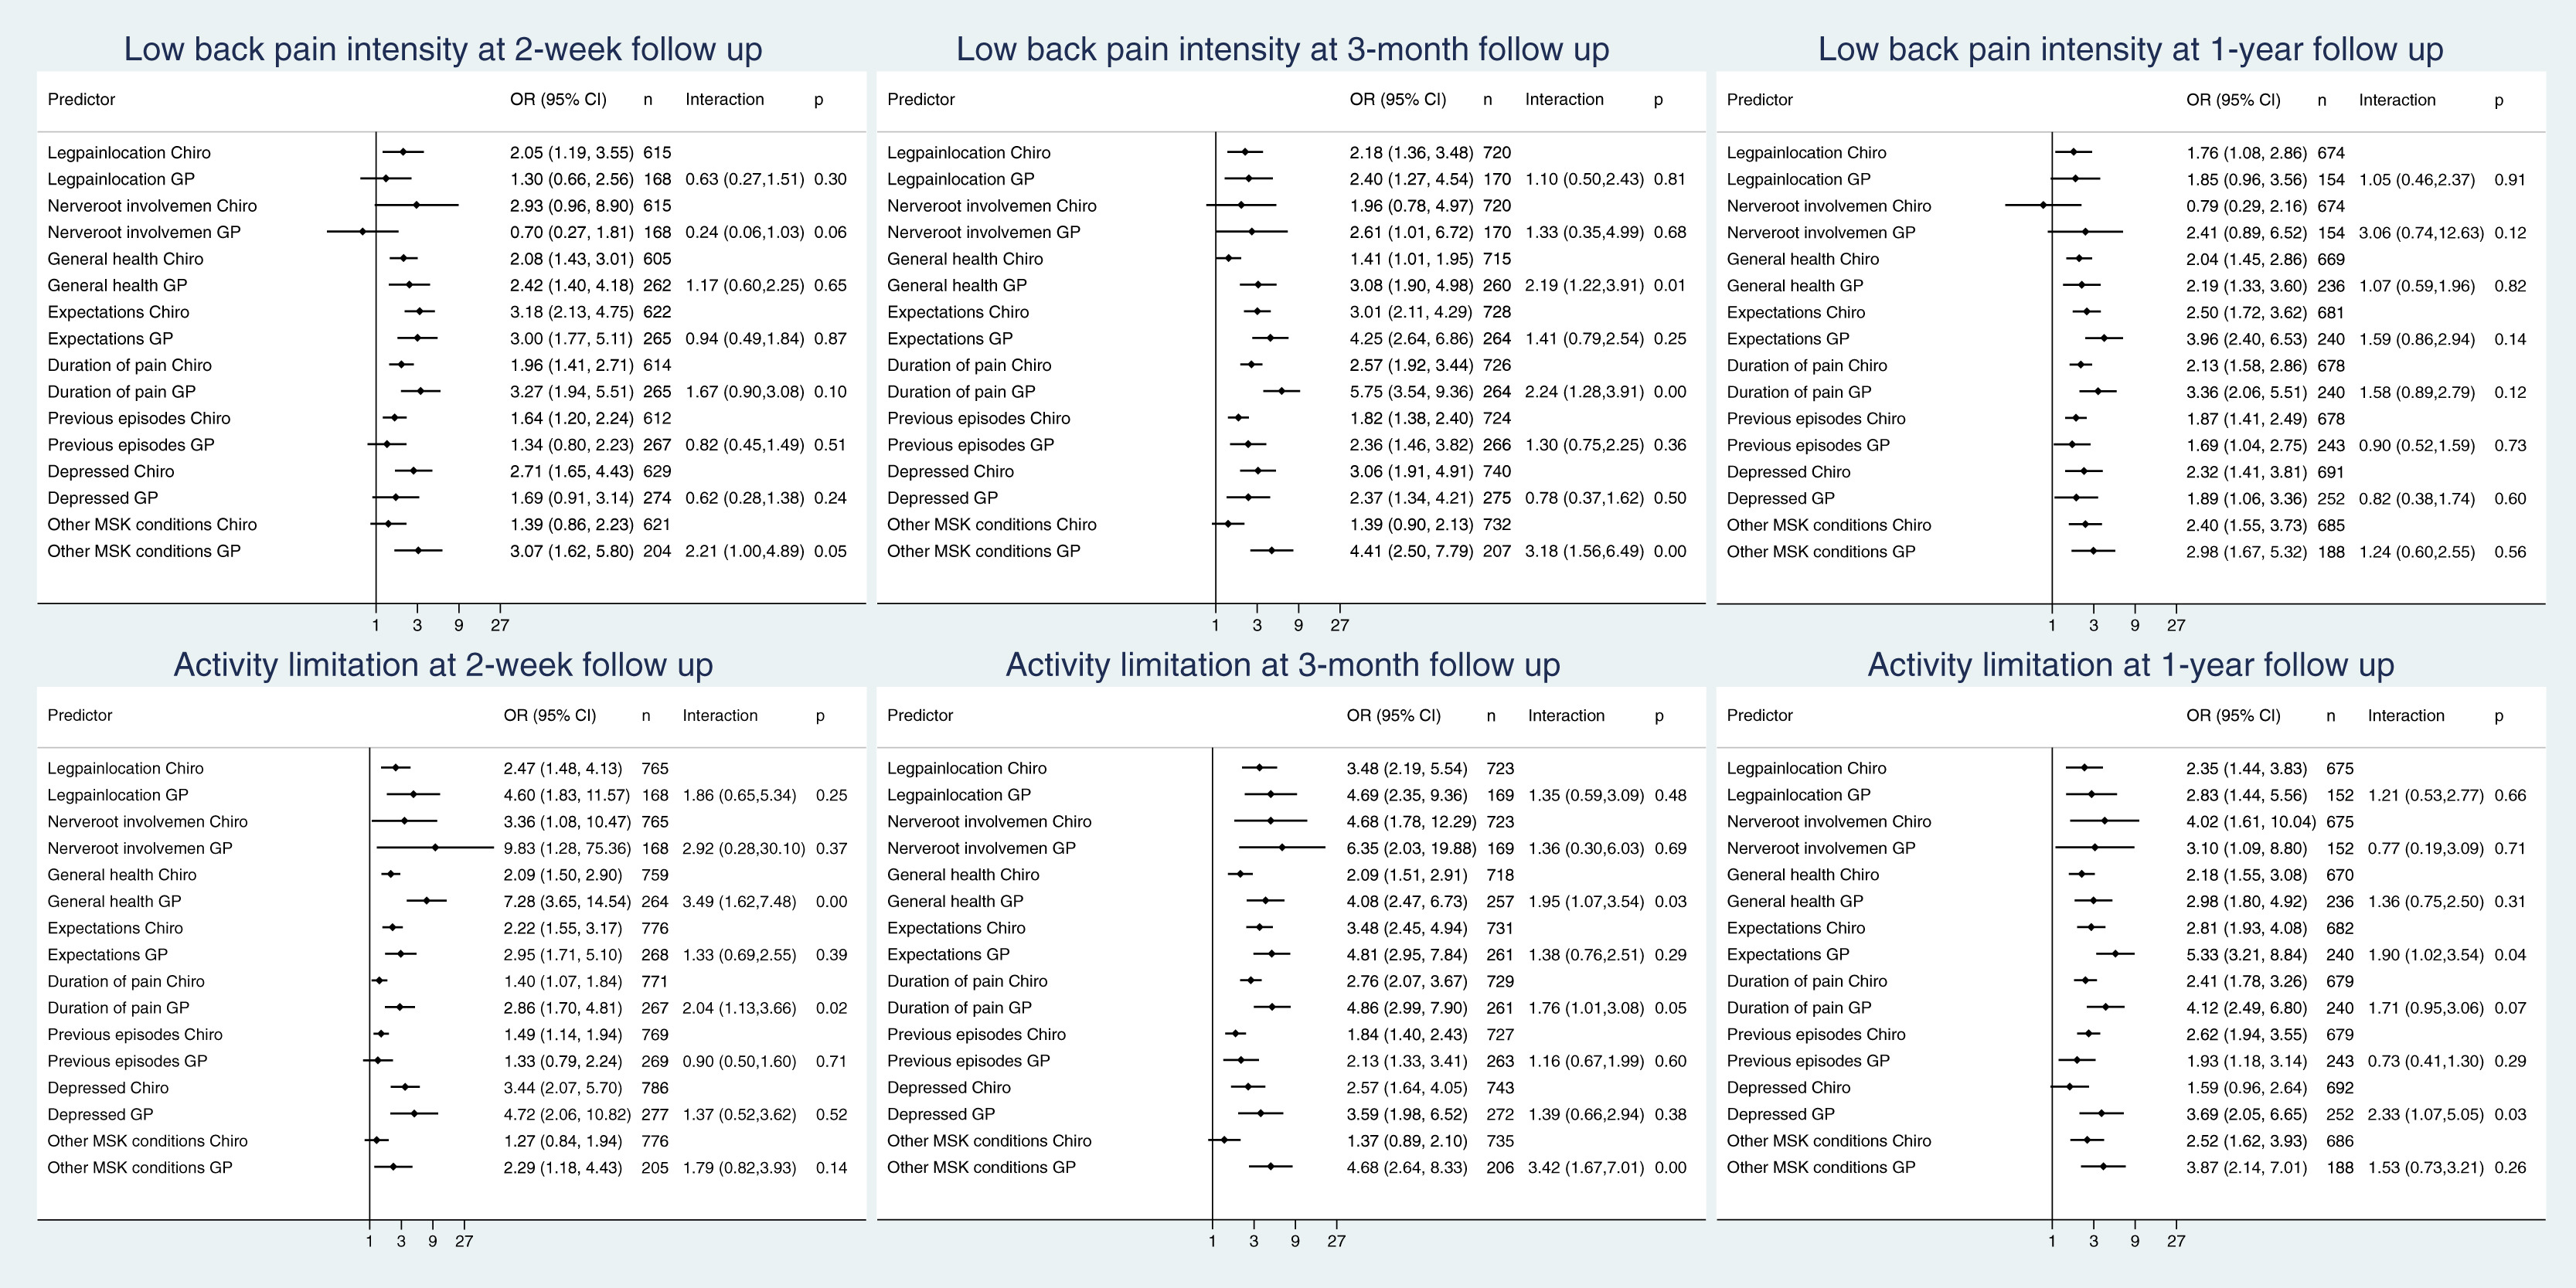
Figure 1
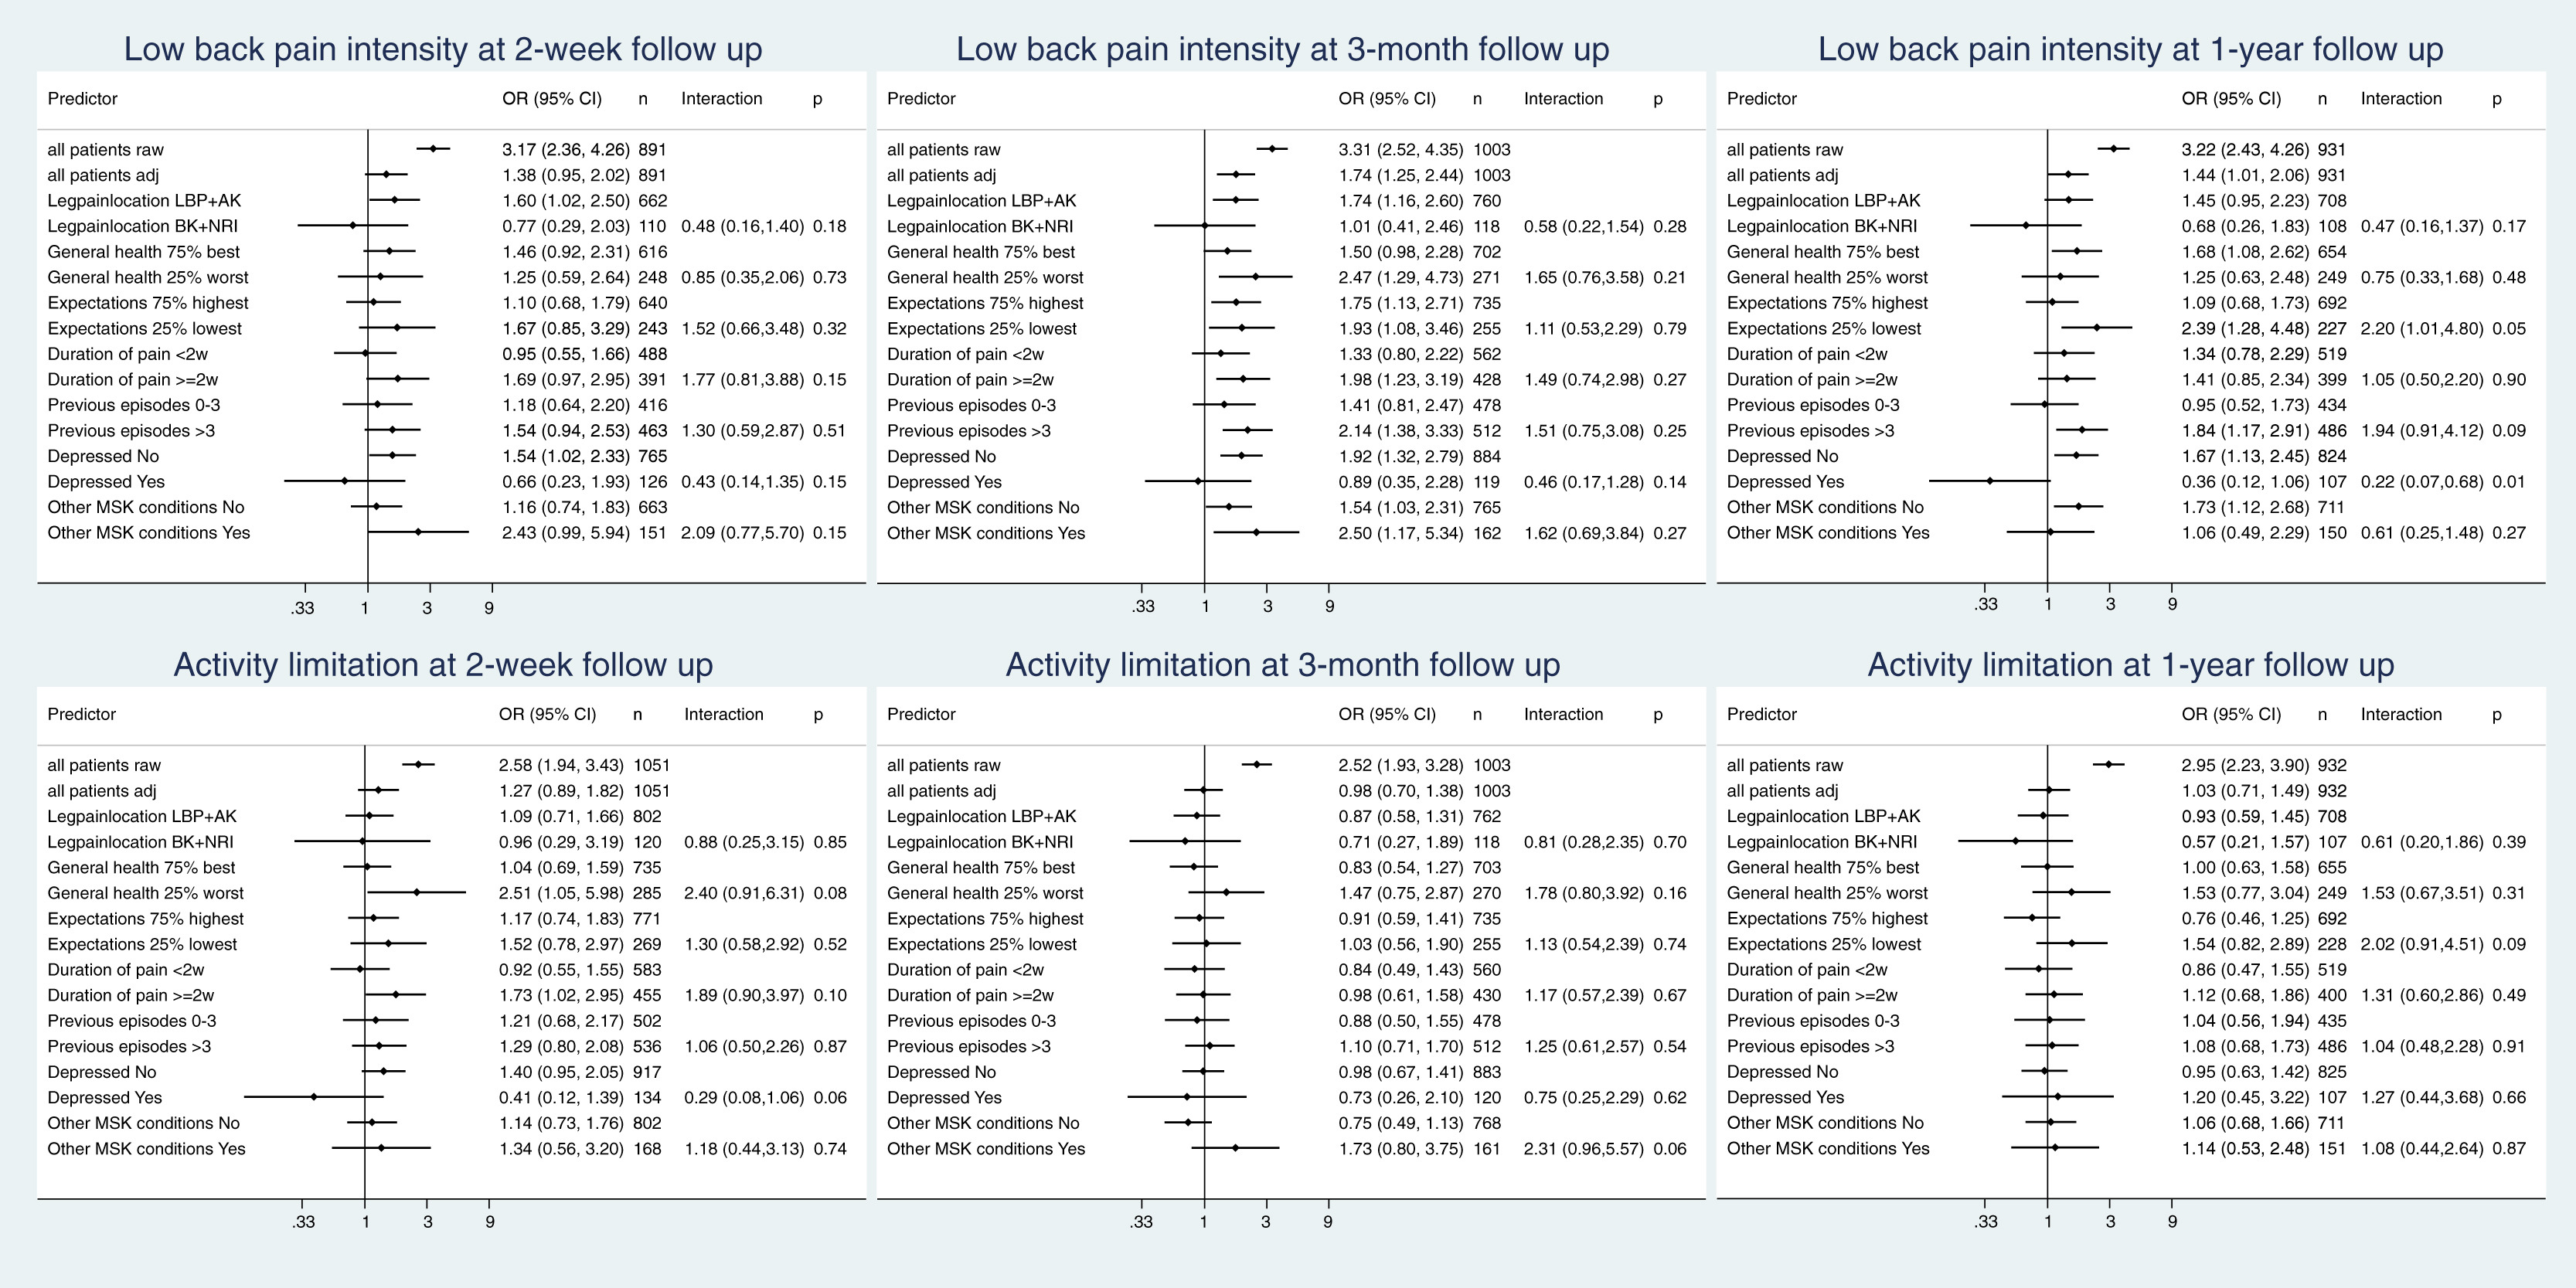
Figure 2 All continuous variables were entered in the model also with their square. The overlap of the propensity scores in the 2 patient groups was rather limited: the 75th percentile in the CP group was far below the 25th percentile in the GP group (Appendix A, Fig 1). To increase the overlap, we constructed a reduced model including age, sex, level of education, working status, pain location, duration of pain, number of previous episodes, general health, depression, patients’ recovery expectations, and musculoskeletal comorbidity, but again we observed a limited overlap (Appendix A, Figure 1). Because we were interested in the estimation of outcome differences between settings in subgroups, we considered a propensity score for each subgroup separately.
Based on the reduced model, we again observed a limited overlap in nearly all subgroups (Appendix A, Figure 2). These results reflect the substantial difference in the composition between the 2 populations. The limited overlap between the 2 populations implies that only a small proportion of the populations could actually contribute to the assessment of the adjusted outcome differences, and we had to expect rather wide CIs. Since we could not achieve any overlap in the group of patients with NRI, we excluded this factor from our further investigation. All analyses were performed using Stata 15.
Results

Table 1 The cohort (947 chiropractic patients and 324 patients from GP) has been described in previous publications. [15, 40] The average age was 44 years and 47% were women. Patients in GP were characterized by overall greater severity, for example, a higher percentage of patients with signs of NRI and poorer self-perceived general health (Table 1). The response rate at the 3–month follow-up was slightly lower in CP compared with GP (78% vs 84%). When comparing nonresponders with responders, nonresponders were younger (CP: 39 vs 45 years of age; GP: 42 vs 47 years of age), a larger proportion were men (CP: 62% vs 53%; GP: 63% vs 42%), and a larger proportion were depressed (CP: 16% vs 10%; GP: 60% vs 22%). In CP, a slightly larger proportion of the nonresponders reported low recovery expectations (26% vs 19%), whereas in GP, a smaller proportion of nonresponders compared with responders reported musculoskeletal comorbidity (14% vs 42%) and nonresponders reported a higher level of activity limitation (RMDQ proportional score of 74 vs 61) (Appendix B). Most patients in GP received some form of pain medication (85%), around half received nonpharmacologic treatment or exercises, one-fourth were referred for imaging, and 59% were referred to another health care provider. Almost all chiropractic patients received manual therapy, 90% received advice, and 70% received exercises (Appendix E).
Table 2
Table 3 Most of the prognostic factors were associated with both outcomes in both settings at all 3 follow-up points with increasing relative risks with increasing outcome level. Details for the 3–month follow-up are presented in Tables 2 and 3 and for the other follow-up points in Appendix C. Figure 1 illustrates the associations between the predictors and the 2 outcomes. The OR between predictor and outcome is depicted graphically for the 2 settings separately, followed by the actual figures. The last column shows the magnitude and the CI of the interaction term between setting and predictor. When comparing the prognostic value of each factor between the 2 settings at the 3–month follow-up (Fig 1), we observed a stronger association with poor outcome in the GP setting (interaction >1) in 15 of 16 comparisons, with the difference being most pronounced and reaching statistical significance for general health, duration of pain, and musculoskeletal comorbidity. This general tendency toward a more pronounced association between predictor and outcome in the GP setting was also observable—but less pronounced—at the 1–year follow-up and in relation to activity limitation at the 2–week follow-up (Fig 1). Similar results were seen when using log-transformed continuous outcomes in the secondary analyses, where, in addition, NRI was observed to have a stronger association with pain in the chiropractic setting than the GP setting at 2 weeks, but not at later points and not with activity limitation (Appendix D).
Figure 2 illustrates the associations between setting and outcome. The first 2 lines show the unadjusted and the adjusted overall OR for a poor outcome in the GP setting with the CP setting as reference, that is, OR >1 indicating worse outcome in the GP setting and <1 indicating worse outcome in the CP setting. This is followed by adjusted estimates of the between-setting outcome differences within the different subgroups. As in Figure 1, the last column displays the interaction term and its CI. In the first line, we observed ORs >1 reflecting worse outcome in the GP setting, which was expected owing to the higher number of high-risk patients in this setting as seen in Table 1. Indeed, when adjusting for the propensity score, the difference between settings regarding activity limitation almost disappeared, and the disadvantage of the GP setting regarding LBP intensity was much less pronounced (second line of the illustrations in Fig 2). However, our main interest was the difference in between-setting differences when comparing high-risk and low-risk patients.
After 3 months, we observed for 5 out of 7 prognostic factors, an interaction of >1 for both outcomes. For LBP intensity, this was due to a more pronounced advantage of CP in the high-risk groups than in the low-risk groups. For activity limitation, this was in 4 cases (general health, recovery expectations, previous episodes, and musculoskeletal comorbidity) owing to a lack of advantage for CP in the low-risk group, whereas the high-risk group had higher odds of poor outcome with GP. In 1 case (duration of pain), it was due to a less pronounced disadvantage of CP in the high-risk group. In 2 of 7 cases (leg pain and depression), we observed an interaction <1 for both outcomes. This was once due to a more pronounced advantage of CP in the low-risk group, once due to the presence of an advantage of GP only in the high-risk group, and twice due to a more pronounced advantage of GP in the high-risk group. Similar results were found at 2–week and 1–year follow-ups (Fig 2) and also when using log-transformed continuous outcomes (Appendix D). However, none of the interactions presented in Figure 2 reached statistical significance, which may be a consequence of the rather limited overlap in the propensity scores.
Discussion
To our knowledge, this is the first study to investigate whether known prognostic factors for patients with acute and chronic LBP relate differently to outcomes in CP and GP when taking a large number of baseline characteristics into account. We observed a tendency for prognostic factors to have a stronger prognostic value in GP than in CP. There are many possible explanations for this, for example, the overall substantial difference in risk composition between settings and a probability of cumulative risk with many high-risk prognostic factors co-occurring as seen to a larger degree in GP than in CP. However, it is also possible that one setting is more capable in managing the challenges associated with some high-risk patients.
Limitations
This study had some limitations, which include the following. When investigating in more detail whether one setting was more capable in managing the challenges associated with some high-risk subgroups, we had to realize that this question was difficult to answer. The patient populations in the 2 settings were very different with only a small subgroup of patients sharing a similar risk profile, rendering propensity score adjustment difficult. Consequently, adjusted estimates of the associations between outcome and setting could only be assessed with large uncertainty.
A larger sample, particularly from GP, would have increased the number of comparable patients, but is not likely to have provided a larger overlap between cohorts. Furthermore, the propensity score adjustment is imperfect, as the patient’s choice between the 2 settings might also depend on factors not measured in our data, for example, the patient’s previous experience with both settings. We have tried to take these limitations into account by not focusing on the absolute values of between-setting outcome differences but rather on the extent to which these differed when comparing high-risk and low-risk subgroups. Roughly speaking, such a comparison remains valid even if the estimated associations are biased, as long as the bias does not depend on the subgroups considered. The lack of adjustment for variables, like previous experience with the setting, is likely to imply the same bias in all subgroups.
When evaluating the value of our attempt to estimate outcome differences between settings from observational data, one should consider whether a randomized controlled trial could result in more valid estimates. Because the choice of the setting is probably based on personal experience, offering a randomized choice of the setting to patients may lead to a low recruitment rate, altered effects of expectations on outcome, and even worse, highly selective recruitment. Thus, the substantial differences in population between the 2 settings should not be seen as a specific limitation of our study, but rather as a genuine challenge of any comparison between settings.
Despite the challenges associated with adequate adjustment, when adjusting for the propensity score, the large observed advantage of the CP setting for the total cohort was strongly diminished; in fact, it almost disappeared in relation to activity limitation. When looking at subgroups, some interesting tendencies could be observed. For 5 factors, our results suggest a more pronounced potential advantage of CP in the high-risk groups compared with the low-risk groups. For the 2 remaining factors, depression and pain below the knee, we observed potentially more favorable results in the high-risk groups in the GP setting. The latter finding is in contrast to Nyiendo et al, [18] who found an advantage of a chiropractic setting over a GP setting for patients with leg pain below the knee.
However, this difference may be explained by longer pain duration in their sample (>6 weeks’ duration vs 0 to 4 weeks’ duration in 3 of 4 patients in our sample). Actually, for patients with longer duration of pain, we found a potential advantage of the chiropractic setting, which is in line with the findings from Nyiendo et al. [18] Patients with musculoskeletal comorbidity may be those for whom chiropractic could be expected to offer the most benefit, and indeed a potential advantage of the CP setting was observed here (Fig 2). In contrast, chiropractic has little to offer, specifically, for depressed patients, and hence it may not be surprising that we observed a potential advantage of GP for these patients.
Regardless of the explanation of the differences in associations, the practical implication is that when general medical practitioners and chiropractors inform their patients about the expected outcome in their setting, they may have to focus differently on different factors. For example, for outcomes at 3 months, musculoskeletal comorbidity and poor general health seem to play a larger role in the GP setting than in the chiropractic setting.
In many health care systems, the general practitioner acts as the primary contact and as a gatekeeper for people seeking care for LBP. Traditionally, however, general practitioners receive little training in managing musculoskeletal problems, and surveys indicate a lack of confidence in managing these conditions. [41] Therefore, other healthcare providers, including chiropractors, might be well suited as a primary contact for people with, for example, LBP. [42, 43] One counterargument for this has been that general practitioners are better at managing people with multimorbidity compared with, for example, chiropractors, who have a narrower scope of practice. [42, 43] However, our results did not support that patients with comorbidity are better cared for in GP compared with CP in relation to their LBP outcomes.
Loss to follow-up may have affected some of our results. For example, 60% of nonresponders in GP were depressed compared with only 22% of responders. We cannot exclude that there is a relation between the outcome and nonresponse and that this relation is different in low-risk and high-risk patients, which can bias estimates of the prognostic associations or setting differences.
Dichotomization of the potential prognostic variables inevitably results in loss of information when aiming to establish interactions. However, when using these factors in their continuous form, potential nonlinear relations and interactions must be considered, thus rendering analysis and interpretation difficult. Hence, we feel that dichotomization is helpful to improve clarity. The chosen cut points may also have affected the results. For example, we dichotomized depressive symptoms (MDI [total] > 19) based on a study by Forsell et al, who studied a general population sample from Sweden, [34] whereas Bech et al recommended a cut point of 26 based on a sample from a psychiatric department. [27] A cut point of 26 would have resulted in a very small group of depressed patients in our primary care cohort, which, in turn, would have resulted in very insecure estimates in the analyses, and because the subgroup of interest for our investigation was not clinically depressed patients but merely patients with higher scores compared with lower scores of depressive symptoms, we chose the lower cut point.
Categorization of the outcomes also results in loss of information. However, results from the sensitivity analyses using logarithmic transformed continuous outcomes were similar to results from the analyses using categorized outcomes, thereby increasing our confidence in the results based on the categorized outcomes.
All patients in our study received usual care—a dynamic entity in which health care providers ideally adjust their management of patients based on the latest evidence. Usual care is clearly not the same in CP and GP, and even within each setting, patients may experience differences among practitioners. Furthermore, during the course of a year, patients are likely to consult several health care providers. This is to be expected and, in our opinion, the overall care delivered reflects the usual care that patients would expect in the respective settings. Consequently, what we have investigated is the outcome to be expected based on the choice of initial care provider, recognizing that also other providers may be involved subsequently.
Conclusion
Most of the investigated prognostic factors for developing persistent pain and disability were more strongly associated with outcomes in the GP setting compared with the chiropractic setting. For 5 factors (duration of pain, previous episodes, general health, recovery expectations, and musculoskeletal comorbidity), our results indicated a more pronounced potential advantage of CP in the high-risk groups compared with the low-risk groups. For the 2 remaining factors, depression and pain below the knee, we observed potentially more favorable results in the high-risk groups in the GP setting. However, based on this study, we cannot deduce whether patients with LBP benefit the most from seeking care from a chiropractor or a general practitioner.
Practical Applications
Known prognostic factors tended to have a stronger prognostic value in general practice compared with chiropractic practice.
Patients with comorbidity were not better cared for in GP compared with CP in relation to their LBP outcomes.
Some high-risk groups may benefit more from one setting and some from another depending on their risk profile.
Appendix A–E. Supplementary data
Appendix A Propensity score analysis. Illustrates the propensity score distributions in the two settings.
Appendix B Drop out analysis.
Appendix C Associations between prognostic factors and both outcomes in both settings at all follow-up time points.
Appendix D Secondary analyses using outcome measures in their continuous form after log-transformation. Associations between prognostic factors and outcomes in chiropractic practice and in general practice. Interactions assess the difference in association between the two settings. Positive interactions indicate an advantage of the chiropractic setting, whereas negative interactions indicate an advantage of the general practice setting.
Appendix E Treatment provided to participating patients in the two settings.Funding Sources and Conflicts of Interest
Dr Hartvigsen received funding from The Danish Chiropractors’ Foundation and the Region of Southern Denmark for this study. The Nordic Institute of Chiropractic and Clinical Biomechanics and Dr Kongsted’s position at the University of Southern Denmark are financially supported by the Danish Chiropractors’ Foundation. Dr Hestbaek received funding for this project from The Danish Chiropractors’ Foundation and from IMK Almene Fond. The funding bodies had no role in the design, data collection, analysis, and interpretation of data in this study, nor in the writing of the manuscript. The funding bodies have not seen the submitted manuscript.
Contributorship Information
Concept development (provided idea for the research): L.Ha., L.H., A.K., W.V.
Design (planned the methods to generate the results): L.Ha., L.H., A.K., W.V., L.R.S.
Supervision (provided oversight, responsible for organization and implementation, writing of the manuscript): L.Ha., L.H., A.K., W.V.
Data collection/processing (responsible for experiments, patient management, organization, or reporting data): L.H., A.K.
Analysis/interpretation (responsible for statistical analysis, evaluation, and presentation of the results): L.Ha., L.H., A.K., W.V., L.R.S.
Literature search (performed the literature search): L.Ha., L.H., A.K.
Critical review (revised manuscript for intellectual content, this does not relate to spelling and grammar checking): L.Ha., L.H., A.K., W.V., L.R.S.
References:
Flachs EM, Eriksen L, Koch MB, et al.
Sygdomsbyrden i Danmark–sygdomme. Report. Statens Institut for Folkesundhed, Syddansk Universitet.
Křbenhavn: Sundhedsstyrelsen; 2015.United States Bone and Joint Initiative
The Burden of Musculoskeletal Diseases in the United States (BMUS). 3rd ed. Rosemont, IL; 2014.
(Available at:) http://www.boneandjointburden.org
Date accessed: May 3, 2016Wong JJ, Cote P, Sutton DA, et al.
Clinical Practice Guidelines for the Noninvasive Management of Low Back Pain:
A Systematic Review by the Ontario Protocol for Traffic Injury
Management (OPTIMa) Collaboration
European J Pain 2017 (Feb); 21 (2): 201–216Stochkendahl MJ, Kjaer P, Hartvigsen J et al.
National Clinical Guidelines for Non-surgical Treatment of Patients with
Recent Onset Low Back Pain or Lumbar Radiculopathy
European Spine Journal 2018 (Jan); 27 (1): 60–75National Institute for Health and Care Excellence.
Non-specific low back pain and sciatica: management. NICE guideline: short version.
November 2016. National Clinical Guideline Centre; 2016.Kent P.M. Keating J.L.
Can we predict poor recovery from recent-onset nonspecific low back pain? A systematic review.
Man Ther. 2008; 13: 12-28Deyo R.A. Rainville J. Kent D.L.
What can the history and physical examination tell us about low back pain?.
JAMA. 1992; 268: 760-765Croft P. Altman D.G. Deeks J.J. et al.
The science of clinical practice: disease diagnosis or patient prognosis?
Evidence about “what is likely to happen” should shape clinical practice.
BMC Med. 2015; 13: 20Chou R. Shekelle P.
Will this patient develop persistent disabling low back pain?
JAMA. 2010; 303: 1295-1302Kongsted, A., Vach, W., Axř, M., Bech, R.N., Hestbaek, L., Kongsted, A. (2014).
Expectation of Recovery from Low Back Pain: A Longitudinal Cohort
Study Investigating Patient Characteristics Related to Expectations
and the Association Between Expectations and 3-month Outcome
Spine (Phila Pa 1976). 2014 (Jan 1); 39 (1): 81–90Verwoerd A.J. Luijsterburg P.A. Lin C.W. Jacobs W.C. Koes B.W. Verhagen A.P.
Systematic review of prognostic factors predicting outcome in non-surgically treated patients with sciatica.
Eur J Pain. 2013; 17: 1126-1137Hartvigsen L, Hestbaek L, Lebouef-Yde C, Vach W, Kongsted A.
Leg Pain Location and Neurological Signs Relate to Outcomes
in Primary Care Patients with Low Back Pain
BMC Musculoskelet Disord. 2017 (Mar 31); 18 (1): 133Shmagel A, Foley R, Ibrahim H.
Epidemiology of Chronic Low Back Pain in US Adults: Data From
the 2009-2010 National Health and Nutrition Examination Survey
Arthritis Care Res (Hoboken) 2016 (Nov); 68 (11): 1688–1694Lacey R.J. Belcher J. Croft P.R.
Does life course socio-economic position influence chronic disabling pain in older adults?
A general population study.
Eur J Public Health. 2013; 23: 534-540Hestbaek L, Munck A, Hartvigsen L, Jarbol DE, Sondergaard J, Kongsted A.
Low Back Pain in Primary Care: A Description of 1250 Patients
with Low Back Pain in Danish General and Chiropractic Practice
Int J Family Med. 2014 (Nov 4); 2014: 106102Morso L. Kongsted A. Hestbaek L. Kent P.
The prognostic ability of the STarT Back Tool was affected by episode duration.
Eur Spine J. 2016; 25: 936-944Eklund A. Bergstrom G. Bodin L. Axen I.
Psychological and behavioral differences between low back pain populations:
a comparative analysis of chiropractic, primary and secondary care patients.
BMC Musculoskelet Disord. 2015; 16: 306Nyiendo J, Haas M, Goldberg B.
Pain, Disability, and Satisfaction Outcomes and Predictors of Outcomes:
A Practice-based Study hronic Low Back Pain Patients
Attending Primary Care and Chiropractic Physicians
J Manipulative Physiol Ther. 2001 (Sep); 24 (7): 433–439Kongsted, A, Kent, P, Hestbaek, L, and Vach, W.
Patients With Low Back Pain Had Distinct Clinical Course Patterns That Were Typically Neither
Complete Recovery Nor Constant Pain. A Latent Class Analysis of Longitudinal Data
Spine J. 2015 (May 1); 15 (5): 885–894National Committee on Health Research Ethics.
(Available at:) http://en.nvk.dk/rules-and-guidelines/act-on-research-ethics-review-of-health-research-projects
(Cited June 2010)Jensen M.P. Miller L. Fisher L.D.
Assessment of pain during medical procedures: a comparison of three scales.
Clin J Pain. 1998; 14: 343-349Manniche C. Asmussen K. Lauritsen B. Vinterberg H. Kreiner S. Jordan A.
Low Back Pain Rating scale: validation of a tool for assessment of low back pain.
Pain. 1994; 57: 317-326Lauridsen H.H. Hartvigsen J. Manniche C. Korsholm L. Grunnet-Nilsson N.
Responsiveness and minimal clinically important difference for pain and disability instruments
in low back pain patients.
BMC Musculoskelet Disord. 2006; 7: 82Chiarotto A. Terwee C.B. Ostelo R.W.
Choosing the right outcome measurement instruments for patients with low back pain.
Best Pract Res Clin Rheumatol. 2016; 30: 1003-1020Kent P. Lauridsen H.H.
Managing missing scores on the Roland Morris Disability Questionnaire.
Spine (Phila Pa 1976). 2011; 36: 1878-1884Albert H.B. Jensen A.M. Dahl D. Rasmussen M.N.
Criteria validation of the Roland Morris questionnaire. A Danish translation of the international scale
for the assessment of functional level in patients with low back pain and sciatica.
Ugeskrift Laeger. 2003; 165: 1875-1880Bech P. Rasmussen N.A. Olsen L.R. Noerholm V. Abildgaard W.
The sensitivity and specificity of the Major Depression Inventory, using the Present State Examination
as the index of diagnostic validity. J Affect Disord. 2001; 66: 159-164Nielsen M.G. Ornbol E. Bech P. Vestergaard M. Christensen K.S.
The criterion validity of the web-based Major Depression Inventory when used on clinical suspicion
of depression in primary care. Clin Epidemiol. 2017; 9: 355-365Waddell G. Newton M. Henderson I. Somerville D. Main C.J.
A Fear-Avoidance Beliefs Questionnaire (FABQ) and the role of fear-avoidance beliefs
in chronic low back pain and disability.
Pain. 1993; 52: 157-168Rabin R. de Charro F.
EQ-5D: a measure of health status from the EuroQol Group.
Ann Med. 2001; 33: 337-343Hill JC, Dunn KM, Lewis M, et al.
A Primary Care Back Pain Screening Tool:
Identifying Patient Subgroups For Initial Treatment
(The STarT Back Screening Tool)
Arthritis and Rheumatism 2008 (May 15); 59 (5): 632–641Morso L. Albert H. Kent P. Manniche C. Hill J.
Translation and discriminative validation of the STarT Back Screening Tool into Danish.
Eur Spine J. 2011; 20: 2166-2173Morso L. Kent P. Albert H.B. Hill J.C. Kongsted A. Manniche C.
The predictive and external validity of the STarT Back Tool in Danish primary care.
Eur Spine J. 2013; 22: 1859-1867Forsell Y.
The Major Depression Inventory versus Schedules for Clinical Assessment in Neuropsychiatry in a population sample.
Soc Psychiatry Psychiatr Epidemiol. 2005; 40: 209-213Kamper S.J. Maher C.G. Herbert R.D. Hancock M.J. Hush J.M. Smeets R.J.
How little pain and disability do patients with low back pain have to experience to feel that they have recovered?
Eur Spine J. 2010; 19: 1495-1501Brookhart M.A. Wyss R. Layton J.B. Sturmer T.
Propensity score methods for confounding control in nonexperimental research.
Circ Cardiovasc Qual Outcomes. 2013; 6: 604-611Austin P.C.
An introduction to propensity score methods for reducing the effects of confounding in observational studies.
Multivariate Behav Res. 2011; 46: 399-424Grotle M. Foster N.E. Dunn K.M. Croft P.
Are prognostic indicators for poor outcome different for acute and chronic low back pain consulters in primary care?
Pain. 2010; 151: 790-797Hayden J.A. Chou R. Hogg-Johnson S. Bombardier C.
Systematic reviews of low back pain prognosis had variable methods and results: guidance for future prognosis reviews.v J Clin Epidemiol. 2009; 62: 781-796.e1Eirikstoft H. Kongsted A.
Patient characteristics in low back pain subgroups based on an existing classification system.
A descriptive cohort study in chiropractic practice.
Man Ther. 2014; 19: 65-71Breen A. Austin H. Campion-Smith C. Carr E. Mann E.
“You feel so hopeless”: a qualitative study of GP management of acute back pain.
Eur J Pain. 2007; 11: 21-29Hartvigsen J. Foster N.E. Croft P.R.
We need to rethink front line care for back pain.
BMJ. 2011; 342: d3260Foster N.E. Hartvigsen J. Croft P.R.
Taking responsibility for the early assessment and treatment of patients with musculoskeletal pain:
a review and critical analysis.
Arthritis Res Ther. 2012; 14: 205
Return to LOW BACK PAIN
Since 2-24-2020
| Home Page | Visit Our Sponsors | Become a Sponsor |
Please read our DISCLAIMER |