

Clinical Decision Rule for Primary Care Patient
with Acute Low Back Pain at Risk
of Developing Chronic PainThis section is compiled by Frank M. Painter, D.C.
Send all comments or additions to: Frankp@chiro.org


FROM: Spine J. 2015 (Jul 1); 15 (7): 1577û1586 ~ FULL TEXT
OPEN ACCESS Wolf E. Mehling, MD, Mark H. Ebell, MD, MS,
Andrew L. Avins, MD, MPH, Frederick M. Hecht, MD
Department of Family Medicine,
University of California-San Francisco,
1545 Divisadero St,
San Francisco, CA 94115, USA
mehlingw@ocim.ucsf.edu
BACKGROUND CONTEXT: Primary care clinicians need to identify candidates for early interventions to prevent patients with acute pain from developing chronic pain.
PURPOSE: We conducted a 2ûyear prospective cohort study of risk factors for the progression to chronic pain and developed and internally validated a clinical decision rule (CDR) that stratifies patients into low-, medium-, and high-risk groups for chronic pain.
STUDY DESIGN/SETTING: This is a prospective cohort study in primary care.
PATIENT SAMPLE: Patients with acute low back pain (LBP, ≤30 days duration) were included.
OUTCOME MEASURES: Outcome measures were self-reported perceived nonrecovery and chronic pain.
METHODS: Patients were surveyed at baseline, 6 months, and 2 years. We conducted bivariate and multivariate regression analyses of demographic, clinical, and psychosocial variables for chronic pain outcomes, developed a CDR, and assessed its performance by calculating the bootstrapped areas under the receiver-operating characteristic curve (AUC) and likelihood ratios.
RESULTS: Six hundred five patients enrolled: 13% had chronic pain at 6 months and 19% at 2 years. An eight-item CDR was most parsimonious for classifying patients into three risk levels. Bootstrapped AUC was 0.76 (0.70û0.82) for the 6ûmonth CDR. Each 10ûpoint score increase (60ûpoint range) was associated with an odds ratio of 11.1 (10.8û11.4) for developing chronic pain. Using a less than 5% probability of chronic pain as the cutoff for low risk and a greater than 40% probability for high risk, likelihood ratios were 0.26 (0.14û0.48) and 4.4 (3.0û6.3) for these groups, respectively.
CONCLUSIONS: A CDR was developed that may help primary care clinicians classify patients with strictly defined acute LBP into low-, moderate-, and high-risk groups for developing chronic pain and performed acceptably in 1,000 bootstrapped replications. Validation in a separate sample is needed.
KEYWORDS: Acute pain; Chronic pain; Clinical decision rule; Low back pain; Prediction; Primary care
From The FULL TEXT Article
INTRODUCTION
Although most patients presenting with an episode of acute low back pain (LBP) in primary care will recover in six to eight weeks with or without medical intervention, [1, 2] those who subsequently develop chronic pain suffer considerably, [3] often are difficult to treat, and account for most LBP-related health expenses. [4] Primary care clinicians need decision support to identify candidates for early interventions for secondary prevention of chronic pain. Previous studies have identified risk factors for chronic pain, and have attempted to develop clinical decision rules for the primary care setting. [5, 6] The most important are the STarT-Back developed in the UK [7, 8] and the Chronic Pain Risk Screener (CPRS) developed in the US. [9] The STarT-BACK and several instruments developed in Europe (Írebro Musculoskeletal Pain Screening Questionnaire (ÍMPSQ) [10, 11], Kiel Pain Inventory and Avoidance-Endurance Questionnaire, [12, 13] and Heidelberger Kurz-Fragebogen (HKF) [14]) have not been evaluated in the US. Other limitations of the latter instruments are that they were not developed or validated in primary care patients and used delayed return-to-work as chronic pain outcomes, which only captures a subset of patients taking sick leave.
Both the STarT-BACK and CPRS have been well validated in patients shortly following an index visit at a primary care office. [15] However, these index visit patients included patients with a wide range of LBP duration; less than half suffered from acute LBP. Because patients who suffer LBP for more than 3 months already have a much worse prognosis, instruments that work for this population may not perform as well in patients with acute LBP. Hence, clinicians need a tool that only addresses the prognosis of patients with truly acute LBP. [1]
We therefore conducted a prospective cohort study to investigate the prognosis of patients with strictly defined acute LBP [16], and whether we can identify early risk factors that can help primary care clinicians determine a more accurate prognosis. If available such risk stratification would be feasible for primary care clinics and could potentially support physicians in treatment allocation decisions. We included questionnaire items representative of all risk factors known at the time of the cohortÆs inception and set out to develop a novel clinical decision rule (CDR).
METHODS
Patient Selection
The Prognosis of Pain (POP) study was a 2ûyear longitudinal telephone survey of 18û70 year old members of Kaiser Permanente, Northern California, the largest integrated health plan in its region with 2.4 million adult members at the time. Acute LBP was defined as back pain between the rib cage and buttocks of less than one month that was severe enough to seek medical care and was not preceded by any other episodes of LBP in the past year. The 1ûmonth criterion for acuteness of pain was chosen in part for pragmatic reasons, as we found that the time from scheduling a doctorÆs visit to being seen might be more than two weeks from the date of first pain onset. Patients were included if they spoke English and had no fever, history of cancer, chronic inflammatory disease, previous spine surgery, fibromyalgia, chronic pain conditions, disabling psychiatric diseases, or ongoing prescriptions for narcotics prior to the LBP episode. Patients with sciatica (i.e. LBP radiating below the knee), were not excluded.
A computer program screened electronic medical records to identify patients seen the day before for LBP, and a written invitation was sent by mail to join the study. This invitation offered a $20 gift certificate and did not reveal the inclusion criterion of pain duration; it therefore prioritized minimization of false reporting over larger numbers of ineligible respondents. Respondents were interviewed over the phone at baseline and 6 months. For the 2ûyear follow-up, participants, when reached (maximum of 3 attempts), were given a choice between a phone interview and an internet-based survey using SurveyGizmo (http://www.surveygizmo.com). [17] The study was approved by the Institutional Review Boards of the University of California, San Francisco and Kaiser Permanente. Two follow-up survey time points at 6 months and 2 years allowed us to determine consistency of predictors over time. The surveys were conducted between February 2008 and November 2010.
Baseline Measures

Table 1 In addition to the typical demographic items (age, sex, ethnicity, foreign born, education and income) we asked about marital status, employment status, heavy or monotonous work, job satisfaction, and smoking. The following clinical parameters were assessed at baseline: duration of current episode; history of prior episodes; pain-free interval before current episode; pain location(s); sciatica; pain intensity by 11ûpoint numeric rating scale (NRS) as average, worst, and most tolerable pain or average bothersomeness; McGill Pain Questionnaire; [18] Roland-Morris Disability Questionnaire (RMDQ); [19] and days on sick leave and of reduced daily activities. The complete 24ûitem ÍMPSQ, [11] 10ûitem HKF14 and the 4ûitem Perceived Stress Scale (PSS-4) [20] were included. Additional psychological predictor variables were selected from validated instruments according to strong factor loadings and face validity (Table 1).
To avoid overextensive participant burden from lengthy questionnaires we limited the survey to selected items expected to perform reasonably well when a reduced item set was needed. [21] In addition to the psychological items in ÍMPSQ and HKF, we included another fear-avoidance beliefs item from the Fear-Avoidance Beliefs Questionnaire (FABQ), [22] another catastrophizing item from the Coping Strategies Questionnaire (CSQ) [21] and two from the Pain Catastrophizing Scale (PCS). [23] As additional coping style items, we included ignoring and positive distracting using single items from the CSQ, seeking instrumental and emotional support using four items from CPCI [24û26] and KPI [27û29] and denial of stress using two items from Brief-COPE. [30] The 2ûitem version of the self-efficacy for pain subscale21 from Arthritis Self-Efficacy Scale was also included. Anxiety and depression were assessed by multiple ÍMPSQ and HKF items, and positive affect by one item from the CES-D [31] (Table 1).
NOTE: You may review the Pain Catastrophizing Scale at our Outcome Assessment Section
Follow-Up Outcome Measures
No gold standard or international consensus exists regarding the outcome definition for chronic LBP in cohort studies. Following recommendations from expert LBP epidemiologists in the Netherlands, [32] we applied a previously published primary outcome measure that combines a lack of perceived recovery (less than ômuch improvedö on a 6ûpoint Likert Perceived Recovery Scale) [33] with current pain intensity of 3 or more on 0û10 Numeric Rating Scale. [32, 34] Its accuracy was assessed for this population sample in a prior study. [34] In an exploratory fashion we also used a Grade 2 or higher chronic pain level according to the validated Graded Chronic Pain Scale (GCPS) by von Korff (this instrument yields a 4ûgrade-level chronic pain score as a function of pain intensity and pain-related disability for the past 6 months), but only for 2ûyear follow-up analyses, as it includes recall of the acute phase LBP at onset. [9]
Statistical Analyses
All analyses were conducted using Stata. [35] We proceeded in a series of analytic steps from bivariate to multivariate analysis of predictor variables, data and consensus-driven decisions for scoring and cut-off, and the calculation of areas under the receiver operating characteristic curve (AUC) and likelihood ratios for the resulting CDR.
Step 1 was raw bivariate logistic regression analysis of predictor variables for our primary outcome at 6 months and 2 years. We used individual items assessed at baseline as predictor variables. In addition, we compared the odds ratios for predictors of the primary 2ûyear outcome with those of the 2ûyear GCPS. We selected variables that were associated with our outcome at p <0.1 consistently at both time points for inclusion in Step 2.
Step 2 used the variables selected in Step 1 in multivariate logistic regression models and proceeded to stepwise backward elimination of the least supported variables. In addition, we analyzed the correlations between predictor variables and eliminated collinear redundant variables (r >.35) to arrive at the most parsimonious sets, separately for the 6ûmonth and the 2ûyear predictions.
Step 3 used the beta-coefficients of each of the final multivariable regression models (one predicting 6ûmonth outcomes, one predicting 2ûyear outcomes), multiplied by 10 and rounded to the closest half integer, to create two scoring rules. The performance of each scoring rule was assessed by bootstrapped analysis with 1,000 replications and calculation of the AUROCC and associated 95% confidence intervals (CIs).
Step 4 determined the number of patients who were positive or negative on our outcome measures for each point score. We then empirically identified reasonable cutoffs for low, moderate and high-risk groups based on discussion with content experts. A minimal risk group was defined as patients that have a less than 5% chance of developing chronic pain at 6 months and less than 10% at 2 years. Conversely, if a patient has a risk of 40% or more of developing chronic pain at either 6 months or 2 years, a clinician likely would consider closer follow-up office appointments and potentially more intensive early interventions to prevent chronic pain, and these were defined as a high-risk group. In the middle range, less intensive interventions may suffice until further follow-up assessments. By simple inspection of the table with the two patient groups being either positive or negative on the outcome for each score point, we determined the cut-off for the summary score and assessed the proportion of patients in each risk group.
Step 5: We calculated likelihood ratios with 95% confidence intervals (CIÆs) for the classification into these three risk groups by our CDR, according to the formula by Simel and colleagues. [36]
RESULTS
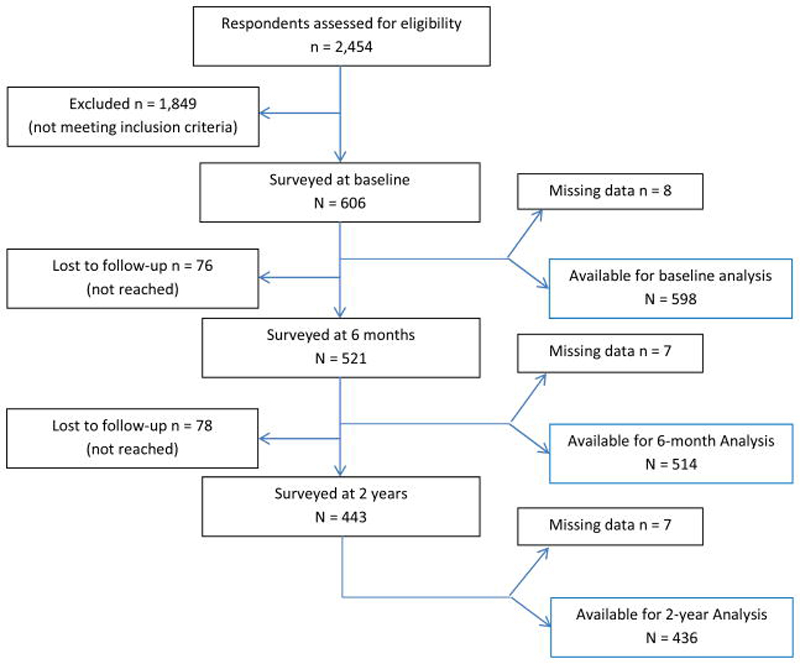
Figure 1 The Prognosis of Pain (POP) study enrolled 605 eligible members of Kaiser Permanente, Northern California (KPNC) from February 2008 to March 2009 (Figure 1). This represents 25% of the 2,454 respondents to invitations mailed to 42,650 patients who were seen for any kind of LBP in clinics of the health plan during the twelve months of recruitment. Overall, 521 participants (86%) responded at 6 months and 443 (73%) at the 2ûyear follow-up. The average age was 50.5 (▒12.6) years, 56% were female, 65% Caucasian-American, 18% foreign born, 61% had a college degree, and 59% were employed full-time (for further details, see 16) The sample represented the socioeconomic and ethnic diversity of primary care patients in the San Francisco Bay Area. [37] These patients sought medical care for pain of considerable intensity (average in past week 5.6 ▒1.8; 2.6 ▒1.8 when most tolerable; 8.6 ▒1.4 when worst; 11ûpoint NRS), bothersomeness (6.5 ▒2.3) and disability (mean Roland-Morris score 15.8 ▒4.7). The median duration of pain at baseline interview was 14 days; 8% had been on sick leave; and 27% had some sciatic pain to below the knee during this episode, 10% at the time of the interview. The final sample included 510 patients with complete 6ûmonth follow-up data and 443 patients with complete 2ûyear data. Using our primary combined outcome criterion, [34] 13% of the patients (95% confidence interval [CI], 10%û16%) experienced persistent or recurrent pain at 6 months and 19% (CI, 15%û22%) at 2 years after pain onset. [16] Numerous patients who self-reported as much improved at 6 months felt worse at 2 years (details in 16). Participants lost to follow-up were slightly younger and included slightly more females but did not differ in those variables that were included in the CDR.
Bivariate analyses (analysis Step 1)
All variable had <2% missing responses and were used without substitution. The following 12 variables had odds ratios at significance levels of p<0.1 for our primary outcome at both time points, five were protective and seven were predictive of chronic pain.Protective were:
completed college,predictive were
ability to walk for 1 hour,
ability to sleep tonight,
coping by TV or music, and
self-efficacy in ability to decrease pain;additional pain in upper back,Additional variables that satisfied at least one of our outcome criteria and the GCPS were
higher level of least pain since onset,
smoking,
catastrophizing (2 items),
expectancy of chronicity and
the need to holding onto something when getting off the sofa.perceived stress,
coping by ignoring,
coping by prayer,
belief that activity worsens pain,
anxiety or tension,
RMDQ items 2, 5, 18, 22,
yoga at baseline,
McGill overall pain intensity,
worst pain since onset,
sciatica since onset,
African-American ethnicity, and
being separated or widowed.No significant bivariate associations consistent across at least 2 outcome measures were found for age, sex, income level, born outside the US, duration of pain, sciatica at time of interview, average pain intensity since onset, pain level willing to tolerate, cut-down activity days, days in bed, days lost from work, retirement, job satisfaction, other RMDQ items, positive affect, enjoyment, positive thinking, depression, ability to do light work or household chores for 1 hour, heavy or monotonous work, multiple other pain-avoidance and catastrophizing items, coping by seeking a friend or talking with family member, staying active, detachment, reinterpretation, challenge appraisal, asking for instrumental or emotional support, other perceived stress or stress denial items.
Multivariate Analyses (analysis Step 2)
Table 2 After backward elimination, eight variables remained for the 6ûmonth prediction model and eight slightly different variables for the 2ûyear model. They are listed in Table 2 and discussed below. When using only these eight variables for each model, the regression models explained 16% (6ûmonth) and 10% (2ûyear) of the respective outcome variance. Using Grade 2 or higher of the GCPS as outcome (instead of our primary outcome combining perceived recovery with pain intensity) at 2 years provided similar results (not shown) for included parameters, AUC, and explained variance.
Point Score Creation (analysis Step 3)
Table 3 Table 3 shows the beta-coefficients and odds ratios for each model. Multiplying the beta coefficients by 10 and rounding to the closest half integer created the 6ûmonth and 2ûyear scoring rules. This method gives differential weights to individual predictors according to their beta-coefficients in the multivariate model. Note that multipliers for dichotomous items are based on values of 0 or 1, whereas continuous variables are multiplied by values between 0 and 10. The 6ûmonth scoring rule ranged from û25 to 34 points. Applied to our sample, the AUC was 0.78 (95% CI 0.72û0.84; Figure 1). Applying the bootstrap procedure for 1,000 replications, a 10ûpoint increase in the 60ûpoint score was associated with a 11.1 odds ratio (95% CI 10.8û11.4; p <0.001) for having chronic pain 6 months after baseline. After bootstrapping, the AUC was slightly lower: 0.76 (95% CI 0.70û0.82).
Using the same process for creating a scoring rule for the eight strongest predictor variables at the 2ûyear outcome, we obtained summary scores between û18 and 28.5. Applied to our sample at the 2ûyear follow-up, the AUC was 0.70 (95% CI 0.64û0.76; bootstrapped 0.69; 0.62û0.75). Applying the bootstrap procedure for 1,000 replications, a 10ûpoint increase in the score was associated with a 11.1 odds ratio (95% CI 10.7û11.5; p <0.001) for having chronic pain 2 years after baseline.
Selection of Cutpoints (analysis Step 4)
Table 4 After inspection of the outcomes table for each rule, we identified optimal score cut-offs for creating the three clinically-useful risk groups at 6 months and 2 years and assessed the proportion of patients in each risk group. The results are shown in Table 4.
Following a discussion among clinical colleagues, we assumed that a score with a predictive value of or near 5% would be a good cut-off for the lowest risk group, and that a 40% predictive value would be an appropriate cut-off for recommending further assessment and therapeutic measures. Applying these criteria to the 6ûmonth prediction, score cutoffs were less than û4 for low-risk and above +7 for high-risk groups. The low risk group included 47% of all patients, the mid-range risk group 38%, and the high-risk group 15%. The resulting proportions of chronic pain patients in the three risk groups were 3.8%, 14.1% and 39.7%, respectively.
Applying the 2ûyear decision rule in the 2ûyear follow-up dataset, we obtained scores between û18 and 28.5 and found that relatively low scores had a higher than 5% risk of developing chronic pain. We, therefore, chose a 10% cutoff for the low-risk group, maintained the 40% cutoff for the high-risk classification, and thus classified 49% as low risk at a score of ≤1, 36% as mid-level risk at scores of >1 and <9, and 15% as high risk with scores of ≥9.
Likelihood ratios (Analysis Step 5)
Likelihood ratios for correctly classifying patient into low, medium, and high-risk categories were 0.26 (95% CI 0.14û0.48), 1.08 (0.79û1.5), and 4.35 (3.0û6.3) at six months and 0.50 (0.34û0.72), 1.12 (0.82û1.52), and 3.14 (2.06û4.78), respectively, at 2 years (Table 4).
DISCUSSION
To the best of our knowledge, this is the first attempt to develop a clinical decision rule (CDR) for the prediction of chronic LBP among patients with strictly defined acute LBP of less than four weeks duration in the US. A variety of methods exists for developing such rules. [39, 39] This CDR was developed using multivariable logistic regression to help primary care clinicians decide whether a patient who presents with a new episode of non-specific LBP with or without sciatica is at risk of developing chronic pain and may warrant closer follow-up and potentially a more intensive therapeutic intervention. The CDR is limited to patients who had no LBP in the previous year and never had spine surgery. Prior CDRs were developed and validated in patients with LBP of any duration; a majority of these had pain for more than 3 months and already had a higher pre-test probability for persistent pain. When a CDR constructed of items that were identical or highly similar to the 9ûitem STarT-Back from the UK was applied in our sample, its performance was found unsatisfactory in patients with truly acute LBP. [40]
The variables included in the new CDRs reflect risk factors that have been found in prior studies: College education was protective and the only significant demographic predictor. [41] Pain spreading to the upper back was a consistent clinical risk factor. Sciatica [42] and difficulty sleeping [10] predicted poor outcomes at 6 months, the inability to walk for 1 hour [10] poor outcomes at 2 years. At both follow-ups, a coping style of watching TV or listening to music [43] was protective, whereas catastrophizing [44] and coping with pain by ignoring [13] were psychological risk factors. Five of eight predictor variables were identical for outcomes at our 2 follow-up time points, three were different. The expectancy of pain to persist was maladaptive at 6 months, [45, 46] while a low willingness to tolerate pain [14] and perceived stress [41, 42] increased risk at 2 years. We do not have an explanation for the difference.
The observed likelihood ratios for the 6ûmonth CDR of 0.26 (95% CI 0.14û0.48) for the low-risk and 4.4 (95% CI 3.0û6.3) for the high-risk classifications are moderately accurate. [47] The rule is likely to be clinically useful, as almost half of all patients fell into a low-risk group that was unlikely to develop chronic pain at 6 months. Approximately 15% of patients were classified as high-risk and may warrant more intensive interventions. The remaining 38% of mid-level risk patients, assessed at an average of 2 weeks (range 2û30 days) after pain onset, had a mean risk of 14% for developing chronic pain. They may warrant closer oversight by their primary care clinician than the low-risk group, but it may be justified to suggest waiting a bit longer before prescribing more intense and costly interventions.
We previously reported for this cohort that due to the recurring course of cLBP, individuals with persistent pain at 6 months were not identical to those at 2 years, and that the proportion of persistent pain patients had increased between the two follow-up time points. [16] Creating a 2ûyear decision rule with the 2ûyear follow-up made it impossible to use the 5% criterion as cutoff for low risk classification. We therefore used a 10% criterion but maintained the 40% risk for the high-risk classification cutoff. The results show that the prediction of the longer-term outcome is challenging in patients with strictly defined acute LBP. Longer-term predictions over years appear to be less precise than the prediction for 6 months, which is not surprising as the outcome is much further into the future than for the 6ûmonth CDR.
A scoring method that assigns weights to individual predictor variables may best be used by a programmed risk classification calculator rather than by hand but it increases the precision of the prediction. [38] Whereas the 6ûmonth CDR maybe most useful for the primary care clinical practice, the 2ûyear CDR maybe useful for long-term clinical research. Five of the predictive items for the 6ûmonth rule are identical with those for the 2ûyear rule. For validation of the rules in a separate sample and in particular for clinical application we would recommend assessing all eleven items, and then applying the relevant 8 items for 6ûmonth predictions and the slightly different set of 8 items for a 2ûyear prediction.
The main limitation of our study is that we have not assessed the decision rulesÆ performance in a separate validation sample. The observed variance in these predictor item scores among study participants with acute LBP early into their episode is rather large and reduces their predictive power. Moreover, as shown for this cohort, a high recurrence rate leads to different individuals having persistent pain at different time points. [16] This variance creates a challenge for creating a rule that performs strongly with patients where it is most needed, early in the course of a new episode of LBP.
A second limitation is that we included only questionnaire items that were known to be potentially predictive at the time of the studyÆs implementation. Somatization, [48] reduced levels of body awareness, [49] and potentially many others may be further parameters of predictive value and were not included in our questionnaire. However, we included a wide range of demographic, clinical and psychological predictor variables carefully chosen according to the best knowledge of the time.
A third limitation is that we relied on diagnostic codes from electronic medical records created by primary care providers and patient self-report. It is possible that clinical findings that indicate a more severe baseline condition, such as positive signs for spinal nerve compression or spinal claudication from spinal stenosis, can be identified as important risk factors for chronic pain at the very first onset of LBP by clinical exam and imaging studies. However, current clinical guidelines do not recommend imaging in the first weeks after new-onset LBP in patients who most likely would not need an immediate referral to a spine surgeon. Future studies would benefit from clinical exams at study entrance.
A fourth potential limitation is that the study population did not include uninsured patients; only 3% reported annual household incomes below $25,000. However, income level was not predictive of the outcome.
CONCLUSION
Despite these limitations, we conclude that our study provides a clinical decision rule that is urgently needed for one of the most frequent and most costly conditions in primary care. [50] It contains 8 items for the 6ûmonth and 8 items for the 2ûyear risk classification (5 are common to both) into 3 levels of risk for developing chronic pain in patients presenting in primary care with a new-onset episode of strictly defined acute low back pain. The next step is to prospectively validate this tool in an independent population.
Acknowledgments
This study was supported by NIH/NCCAM grants K23 AT002298 (Mehling), R21 AT004467 (Mehling), NIH/NCCAM K24 AT007827 (Hecht), the Research Evaluation and Allocation Committee (REAC) of the University of California San Francisco, and the Mount Zion Health Fund, San Francisco. The funding agencies played no role in design and conduct of the study; collection, management, analysis, and interpretation of the data; and preparation, review, or approval of the manuscript.
We would like to acknowledge the cooperation of the many patients who took time to answer our surveys in spite of being in pain and thank them. We would like to thank Timothy S. Carey, MD, MPH, for his contributions to study design, item selection and manuscript review, Alice Pressman for creating the computer program for the electronic medical records, Viranjini Gopisetty and Elizabeth Bartmess for project management, Pete Bogdanos for research assistance and the many volunteers who helped with the interviews.
References:
Pengel LH, Herbert RD, Maher CG, Refshauge KM.
Acute low back pain: systematic review of its prognosis.
Bmj. 2003;327(7410):323Von Korff M, Saunders K.
The course of back pain in primary care.
Spine. 1996;21(24):2833û2837. discussion 2838û2839Wolter T, Szabo E, Becker R, Mohadjer M, Knoeller SM.
Chronic low back pain: course of disease from the patientÆs perspective.
Int Orthop. 2011;35(5):717û724Dagenais S, Caro J, Haldeman S.
A Systematic Review of Low Back Pain Cost of Illness Studies
in the United States and Internationally
Spine J 2008 (Jan); 8 (1): 8û20Borkan J, Van Tulder M, Reis S, Schoene ML, Croft P, Hermoni D.
Advances in the field of low back pain in primary care:
a report from the fourth international forum.
Spine. 2002;27(5):E128û132Borkan JM, Koes B, Reis S, Cherkin DC.
A report from the Second International Forum for Primary Care Research
on Low Back Pain. Reexamining priorities.
Spine. 1998;23(18):1992û1996Hill JC, Dunn KM, Lewis M, et al.
A Primary Care Back Pain Screening Tool:
Identifying Patient Subgroups For Initial Treatment
(The STarT Back Screening Tool)
Arthritis and Rheumatism 2008 (May 15); 59 (5): 632û641Hill JC, Whitehurst DG, Lewis M, et al.
Comparison of Stratified Primary Care Management For Low Back Pain
With Current Best Practice (STarT Back): A Randomised Controlled Trial
Lancet. 2011 (Oct 29); 378 (9802): 1560û1571Von Korff M, Ormel J, Keefe FJ, Dworkin SF.
Grading the severity of chronic pain.
Pain. 1992;50(2):133û149Linton SJ, Boersma K.
Early identification of patients at risk of developing a persistent back problem:
the predictive validity of the Orebro Musculoskeletal Pain Questionnaire.
Clin J Pain. 2003;19(2):80û86Linton SJ, Hallden K.
Can we screen for problematic back pain? A screening questionnaire for predicting
outcome in acute and subacute back pain.
Clin J Pain. 1998;14(3):209û215Hasenbring M.
Risikofaktoren und gesundheitsfoerderndes Verhalten
{Risk factors and health promoting behaviour in the transition of acute to chronic
disc related low back pain} 1992.
Chronifizierung bandscheibenbedingter Schmerzen.Hasenbring MI, Hallner D, Klasen B, Streitlein-Bohme I.
Pain-related avoidance versus endurance in primary care patients with
subacute back pain: Psychological characteristics and outcome at a 6-month follow-up.
Pain. 2012;153(1):211û217Neubauer E, Junge A, Pirron P, Seemann H, Schiltenwolf M.
HKF-R 10 - Screening for predicting chronicity in acute low back pain (LBP):
A prospective clinical trial.
Eur J Pain. 2006;10(6):559û566Turner JA, Shortreed SM, Saunders KW, Leresche L, Berlin JA.
Optimizing prediction of back pain outcomes.
Pain. 2013;154(8):1391û1401Mehling WE, Gopisetty V, Bartmess E, et al.
The prognosis of acute low back pain in primary care in the United States:
a 2-year prospective cohort study.
Spine (Phila Pa 1976) 2012;37(8):678û684surveygizmo.
4888 Pearl East Cir. Suite 399W, Boulder, CO 80301, USA: 2010.
www.surveygizmo.comMelzack R.
The McGill Pain Questionnaire: major properties and scoring methods.
Pain. 1975;1(3):277û299Roland M, Morris R.
A study of the natural history of back pain. Part I:
development of a reliable and sensitive measure of disability in low-back pain.
Spine. 1983;8(2):141û144Cohen S.
Perceived Stress Scale (PSS)
http://www.psy.cmu.edu/~scohen/Jensen MP, Keefe FJ, Lefebvre JC, Romano JM, Turner JA.
One- and two-item measures of pain beliefs and coping strategies.
Pain. 2003;104(3):453û469Waddell G, Newton M, Henderson I, Somerville D, Main CJ.
A Fear-Avoidance Beliefs Questionnaire (FABQ) and the role of fear-avoidance beliefs
in chronic low back pain and disability.
Pain. 1993;52(2):157û168Sullivan MJL, Bishop SR, Pivik J.
The Pain Catastrophizing Scale: Development and validation.
Psychological Assessment. 1995;7(4):524û532.Truchon M, Cote D.
Predictive validity of the Chronic Pain Coping Inventory in subacute low back pain.
Pain. 2005;116(3):205û212Jensen MP, Turner JA, Romano JM, Strom SE.
The Chronic Pain Coping Inventory: development and preliminary validation.
Pain. 1995;60(2):203û216Hadjistavropoulos HD, MacLeod FK, Asmundson GJ.
Validation of the Chronic Pain Coping Inventory.
Pain. 1999;80(3):471û481Hallner D, Hasenbring M.
Classification of psychosocial risk factors (yellow flags) for the development
of chronic low back and leg pain using artificial neural network.
Neurosci Lett. 2004;361(1û3):151û154Hasenbring M.
Kieler Schmerz Inventar (KSI) Handlungsanweisung {KPI manual}
American version available. 1994.Hasenbring M, Hallner D, Klasen B.
Psychological mechanisms in the transition from acute to chronic pain:
over- or underrated?
Schmerz. 2001;15(6):442û447Carver CS.
You want to measure coping but your protocolÆs too long: consider the brief COPE.
Int J Behav Med. 1997;4(1):92û100Radloff L.
The CES-D Scale: a self-report depression scale for research in the general population.
Appl Psychol Meas. 1977;1:385û401.de Vet HC, Terluin B, Knol DL, et al.
Three ways to quantify uncertainty in individually applied ôminimally
important changeö values.
J Clin Epidemiol. 2009Beurskens AJ, de Vet HC, Koke AJ.
Responsiveness of functional status in low back pain: a comparison of different instruments.
Pain. 1996;65(1):71û76Mehling WE, Gopisetty V, Acree M, et al.
Acute low back pain and primary care: how to define recovery and chronification?
Spine (Phila Pa 1976) 2011;36(26):2316û2323Stata12.
StataCorp; College Station, Texas 77845 USA: 2013.
http://www.stata.comSimel DL, Samsa GP, Matchar DB.
Likelihood ratios with confidence: sample size estimation for diagnostic test studies.
J Clin Epidemiol. 1991;44(8):763û770Gordon NP.
How Does the Adult Kaiser Permanente Membership in Northern California
Compare with the Larger Community?
Unpublished Work. 2006
summary at
http://www.dor.kaiser.org/external/uploadedFiles/content/research/
mhs/Other_Reports/mhs_project_trends-1993-2005_notes.pdfGrobman WA, Stamilio DM.
Methods of clinical prediction.
Am J Obstet Gynecol. 2006;194(3):888û894Laupacis A, Sekar N, Stiell IG.
Clinical prediction rules. A review and suggested modifications of methodological standards.
Jama. 1997;277(6):488û494Brage S, Sandanger I, Nygard JF.
Emotional distress as a predictor for low back disability: a prospective 12-year
population-based study.
Spine. 2007;32(2):269û274Hayden JA, Chou R, Hogg-Johnson S, Bombardier C.
Systematic reviews of low back pain prognosis had variable methods and
results-guidance for future prognosis reviews.
J Clin Epidemiol. 2009Villarreal EA, Brattico E, Vase L, Ostergaard L, Vuust P.
Superior analgesic effect of an active distraction versus pleasant unfamiliar
sounds and music: the influence of emotion and cognitive style.
PLoS One. 2012;7(1):e29397Picavet HS, Vlaeyen JW, Schouten JS.
Pain catastrophizing and kinesiophobia: predictors of chronic low back pain.
American journal of epidemiology. 2002;156(11):1028û1034Boersma K, Linton SJ.
Expectancy, fear and pain in the prediction of chronic pain and disability:
a prospective analysis.
Eur J Pain. 2006;10(6):551û557Linton SJ.
A review of psychological risk factors in back and neck pain.
Spine. 2000;25(9):1148û1156Grimes DA, Schulz KF.
Refining clinical diagnosis with likelihood ratios.
Lancet. 2005;365(9469):1500û1505Melloh M, Elfering A, Stanton TR, et al.
Who is likely to develop persistent low back pain? A longitudinal analysis
of prognostic occupational factors.
Work. 2013;46(3):297û311Mehling WE, Daubenmier J, Price CJ, Acree M, Bartmess E, Stewart AL.
Self-reported interoceptive awareness in primary care patients with past
or current low back pain.
Journal of pain research. 2013;6:403û418Hoy D, Bain C, Williams G, et al.
A systematic review of the global prevalence of low back pain.
Arthritis Rheum. 2012;64(6):2028û2037Roland M, Morris R.
A study of the natural history of back pain. Part I:
Development of a reliable and sensitive measure of disability in low-back pain.
Part II: Development of guidelines for trials of treatment in primary care.
Spine. 1983;8(2):141û150Neubauer E, Pirron P, Junge A, Seemann H, Schiltenwolf M.
What questions are appropriate for predicting the risk of chronic disease in
patients suffering from acute low back pain?
Zeitschrift fur Orthopadie und ihre Grenzgebiete. 2005;143(3):299û301Neubauer E, Junge A, Pirron P, Seemann H, Schiltenwolf M.
HKF-R 10 - Screening for predicting chronicity in acute low back pain (LBP):
A prospective clinical trial.
Eur J Pain. 2005
Return to LOW BACK PAIN
Return to CLINICAL PREDICTION RULE
Return to DIAGNOSIS AND MANAGEMENT
Since 10-31-2016
| Home Page | Visit Our Sponsors | Become a Sponsor |
Please read our DISCLAIMER |