

Differential Patient Responses to Spinal Manipulative Therapy
and their Relation to Spinal Degeneration and
Post-treatment Changes in Disc DiffusionThis section is compiled by Frank M. Painter, D.C.
Send all comments or additions to: Frankp@chiro.org


FROM: European Spine Journal 2019 (Feb); 28 (2): 259–269 ~ FULL TEXT
Arnold Y. L. Wong, Eric C. Parent, Sukhvinder S. Dhillon, Narasimha Prasad, Dino Samartzis, Gregory N. Kawchuk
Department of Physical Therapy,
University of Alberta,
Edmonton, AB, Canada.
arnold.wong@polyu.edu.hk
PURPOSE: Our prior study revealed that people with non-specific low back pain (LBP) who self-reported a > 30% improvement in disability after SMT demonstrated significant post-treatment improvements in spinal stiffness, dynamic muscle thickness and disc diffusion, while those not having self-reported improvement did not have these objective changes. The mechanism underlying this differential post-SMT response remains unknown. This exploratory secondary analysis aimed to determine whether persons with non-specific LBP who respond to spinal SMT have unique lumbar magnetic resonance imaging (MRI) findings compared to SMT non-responders.
METHODS: Thirty-two participants with non-specific LBP received lumbar MRI before and after SMT on Day 1. Resulting images were assessed for facet degeneration, disc degeneration, Modic changes and apparent diffusion coefficient (ADC). SMT was provided again on Day 4 without imaging. SMT responders were classified as having a ≥ 30% reduction in their modified Oswestry disability index at Day 7. Baseline MRI findings between responders and non-responders were compared. The associations between SMT responder status and the presence/absence of post-SMT increases in ADC values of discs associated with painful/non-painful segments as determined by palpation were calculated. In this secondary analysis, a statistical trend was considered as a P value between 0.05 and 0.10.
RESULTS: Although there was no significant between-group difference in all spinal degenerative features (e.g. Modic changes), SMT responders tended to have a lower prevalence of severely degenerated facets (P = 0.05) and higher baseline ADC values at the L4–5 disc when compared to SMT non–responders (P = 0.09). Post hoc analyses revealed that 180 patients per group should have been recruited to find significant between–group differences in the two features. SMT responders were also characterized by significant increases in post–SMT ADC values at discs associated with painful segments identified by palpation (P < 0.01).
There are more articles like this @ our:
LOW BACK PAIN Page and our
DISC HERNIATION & CHIROPRACTIC PageCONCLUSIONS: The current secondary analysis suggests that the spines of SMT responders appear to differ from non–responders with respect to degeneration changes in posterior joints and disc diffusion. Although this analysis was preliminary, it provides a new direction to investigate the mechanisms underlying SMT and the existence of discrete forms of treatment–specific LBP. These slides can be retrieved under Electronic Supplementary Material.
KEYWORDS: Apparent diffusion coefficient; Degeneration; Facet joint; Low back pain; Spinal manipulative therapy
TRIAL REGISTRATION: ClinicalTrials.gov identifier: NCT01761838
From the FULL TEXT Article:
Introduction
Low back pain (LBP) is the most common disabling health condition in the world. [1] Despite its high prevalence, approximately 90% of these cases are diagnosed as nonspecific LBP due to unknown aetiology. [2] Accordingly, patients with non–specific LBP are thought to be a heterogeneous collection of various aetiologies [2] as demonstrated by variable responses to any given intervention. [3–7]
Notably, spinal manipulative therapy (SMT) is a common treatment for non–specific LBP that has shown a range of therapeutic effects. [3–5] Our recent study confirmed this variation in outcomes. Some participants demonstrated clinically significant improvements in LBP–related disability after 1 week of SMT treatments displayed post–SMT decreases in spinal stiffness, increases in lumbar multifidus contraction and increases in water diffusion at the L4–5 and L5–S1 discs. [3] Conversely, no such changes were observed in SMT non–responders, untreated non–specific LBP controls or untreated asymptomatic controls. [3] Divergent physical and clinical responses in patients with non–specific LBP following an identical SMT application highlight the importance of matching patient subgroups to the right LBP intervention. [8] Importantly, these findings also offer a unique opportunity to identify whether the differential treatment responses arise from patients with distinct underlying lumbar problems—a long–held premise with little empirical evidence.
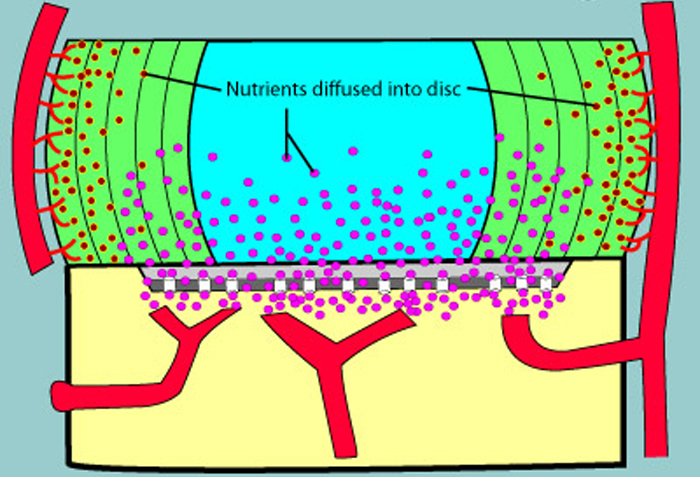
Since our prior results have shown that only SMT responders demonstrated post–treatment improvement in water diffusion in multiple lumbar discs [3], it may imply that SMT non–responders may display other spinal degenerative features (e.g. vertebral subchondral bone marrow lesions) that differ from SMT responders. [9–13] Additionally, because post–SMT improvement in disc diffusion may benefit disc health and repair [13, 14], an exploration of the association between post–SMT improvement in disc diffusion at certain segments (especially discs associated with painful segments as determined by palpation) and corresponding clinical improvements would help determine whether post–SMT enhancement of diffusion in certain discs on magnetic resonance imaging (MRI) was related to improved clinical outcomes.
Thus, our primary objective was to perform an exploratory secondary analysis of our previous data to determine whether SMT responders differed in their lumbar degeneration status from SMT non–responders, which might explain differential therapeutic responses of patients with LBP after SMT. An additional objective was to determine whether the presence/absence of increase in disc diffusion of painful segments following the first application of SMT was related to SMT responder/non–responder status after 1 week. It was hypothesized that SMT non–responders displayed significantly more degenerative spinal features than SMT responders. It was also hypothesized that an improvement in disc diffusion of pain segments after the first application of SMT was associated with favourable clinical improvements after 1 week.
Materials and methods
Study design and participants
We performed an exploratory secondary analysis of a prospective non–randomized clinical trial investigating post– SMT differential responses of individuals with LBP [3] (ClinicalTrials.gov identifier: NCT01761838). Participants aged 18–60 years with non–specific LBP were recruited from multidisciplinary settings. All enrolled participants had a minimum LBP intensity of 2 on the 11–point numeric pain rating scale and at least 20% on the modified Oswestry Disability Index (mODI). [3] Exclusion criteria included but were not limited to: prior lumbosacral surgery, prior SMT within the past 4 weeks, scoliosis, pregnancy, spinal fractures/ tumours or any contraindications for MRI. [3]
To minimize the risk of unknowingly recruiting an excessive number of SMT responders or non–responders, we attempted to balance these groups by employing a clinical prediction rule for identifying potential SMT responders during enrolment. [15] Individuals with ≤ 2 items in the clinical prediction rule were recruited as potential SMT non–responders, while those with ≥ 4 characteristics were recruited as potential responders (“Appendix 1”). [3, 4] Individuals with exactly three characteristics were excluded as per prior research. [3, 4] All participants gave written informed consent for the study approved by the institutional research ethics board.
Procedure
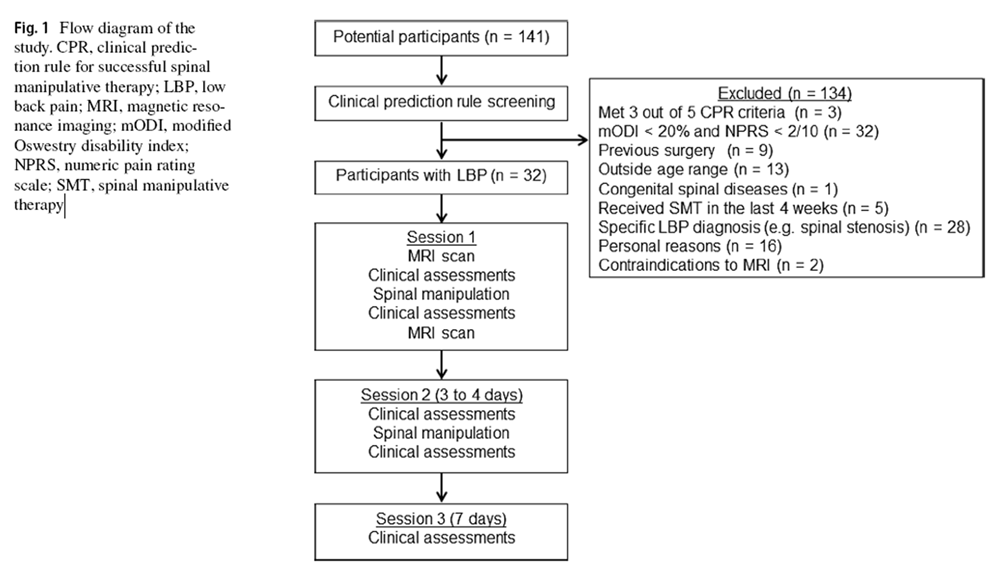
Figure 1 Thirty–two participants with LBP attended three morning sessions in 1 week (Figure 1). On session 1, participants provided demographics and completed the mODI. The lumbar spine was palpated at the spinous processes to identify painful and non–painful segment(s). [16] The cephalic and caudal intervertebral discs (IVDs) associated with the painful segment were noted. Additionally, participants underwent lumbar MRI (L1–S1), spinal stiffness assessments and multifidus ultrasonography before, and after, the application of SMT in the first session. [3] The mean time between scans was 1 h. On session 2 (3–4 days later), participants repeated these procedures but without MRI. On session 3 (Day 7), only the mODI score, spinal stiffness and multifidus function were completed; no SMT was provided. Participants were then dichotomized as SMT responders and non–responders based on ≥ 30% and < 30% reduction in baseline mODI scores. This cut–off is recognized as the minimal clinically important improvement in LBP disability [17] although different minimal clinically important improvement values have been suggested by different studies. [18–20]
Spinal manipulative therapy
Participants received standardized SMT described elsewhere. [3] Briefly, it involved a long–lever application of a posteroinferior thrust to the pelvis (“Appendix 2”). During sessions 1 and 2, a maximum of two SMT applications were allowed for each side of the participant.
Imaging

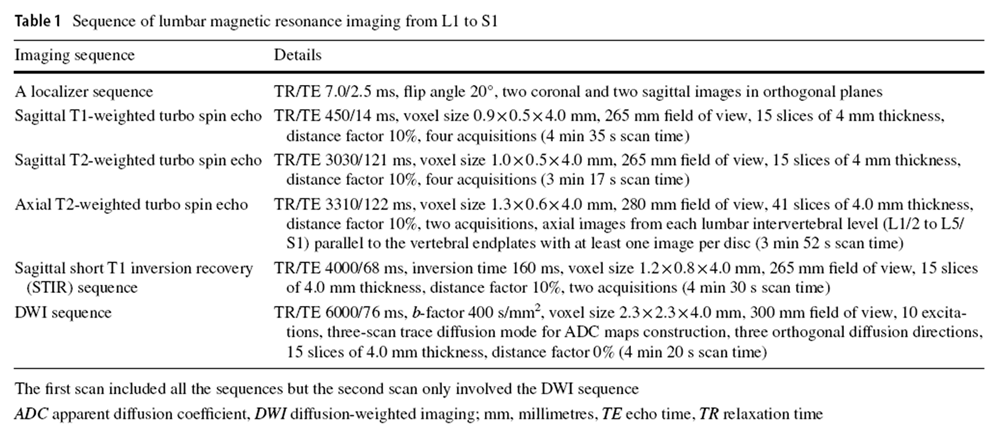
Table 1 Participants' lumbar spines were scanned by a 1.5 Tesla MRI unit (MAGNETOM Symphony, Siemens Medical Solutions) using multi–element spine coils. The pre–SMT imaging protocol included sagittal TI– and T2–weighted turbo spin echo, axial T2–weighted turbo spin echo, sagittal STIR sequence and sagittal diffusion–weighted imaging (DWI) sequences (Table 1), while post–SMT imaging only involved DWI. [3] Sagittal DWI were acquired using a single shot, dual spin echo, echo–planar imaging acquisition with multi–element spine coils and abdominal coils. The image processing system of the scanner constructed mean apparent diffusion coefficient (ADC) maps.
Grading of MRI findings
A certified radiologist, blinded to the ADC findings, reviewed each participants' imaging and provided scoring for: facet joint degeneration, IVD degeneration and Modic changes (MCs) between the L3 and S1 segments. These segments were chosen as LBP was commonly noted in the lower lumbar spine. [21, 22]
The facet joint degeneration at L3–L5 levels was graded by a validated 4–point scale having a high intra–observer reliability (kappa 0.70–0.77) and clinical relevance. [23] Facet degeneration was graded based on joint space, the presence of osteophyte, articular process hypertrophy, subarticular erosion and subchondral cyst. [23] A zero score denoted no degeneration, while 3 represented severe degeneration. [24] Disc degeneration at all lumbar levels was graded by the 5–point Pfirrmann grading system that is based on disc height, homogeneity of the disc structure, differentiation between nucleus and annulus, and T2-weighted signal intensity. [25] This grading system has demonstrated excellent intra-rater reliability (kappa from 0.84 to 0.90). [25] Higher grades indicate more severe degeneration.
The MCs of vertebrae were graded by a method with substantial to almost perfect intra-observer reliability (kappa from 0.77 to 1.00) [26]. Specifically, type I MC (fibrovascular replacement of subchondral bone) was characterized by decreased T1 and increased T2 signal intensity. [27] Type 2 MC (endplate fissures and fatty replacement of subchondral bone) showed hyperintense T1 and isointense/hyperintense T2 signals. [27] Type 3 MC (sclerosis of subchondral bone) appeared as hypointense T1 and T2 signals. [27] If multiple types of MCs coexisted at the endplate/subchondral bone, it was labelled as mixed type 1/2 or 2/3 MC. The locations and sizes (endplate area, maximum height, volume or anteroposterior diameter) of MCs were recorded. [28, 29]
ADC measurements
An examiner blinded to the radiologist's grading used a customized programme to measure mean ADC values (ADC mean) of five lumbar discs on the midsagittal ADC map. Notably, a 40 mm2 circular region of interest (ROI) was placed in the central, nuclear portion of a disc on the midsagittal ADC map to minimize the noise signals from adjacent vertebral structures. The ADC mean of a disc was estimated from signal intensity within the ROI. If the diameter of the ROI exceeded the disc height, the disc was excluded from analysis. [3] A high ADC value represents higher IVD diffusion. [13]
Intra-observer reliability of assessments
Three weeks after initial imaging, the radiologist and the examiner independently repeated the grading of MRI findings and ADC measurements on the scans of randomly selected participants. Both readers were blinded to all measurement results.
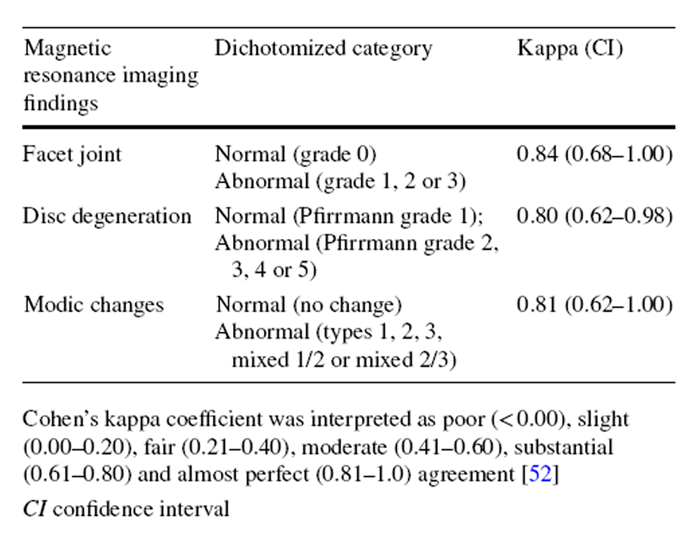
Statistical analysis
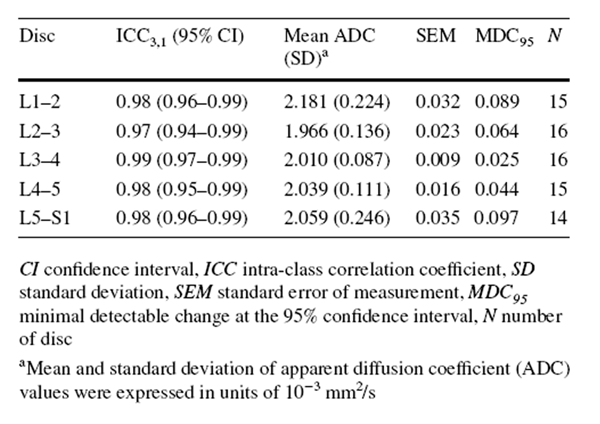
The exploratory, secondary analyses of underpowered data were conducted using SPSS 22.0 software (IBM, Armonk, NY). As some categories of the MRI findings showed low prevalence of specific grades (< 10%) (e.g. type 3 MC), each variable was dichotomized to calculate the intra-observer reliability using kappa analysis. [30] Specifically, Pfirrmann grading was dichotomized into “no/mild disc degeneration” (grade 1–3) and “severe disc degeneration” (grade 4 or 5). [31] MC was dichotomized as “no” and “yes” (regardless of types or locations). Facet joint degeneration was dichotomized as “no/mild degeneration” (grade 0 and 1) and “severe degeneration” (grade 2 and 3). [32] Kappa coefficients were interpreted as follows: poor (≤ 0), slight (0.01–0.20), fair (0.21–0.40), moderate (0.41–0.60), substantial (0.61–0.80) and excellent (0.81–1.00). [33] The intra-observer reliability of ADC measurements was reported elsewhere [3] and demonstrated excellent intra-class correlation coefficients (ICC3,1) estimates (0.97–0.98) (“Appendix 3”). [3, 34]
Chi-square/Fisher's exact tests assessed differences in the frequency of dichotomized MRI findings between responders and non-responders. Demographic data and baseline ADC mean of all lumbar IVDs in responders and nonresponders were checked for normality using Shapiro–Wilk tests. If continuous data were not normally distributed, Mann–Whitney U tests would replace independent t tests for between-group comparisons. The effect sizes of all betweengroup comparisons were calculated. [35] Additionally, to determine the baseline ADC mean cut-off of each IVD that could differentiate responders and non-responders [36], area under the curve (AUC) of the receiver operating characteristic curve and Youden index were used. [34, 36] An AUC value of 0.5 indicates that the baseline ADC mean of a disc is no better than chance to distinguish between responders and non-responders, while an AUC of 1.00 represents the baseline ADC mean that could always identify the responders. [34] The cut-off was chosen if Youden index value (J = maxc [Se(c) + Sp (c) – 1]) was maximum, where Se and Sp were the probability of truly identifying responders and non-responders, respectively, at a given cut-off (c). [36]
The differences in post-SMT changes in ADC mean of IVDs associated with painful/non-painful segments between responders and non-responders were examined by separate Chi-square tests. To dichotomize the post-SMT changes in ADC mean into increase or no change/decrease in ADC mean, values of the minimal detectable change at the 95% confidence interval (“Appendix 4”) [37] derived from intraobserver reliability of ADC measurements at the respective disc levels were used as the cut-offs. Cramer's V tests were used to estimate the strength of the association. Cramer's V values were interpreted as weak (< 0.10), moderate (0.11–0.33) and strong (> 0.30) [38]. The significance level was set at 0.05 for all tests. For this exploratory secondary analysis, a P value between 0.05 and 0.10 was considered as a trend towards significance.
Results
Table 2
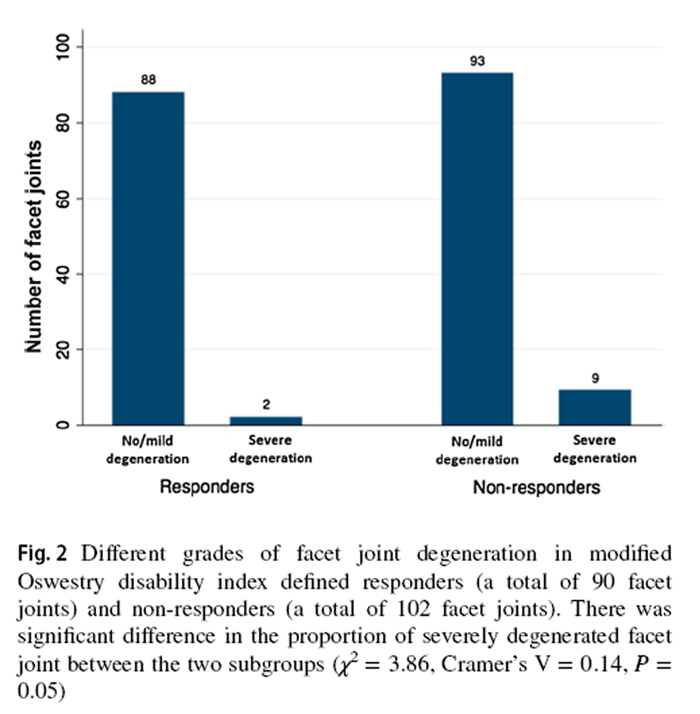
Figure 2
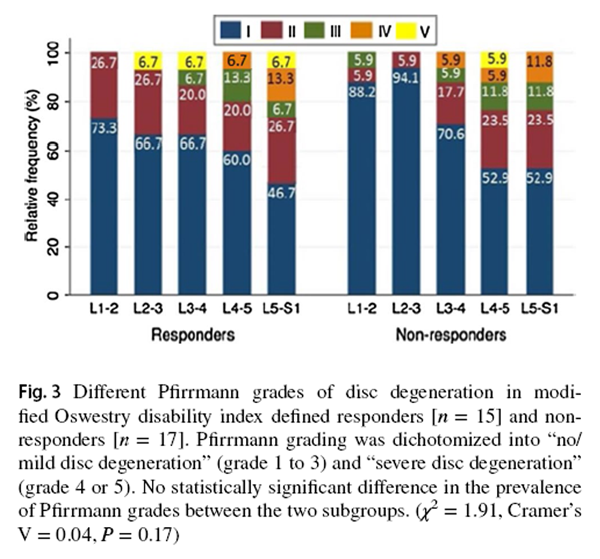
Figure 3
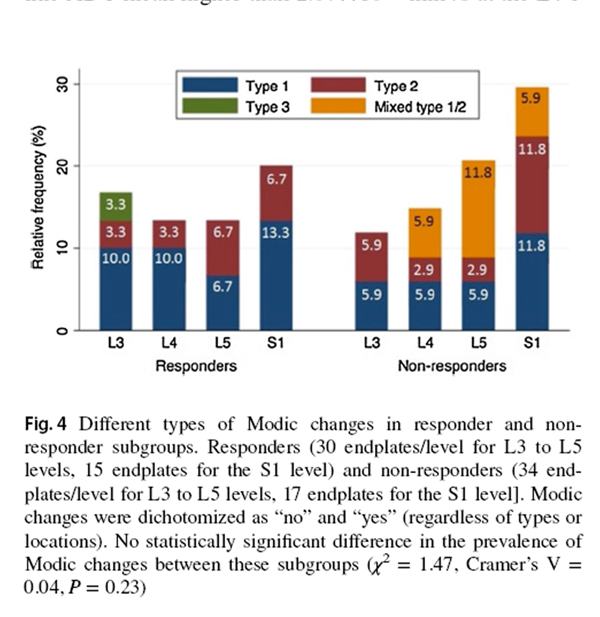
Figure 4
Table 3
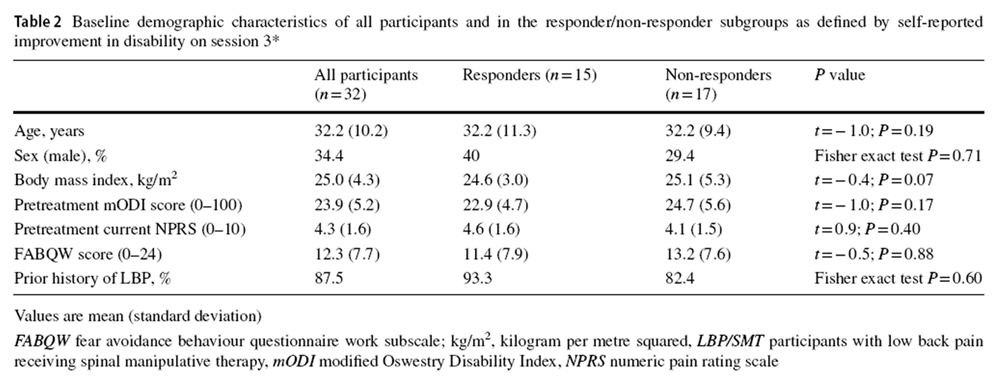
Table 4 Based on mODI scores, 15 participants were classified as SMT responders and 17 as non-responders. The baseline demographics of these two groups were comparable (Table 2). The intra-observer reliability of the various lumbar degeneration grading was excellent (κ = 0.80–0.84) (“Appendix 3”). [33]
Responders' and non-responders' MRI findings
Compared to SMT responders, SMT non-responders displayed a trend of higher prevalence of severely degenerated facet joints (χ2 = 3.86, P = 0.05, Cramer's V = 0.14) (Figure 2). From the post hoc analysis using G * Power program [39], 180 participants per group should have been recruited to detect a significant between-group difference in facet joint degeneration (Power = 0.80, α = 0.05). There was no statistically significant between-group difference in the prevalence of IVD or MC grading. While most IVDs in both subgroups were not degenerated, more degenerated discs were found at the L4–5 and L5–S1 levels (Figure 3). Modic changes were observed in 46.7% and 58.8% of responders' and non-responders' endplates, respectively. For responders, the prevalence estimates of types 1, 2 and 3 MCs in endplates were 9.5%, 4.8% and 1.0%, respectively (Figure 4). Similarly, type 1, type 2, type 3 and mixed type 1/2 MCs were noted in 6.7%, 5.0%, 0.0% and 5.9% of non-responders' endplates, respectively (Fig. 4). The anterior superior endplate showed the highest relative frequency of MCs (33.3% to 34.5%) in both subgroups although it did not significantly differ from other locations. The majority of the observed MCs involved only endplates (88.9% in responders, 68.9% in non-responders).
Baseline ADC mean of responders and non-responders
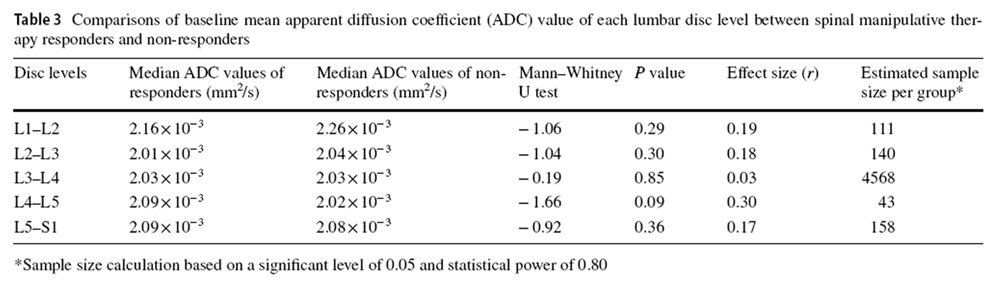
Five out of 160 IVDs were excluded from the ADC measurements because the disc space was smaller than the ROI diameter. All the excluded discs were from five non-responders at L1–2 (n = 2) and L4–5 (n = 1) and L5–S1 discs (n = 2). There was no significant difference in ADC mean of all intervertebral discs between responders and non-responders. However, compared to responders, non-responders had a trend of lower estimated baseline ADC mean of the L4–5 disc (U = 78.00, P = 0.09, r = 0.30) (Table 3). The post hoc analysis revealed that a sample size of 43 per group should have been recruited to detect a significant between-group difference of this magnitude (Power = 0.80, α = 0.05). Similarly, while AUCs for baseline ADC mean of discs at each level were not statistically significant, the AUC of the L4–5 disc was 0.70 (95% CI: 0.50–0.89; P = 0.07). Specifically, patients with baseline ADC mean higher than 2.07 × 10⁻³ mm2/s at the L4–5 disc were more likely to be responders (sensitivity = 0.71; specificity = 0.68).
Comparing post-SMT ADC mean changes in discs at painful/non-painful segments
between responders and non-responders
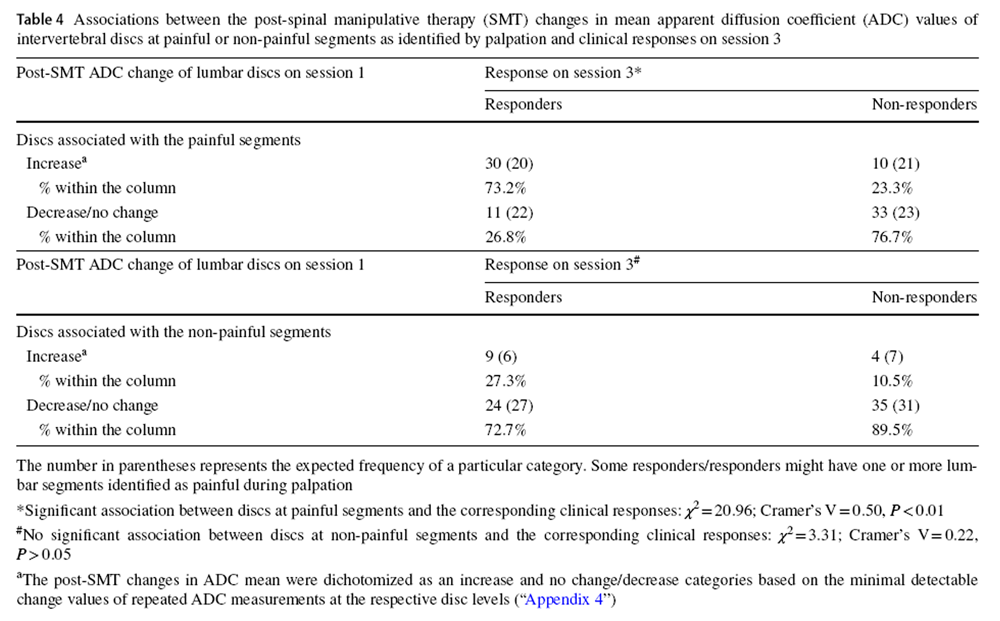
Compared to non-responders, a significantly higher proportion of discs identified as painful in responders demonstrated immediate post-SMT increases in ADC mean (Cramer's V = 0.50, P < 0.01) (Table 4). Conversely, both responders and non-responders did not show significant differences in the patterns of post-SMT changes in ADC mean of discs associated with non-painful segments (P > 0.01) (Table 4).
Discussion
While the current secondary analysis has revealed no statistically significant differences in spinal structural features between SMT responders and non-responders, lumbar degeneration status appears to be related to post-SMT treatment outcomes. Compared to SMT responders, the nonresponders demonstrated a trend of a higher prevalence of severe facet degeneration (P = 0.05) and relatively lower baseline ADC mean of the L4–5 disc (P = 0.09). Given the exploratory nature of our analyses, it is important to consider all potential findings that may explain mechanisms underlying the differential responses between SMT responders and non-responders. Our results suggest that spinal degeneration (especially the discs) may be a potential treatment effect modifier for SMT in patients with non-specific LBP although further studies are warranted to test this hypothesis.
Distinct baseline ADC mean and post-SMT disc diffusion responses were noted between responders and nonresponders. Our current data suggest that ADC mean of IVDs may be more sensitive to the microstructural intradiscal changes that may not be quantified by qualitative grading on MRI. [40] Since a lower ADC mean indicates greater disc degeneration [13, 41], our findings suggest that non-responders may have more degenerated L4–5 discs, which may be sources of LBP. [42] A prior ovine study has found that a spinal segment with a degenerated disc displays less movement during SMT as compared to a nondegenerated spine. [43] Such distinct mechanical responses may explain the differential SMT responses. Additionally, Vieira-Pellenz found that male LBP patients with degenerative discs who demonstrated greater increases in body height (a proxy of improved disc height) after a single session of SMT were associated with less LBP prevalence. [44] Given these results, further studies with larger sample sizes are warranted to determine the causal relations among spine degeneration, post-SMT mechanical responses and LBP.
Interestingly, our findings highlighted that responders were characterized by immediate post-SMT increases in ADC mean of discs associated with painful segments on session 1. This finding implies that favourable clinical outcomes arising from SMT may be partly due to improved diffusion of discs associated with painful segments. Since the significant relation between level-specific post-SMT increases in ADC mean of discs and improved clinical outcomes was only found in SMT responders, it corroborates the importance of conducting further studies to clarify the association between spinal degeneration and SMT outcomes, especially when SMT non-responders displayed a the trend of more lumbar degenerative features. Notwithstanding the strong association between post-SMT increase in ADC mean of discs on session 1 and clinical improvements on session 3, improved disc diffusion might not be the sole reason for the differential clinical responses of our participants. Since 26.8% of discs at the painful segments of the responders showed no change/decrease in the post-SMT ADC mean (Table 4), their clinical improvements may be related to the mechanical and/or neurophysiological effects of SMT on spinal tissues other than improved disc diffusion. Similarly, if IVDs were not the sole source of LBP or the dosage of SMT was insufficient to elicit significant clinical improvements in the non-responders, enhanced post-SMT disc diffusion would not improve clinical outcomes. Furthermore, SMT is unlikely to benefit non-biomechanical pathologies, e.g. inflammation of vertebral subchondral bone [45] or increased nociceptive innervation in IVDs/vertebral endplates. [46]
Additionally, our findings underscore the presence of treatment-specific types of LBP. As non-specific LBP is a constellation of heterogeneous conditions that have varied mechanisms of pain generation [47, 48], the application of a single LBP treatment to patients with non-specific LBP would be expected to result in diverse clinical outcomes as is the case in our work and that of others. [48, 49] Although there have been many suggestions as to why this diverse range of responses exist to a given treatment [50–53], this secondary analysis suggests that a selective response to a particular intervention does exist and has a potential physiological explanation consisting of distinct biological and biomechanical characteristics. Our findings indicate a novel research direction for investigating the influence of structural features in affecting treatment responses, which may guide certain clinical decision in future. However, it is not recommended to order routine MRI scans for the sole purpose of determining the application of SMT.
The current study has inherent limitations. First, as the current exploratory, secondary analysis was not powered for the comparison of MRI findings between responders and non-responders. As such, no statistically significant difference can be drawn, and our results should be interpreted with caution. Future research with a larger sample size is warranted to validate the current findings. Second, although SMT responders and non-responders were dichotomized based on a 30% decrease in baseline mODI scores at the third visit, the absolute change in mODI score of a SMT responder could be as small as 6 points if the participant's baseline mODI score was only 20 points. While 6 points were still larger than some suggested minimal detectable changes in patients with LBP (ranging from 3.2 to 5.2 points) [18], this value was much smaller than other suggested minimal detectable changes (15–19 points). [19] Therefore, some SMT responders' mODI improvements might not demonstrate minimal clinical important differences had other cut-off methods been used. Third, since the present study investigated the association between post-SMT changes in ADC mean of IVDs on session 1 and the clinical outcomes on session 3, the relation between serial changes in ADC mean of IVDs and the respective clinical outcomes remains unknown.
As prior research suggests that SMT may have a positive dose–response effect on clinical outcomes [54], it is conceivable that SMT may have similar cumulative effects on the disc diffusion changes. Future research should measure both the post-SMT ADC mean and clinical outcomes at successive time points to clarify this relation. Fourth, while our results appeared to suggest distinct MRI spinal findings in SMT responders and non-responders, MRI scans are rarely ordered in clinical practice for patients with non-specific LBP. Future studies should investigate whether differential spinal degenerative features exist in plain radiographs (i.e. X-rays) between SMT responders and nonresponders, which may inform clinical decision-making and further assist in more refined patient selection for further imaging assessments.
Conclusions
There was no significant difference in structural features between SMT responders and non-responders. However, SMT responders demonstrate a trend of a lower prevalence of severely degenerated facets and relatively high baseline ADC values of the L4–5 discs. Interestingly, SMT responders demonstrate post-SMT increases in apparent diffusion coefficient (ADC) values of discs associated with painful segments. These results suggest that SMT responses may be related to some underlying structural responses. Our findings provide a new hypothesis/direction for further investigating the underlying nature of the differential response to SMT, possible mechanisms of SMT and the existence of treatment-specific forms of LBP.
Appendix 1: Clinical prediction rule
Clinical characteristics of the clinical prediction rule for identifying people
who benefit from spinal manipulative therapyClinical characteristics Definition of a positive finding 1. Duration of the current Less than 16 days episode of low back pain 2. Distal symptoms No symptoms distal to the knee 3. Fear avoidance beliefs Less than 19 points questionnaire work subscale 4. Lumbar stiffness At least one lumbar segment is determined to be hypomobile by the examiner using a manual posteroanterior spinal mobility test 5. Hip internal rotation At least one hip with 35° or range of motion greater as measured by an inclinometer in proneAppendix 2: Spinal manipulative therapy procedure
The supine participant crossed and put his/her fingers behind the neck. The clinician stood opposite to the side to be manipulated and side bent the participant's trunk towards the side of the pelvis to be manipulated, and rotated the trunk in the opposite direction. Then the clinician applied a highvelocity, low-amplitude thrust to the pelvis in a posteroinferior direction. The clinician delivered spinal manipulative therapy to each side at each given session. If the first attempt did not result in cavitation, a second spinal manipulation was allowed for each side. A maximum of two spinal manipulations would be given to each side within a session. In the current study, only two out of 64 sessions required a second spinal manipulation on the one side (one for responder and one for non-responder).
Appendix 3: Intra-observer reliability of the dichotomized degeneration variables
Appendix 4: Intra-observer reliability of apparent diffusion coefficient measurement
References:
Global Burden of Disease 2013 Collaborators (2013)
Global, Regional, and National Incidence, Prevalence, and Years Lived with Disability for 301 Acute
and Chronic Diseases and Injuries in 188 Countries, 1990-2013: A Systematic Analysis
for the Global Burden of Disease Study 2013
Lancet. 2015 (Aug 22); 386 (9995): 743–800Haldeman S, Kopansky-Giles D, Hurwitz EL, et al.
Advancements in the Management of Spine Disorders
Best Pract Res Clin Rheumatol. 2012 (Apr); 26 (2): 263–280Wong AYL, Parent EC, Dhillon SS, Prasad N, Kawchuk GN.
Do Participants with Low Back Pain who Respond to Spinal
Manipulative Therapy Differ Biomechanically From
Nonresponders, Untreated Controls
or Asymptomatic Controls?
Spine (Phila Pa 1976). 2015 (Sep 1); 40 (17): 1329–1337Fritz JM, Koppenhaver SL, Kawchuk GN, Teyhen DS, Hebert JJ, Childs JD.
Preliminary Investigation of the Mechanisms Underlying the Effects of Manipulation:
Exploration of a Multivariate Model Including Spinal Stiffness,
Multifidus Recruitment, and Clinical Findings
Spine (Phila Pa 1976). 2011 (Oct 1); 36 (21): 1772-1781Koppenhaver SL, Fritz JM, Hebert JJ et al (2011)
Association between changes in abdominal and lumbar multifidus muscle thickness and clinical improvement
after spinal manipulation.
J Orthop Sports Phys Ther 41:389–399.
https://doi.org/10.2519/jospt .2011.3632Long A, Donelson R, Fung T (2004)
Does it matter which exercise? A randomized control trial of exercise for low back pain.
Spine 29:2593–2602Beneciuk JM, Robinson ME, George SZ (2015)
Subgrouping for patients with low back pain: a multidimensional approach incorporating cluster analysis
and the STarT Back Screening Tool.
J Pain 16:19–30.
https://doi.org/10.1016/j.jpain .2014.10.004Hebert JJ, Koppenhaver SL, Walker BF (2011)
Subgrouping patients with low back pain: a treatment-based approach to classification.
Sports Health 3:534–542.
https://doi.org/10.1177/1941738111 41504 4Jensen TS, Karppinen J, Sorensen JS et al (2008)
Vertebral endplate signal changes (Modic change): a systematic literature review of prevalence
and association with non-specific low back pain.
Eur Spine J 17:1407–1422.
https://doi.org/10.1007/s00586-008-0770-2Kjaer P, Korsholm L, Bendix T et al (2006)
Modic changes and their associations with clinical findings.
Eur Spine J 15:1312–1319.
https://doi.org/10.1007/s0058 6-006-0185-xJensen RK, Leboeuf-Yde C, Wedderkopp N et al (2012)
Is the development of Modic changes associated with clinical symptoms?
A 14-month cohort study with MRI.
Eur Spine J 21:2271–2279.
https://doi.org/10.1007/s0058 6-012-2309-9Jensen OK, Nielsen CV, Sřrensen JS, Stengaard-Pedersen K (2014)
Type 1 Modic changes was a significant risk factor for 1-year outcome in sick-listed low back pain patients:
a nested cohort study using magnetic resonance imaging of the lumbar spine.
Spine J 14:2568–2581.
https://doi.org/10.1016/j.spinee.2014.02.018Antoniou J, Demers CN, Beaudoin G et al (2004)
Apparent diffusion coefficient of intervertebral discs related to matrix composition and integrity.
Magn Reson Imaging 22:963–972.
https://doi.org/10.1016/j.mri.2004.02.011Huang Y-C, Urban JPG, Luk KDK (2014)
Intervertebral disc regeneration: do nutrients lead the way?
Nat Rev Rheumatol 10:561–566.
https://doi.org/10.1038/nrrhe um.2014.91Flynn T, Fritz J, Whitman J et al (2002)
A clinical prediction rule for classifying patients with low back pain who demonstrate shortterm improvement
with spinal manipulation.
Spine 27:2835–2843.
https://doi.org/10.1097/01.BRS.00000 35681 .33747 .8DHaneline MT, Young M (2009)
A review of intraexaminer and interexaminer reliability of static spinal palpation: a literature synthesis.
J Manip Physiol Ther 32:379–386.
https://doi.org/10.1016/j.jmpt.2009.04.010Ostelo RWJG, Deyo RA, Stratford P et al (2008)
Interpreting change scores for pain and functional status in low back pain: towards international
consensus regarding minimal important change.
Spine 33:90–94.
https://doi.org/10.1097/BRS.0b013e3181 5e3a1 0Suarez-Almazor ME, Kendall C, Johnson JA, Skeith K, Vincent D (2000)
Use of health status measures in patients with low back pain in clinical settings.
Comparison of specific, generic and preference-based instruments.
Rheumatology 39:783–790.
https://doi.org/10.1093/rheum atolo gy/39.7.783Davidson M, Keating JL (2002)
A Comparison of Five Low Back Disability Questionnaires: Reliability and Responsiveness
Physical Therapy 2002 (Jan); 82 (1): 8–24Hagg O, Fritzell P, Nordwall A (2003)
The clinical importance of changes in outcome scores after treatment
for chronic low back pain.
Eur Spine J 12:12–20DePalma MJ, Ketchum JM, Saullo T (2011)
What is the source of chronic low back pain and does age play a role?
Pain Med 12:224–233Kjaer P, Leboeuf-Yde C, Korsholm L et al (2005)
Magnetic resonance imaging and low back pain in adults: a diagnostic imaging
study of 40-year-old men and women.
Spine 30:1173–1180Weishaupt D, Zanetti M, Boos N, Hodler J (1999)
MR imaging and CT in osteoarthritis of the lumbar facet joints.
Skelet Radiol 28: 215–219Kettler A, Wilke HJ (2006)
Review of existing grading systems for cervical or lumbar disc and facet joint degeneration.
Eur Spine J 15:705–718Pfirrmann C, Metzdorf A, Zanetti M et al (2001)
Magnetic resonance classification of lumbar intervertebral disc degeneration.
Spine 26:1873–1878Jensen TS, Sřrensen JS, Kjaer P (2007)
Intra- and interobserver reproducibility of vertebral endplate signal (modic) changes
in the lumbar spine: the Nordic Modic Consensus Group classification.
Acta Radiol 48:748–754Modic MT, Steinberg PM, Ross JS et al (1988)
Degenerative disk disease: assessment of changes in vertebral body marrow with MR imaging.
J Bone Joint Surg Am 166:193–199Maataoui A, Vogl TJ, Khan MF (2015)
Magnetic resonance imaging-based interpretation of degenerative changes in the
lower lumbar segments and therapeutic consequences.
World J Radiol 7:194–197Määttä JH, Karppinen JI, Luk KDK et al (2015) Phenotype profiling of Modic changes of the lumbar spine and its association with other MRI phenotypes: a large-scale population-based study. Spine J 15:1933–1942. https://doi.org/10.1016/j.spine e.2015.06.056
Gjorup T (1988) The kappa coefficient and the prevalence of a diagnosis. Methods Inf Med 27:184–186
Kovacs FM, Arana E, Royuela A et al (2014) Disc degeneration and chronic low back pain: an association which becomes nonsignificant when endplate changes and disc contour are taken into account. Neuroradiology 56:25–33. https://doi.org/10.1007/s0023 4-013-1294-y
Kalichman L, Hodges P, Li L et al (2010) Changes in paraspinal muscles and their association with low back pain and spinal degeneration: CT study. Eur Spine J 19:1136–1144. https://doi. org/10.1007/s0058 6-009-1257-5
Landis JR, Koch GG (1977) The measurement of observer agreement for categorical data. Biometrics 33:159–174. https://doi. org/10.2307/25293 10
Portney LG, Watkins MP (2009) Foundations of clinical research applications to practice, 3rd edn. Pearson Education Inc, New Jersey
Fritz CO, Morris PE, Richler JJ (2012) Effect size estimates: current use, calculations, and interpretation. J Exp Psychol Gen 141:2–18. https://doi.org/10.1037/a0024 338
Fluss R, Faraggi D, Reiser B (2005) Estimation of the Youden index and its associated cutoff point. Biom J 47:458–472. https:// doi.org/10.1002/bimj.20041 0135
Eliasziw M, Young SL, Woodbury MG, Fryday-Field K (1994) Statistical methodology for the concurrent assessment of interrater and intrarater reliability: using goniometric measurements as an example. Phys Ther 74:777–788
Healey JF (2007) The essentials of statistics: a tool for social research. Nelson Education, Toronto. https://doi. org/10.1179/10773 52018 00339 434
Erdfelder E, Faul F, Buchner A (1996) GPower: a general power analysis program. Behav Res Methods Instrum Comput 1996(28):1–11. https://doi.org/10.3758/BF032 03630
Teraguchi M, Yoshimura N, Hashizume H et al (2014) Prevalence and distribution of intervertebral disc degeneration over the entire spine in a population-based cohort: the Wakayama Spine Study. Osteoarthr Cartil 22:104–110. https://doi.org/10.1016/j. joca.2013.10.019
Yu HJ, Bahri S, Gardner V, Muftuler LT (2015) In vivo quantification of lumbar disc degeneration: assessment of ADC value using a degenerative scoring system based on Pfirrmann framework. Eur Spine J 24(11):2442–2448. https://doi.org/10.1007/s0058 6-014-3721-0
Weiler C, Lopez-Ramos M, Mayer HM et al (2011) Histological analysis of surgical lumbar intervertebral disc tissue provides evidence for an association between disc degeneration and increased body mass index. BMC Res Notes 4(1):497. https://doi. org/10.1186/1756-0500-4-497
Colloca CJ, Gunzburg R, Freeman BJ et al (2012) Biomechancial quantification of pathologic manipulable spinal lesions: an in vivo ovine model of spondylolysis and intervertebral disc degeneration. J Manip Physiol Ther 35:354–366. https://doi.org/10.1016/j. jmpt.2012.04.018
Vietra-Peltenz F, Olivia-Pascual-Vaca A, Rodriguez-Blanco C et al (2014) Short-term effect of spinal manipulation on pain perception, spinal mobility, and full height recovery in male subjects with degenerative disk disease: a randomized controlled trial. Arch Phys Med Rehabil 95:1613–1619. https://doi.org/10.1016/j. apmr.2014.05.002
Albert HB, Lambert P, Rollason J et al (2013) Does nuclear tissue infected with bacteria following disc herniations lead to Modic changes in the adjacent vertebrae? Eur Spine J 22:690–696. https ://doi.org/10.1007/s0058 6-013-2674-z
Samartzis D, Liebenberg EC, Fong DY (2014) Innervation of pathologies in the lumbar vertebral end plate and intervertebral disc. Spine J 14:513–521. https://doi.org/10.1016/j.spine e.2013.06.075
Dankaerts W, O'Sullivan PB, Straker LM et al (2006) The interexaminer reliability of a classification method for non-specific chronic low back pain patients with motor control impairment. Man Ther 11:28–39. https://doi.org/10.1016/j.math.2005.02.001
Delitto A (2005) Research in low back pain: time to stop seeking the elusive “magic bullet”. Phys Ther 85:206–208
McCarthy CJ, Arnall FA, Strimpakos N et al (2013) The biopsychosocial classification of non-specific low back pain: a systematic review. Phys Ther Rev 9:17–30. https://doi.org/10.1179/10833 19042 25003 955
O'Sullivan P (2005) Diagnosis and classification of chronic low back pain disorders: maladaptive movement and motor control impairments as underlying mechanism. Man Ther 10:242–255. https://doi.org/10.1016/j.math.2005.07.001
McKenzie RA, May S (2003) Mechanical diagnosis and therapy: the lumbar spine, 2nd edn. Spinal Publications, Waikanae. https ://doi.org/10.2519/jospt .2004.34.3.105
Waddell G, Newton M, Henderson I et al (1993) A Fear-Avoidance Beliefs Questionnaire (FABQ) and the role of fear-avoidance beliefs in chronic low back pain and disability. Pain 52:157–168
Mondloch M (2001) Does how you do depend on how you think you'll do? A systematic review of the evidence for a relation between patients” recovery expectations and health outcomes. CMAJ 165:174–179
Bialosky JE, Bishop MD, Price DD et al (2009) The mechanisms of manual therapy in the treatment of musculoskeletal pain: a comprehensive model. Man Ther 14:531–538. https://doi. org/10.1016/j.math.2008.09.001

Return to LOW BACK PAIN
Return to DISC HERNIATION
Since 2-12-2019
| Home Page | Visit Our Sponsors | Become a Sponsor |
Please read our DISCLAIMER |