

Epidemiology of Chronic Low Back Pain in US Adults: Data From
the 2009-2010 National Health and Nutrition Examination SurveyThis section is compiled by Frank M. Painter, D.C.
Send all comments or additions to: Frankp@chiro.org


FROM: Arthritis Care Res (Hoboken) 2016 (Nov); 68 (11): 1688–1694
OPEN ACCESS Anna Shmage, Robert Foley, Hassan Ibrahim
University of Minnesota,
Minneapolis.
shmag002@umn.edu
FROM: Nahin ~ Pain 2017Objective: To describe the epidemiologic characteristics and associations with increased health care utilization in US adults with chronic low back pain (LBP).
Methods: The National Health and Nutrition Examination Survey 2009–2010 was administered to adults ages 20–69 years (n = 5,103). Chronic LBP was defined as pain in the area between the lower posterior margin of the rib cage and the horizontal gluteal fold, with a history of pain lasting almost every day for at least 3 months. Demographic and behavioral characteristics were compared between those with chronic LBP and those without. Factors associated with ≥10 health care visits per year were evaluated in the chronic LBP subgroup (n = 700).
Results: Chronic LBP associations with adjusted odds ratios (ORadj ) ≥2 included age 50–69 years, less than high school education, annual household income <$20,000, income from disability, depression, sleep disturbances, and medical comorbidities. Subjects with chronic LBP were more likely to be covered by government-sponsored insurance plans (ORadj 3.23 [95% confidence interval (95% CI) 2.19–4.75] for Medicaid and ORadj 2.25 [95% CI 1.57–3.22] for Medicare; P < 0.0001), and visited health care providers more frequently (ORadj 3.35 [95% CI 2.40–4.67] for ≥10 health care visits in the past year; P < 0.0001). In the chronic LBP subgroup, adjusted ORs ≥2 were found for associations between ≥10 visits per year and unemployment, income from disability, depression, and sleep disturbances.
Conclusion: US adults with chronic LBP are socioeconomically disadvantaged, make frequent health care visits, and are often covered by government-sponsored health insurance. The clustering of behavioral, psychosocial, and medical issues should be considered in the care of Americans with chronic LBP.
From the FULL TEXT Article:
Introduction
Chronic low back pain (cLBP) is a common health problem with a strong societal impact. According to the US Burden of Disease Collaborators, low back pain has consistently accounted for the largest number of years lived with disability in the US population in 1990, and also in 2010. [1] Health expenditures for adults with spinal problems had been progressively increasing from the 1990s to 2000s, and were estimated at roughly $6,000 per person with CLBP in 2005, with the total cost of $102 billion. [2] While many epidemiologic studies and prospective clinical trials have been conducted in cLBP, studies have been difficult to compare and reproduce due to inconsistent cLBP definitions and varying assessments. [3]
There has been considerable effort to standardize research methods for cLBP. In 2008 the Multinational Musculoskeletal Inception Cohort Study (MMICS) issued a methods consensus statement, intended primarily at prospective cohorts for back pain research, which outlined the core risk factors of interest for cLBP research and recommended specific measurement tools. [4] In 2014 the US National Institutes of Health (NIH) Task Force on Research Standards for Chronic Low Back Pain published a report with an updated cLBP definition and recommended a “minimum dataset” for prospective cLBP studies. [5] Both groups emphasized the importance of socio-economic and behavioral factors in cLBP. Our aim was to characterize cLBP in US adults, using current definitions and guidelines. As low back pain is known to be associated with increased healthcare utilization, [6] we were also interested in factors, associated with frequent healthcare visits among Americans with cLBP.
Materials and Methods
The primary objective was to evaluate the distribution of key epidemiologic characteristics among US working-age adults with chronic low back pain and to identify factors, associated with frequent healthcare use in this population. The National Health and Nutrition Examination Survey (NHANES) is a biannual research survey conducted by the National Center for Health Statistics (NCHS) to assess the health and nutritional status of the US population. It combines household interviews and physical examinations, conducted at mobile examination centers (MEC). The NHANES methodology allows to select a sample that is representative of the US population. [7]
A comprehensive back pain questionnaire was conducted during the 2009–2010 NHANES cycle with the primary goal of establishing the prevalence of inflammatory back pain in US adults. [8] The questionnaire was administered to all adult participants ages 20 to 69 (N = 5,103). We identified the cLBP sample from participants who reported current pain in the area between the lower posterior margin of the ribcage and the horizontal gluteal fold at the time of survey with a history of pain lasting almost every day for at least 3 months (N = 700). To be classified as cLBP, participants had to answer “yes” to two questions: “Was there one time when you had pain, aching or stiffness almost every day for 3 or more months in a row?” and “Do you still have pain, aching or stiffness?” in areas 4 and 5 of the NHANES Hand Card ARQ1. We then used the ”seqn” unique identifier to link the back pain survey data with NHANES questionnaires on demographics, income, occupational history, sleep, tobacco use, medical comorbidities and healthcare utilization.
Health insurance coverage and health insurance type were self-reported to a trained NHANES interviewer. The interviewer asked to present the insurance card for confirmation if available. In the healthcare utilization survey participants were asked to self-report how many visits with a healthcare provider they’ve had in the past one year and whether they were hospitalized overnight in the past one year. MEC data were used for body mass index (BMI), depression screening by patient health questionnaire 9 (PHQ9), and alcohol use. We provide a modified Audit-C estimate, as for question 3 NHANES asked about 5 drinks per day, rather than 6 drinks per day as in standard Audit-C.9 Primary sample unit (“sdmvpsu”) and stratum (“sdmvstra”) variables, as well as 2–year interview weights (“wtint2yr”) were used to obtain national estimates for questionnaire variables, and 2–year MEC weights (“wtmec2yr”) – for MEC variables. A complete list of variables with descriptions is shown in Appendix 1.
We compared the demographic, behavioral, and health utilization characteristics between survey participants with cLBP and without using Chi-square tests for categorical variables and analysis of variance for continuous variables. Logistic regression was used to produce adjusted odds ratios for binary outcomes, with adjustment for age, race, gender, and education level. Additional adjustment for the number of medical comorbidities was included in the subgroup analysis of factors associated with frequent healthcare visits in the cLBP group (N = 700).
This was done to control for expected confounding between the number of medical comorbidities and healthcare visits. We also tested for interactions in full-sample adjusted models of 10 or more healthcare visits in the past year (N = 5103). In accordance with NHANES methodology, each survey participant represents a different proportion of the population, hence all results were expressed in percentages of the US population. A 95% confidence level was set for all tests of significance. All statistical analyses were performed in SAS 9.4 (SAS Institute, Inc., Cary, NC).
Results

Table 1 Demographic characteristics by chronic low back pain status are summarized in Table 1. The point prevalence of chronic low back pain in US adults aged 20–69 years old was 13.1%. Prevalence of cLBP increased with age, with the highest likelihood in the 5th and 6th decades of life: adjusted odds ratios (aOR) 2.03, ([95% Confidence Interval] 1.48–2.78) and 2.07 (1.59–2.71) respectively, (p < 0.0001). Prevalence was higher in women, aOR 1.28, (1.03–1.58), (p = 0.027). Caucasians had approximately 1.5 times the odds of reporting chronic low back pain than African Americans and Hispanics (p = 0.0001). Adults with cLBP were less likely to achieve a college degree than those without cLBP, aOR 1.99 (1.33–2.98) for having a high school diploma or associate’s degree, and aOR 2.27 (1.53–3.38) for having less than a high school education (p =0.0002). After adjustment for age, race, gender, and education level, participants with cLBP had higher odds of unemployment (aOR 1.79 (1.52–2.12), p < 0.0001), and annual household income <$20 000 (aOR 2.29 (1.46–3.58), p = 0.0064). 12.8% of US adults with cLBP received income from disability, compared with 4.6% of those without cLBP (aOR 2.62 (2.01–3.41) p <0.0001).
Obesity, defined as BMI >30 was more prevalent in the cLBP group (aOR 1.46, (1.10–1.96) p = 0.034). There were significantly more current and former smokers among adults with cLBP: aOR 1.44 (1.12–1.86) for former, and 1.77 (1.37–2.30) for current smokers (p = 0.0001). Although a trend for increased alcohol use was observed in the cLBP group, it was not statistically significant after adjustment. Approximately 33.2% of adults with cLBP screened positive for depression by PHQ9, compared with 21.7% of those without cLBP. The adjusted odds of mild, moderate, moderate to severe, and severe depression in the cLBP population were 1.86 (1.38–2.52), 3.30 (2.46–4.44), 8.29 (5.19–13.24), and 10.62 (5.42–20.80) respectively (p <0.0001). Note wider confidence intervals as the numbers of subjects with moderate to severe and severe depression were smaller. US adults with cLBP were more likely to report sleep disturbances to a healthcare provider (aOR 3.90 (3.22–4.73) p <0.0001). Over 48% reported multiple medical comorbidities vs 17% of those without cLBP, aOR 6.09 (4.12–9.00) for three or more comorbidities (p <0.0001). After adjustment for age, race, gender, and education level, the following factors were most strongly associated with cLBP on the numerical scale (aORs ≥ 2): age 50 to 69, education less than high school, annual household income <$20,000, income from disability, moderate to severe depression, sleep disturbances, and multiple medical comorbidities.
Table 2 Health insurance and healthcare utilization parameters are summarized in Table 2. Approximately 77% of US adults ages 20–69 with and without cLBP were covered by health insurance (p=0.76). However, the distribution of health insurance plans was different in the two groups. Adults with cLBP were less likely to be covered by private insurance, and more likely to have Medicaid, aOR 3.23 (2.19–4.75), Medicare, aOR 2.25 (1.57–3.22), and other federal and state-sponsored insurance plans (p < 0.0001). Participants with cLBP reported visiting a healthcare provider more frequently in the past 1 year (aOR 1.55 (1.12–2.16) for 2–9 visits/year, and 3.35 (2.40–4.67) for 10 or more visits, p < 0.0001). They were also more likely to report hospitalization overnight in the past 1 year (aOR 1.95 (1.47–2.59) p <0.0001).
Table 3
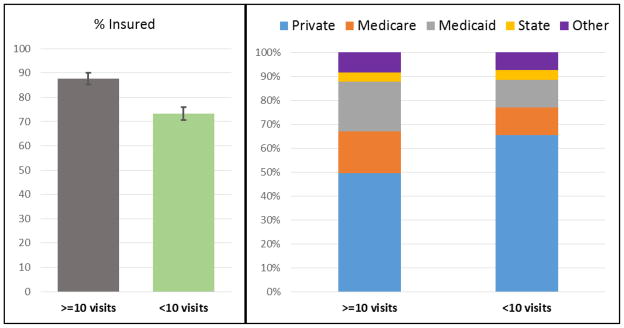
Figure 1 We performed a subgroup analysis of factors associated with ≥10 healthcare visits per year in the cLBP group (N = 700), which included all variables presented in Table 1. The statistically significant associations are shown in Table 3, and the full analysis table is available in Appendix 2. Medical comorbidities were strongly associated with frequent healthcare visits: aOR 5.00 (2.44–10.26) for more than 3 comorbidities (p<0.0001). After adjustment for age, gender, race, education, and the number of medical comorbidities, factors most strongly associated with 10 or more healthcare visits in the past year (aOR ≥2) in the cLBP subgroup were unemployment (aOR 3.00 (1.64–5.46) p = 0.0013), income from disability (aOR 2.58 (1.41–4.73) p =0.0021), depression (aOR 2.63 (1.19–5.86) for moderate, 5.09 (2.58–10.03) for moderately severe, and 5.55 (1.27–24.18) for severe depression, p <0.0001), and sleep disturbances (aOR 2.29 (1.57–3.33) p < 0.0001). Subjects with cLBP who reported 10 or more healthcare visits/year were more likely to have health insurance coverage (87.6% vs 73.3%, p = 0.0008), with higher odds of Medicare, aOR 2.10 (1.21–3.64), and Medicaid, aOR 2.31 (1.35–3.97), p = 0.0011 (Figure 1). Formal testing for interactions in full-sample adjusted models of ≥10 healthcare visits in the past year found significant interactions between cLBP and depression (p = 0.044), and between cLBP and insurance type (p=0.004).
Discussion
Our study provides US national epidemiologic estimates for a prevalent health condition with a high socio-economic burden. cLBP associations with adjusted odds ratios (aORs) ≥2 included age 50–69, education less than high school, annual household income <$20,000, income from disability, depression, sleep disturbances, and medical comorbidities. Subjects with cLBP were more likely to be covered by government-sponsored insurance plans, and visited healthcare providers more frequently. In the cLBP subgroup aORs ≥2 were found for associations between ≥10 visits per year and unemployment, income from disability, depression, and sleep disturbances.
To the best of our knowledge, there were no published studies with US population estimates of cLBP epidemiologic characteristics that were consistent with the current definition of chronic low back pain. Historic estimates of cLBP prevalence from the 1980s differed significantly in methodology and cLBP definitions, and reported the prevalence of cLBP between 5% and 10%. [10] The closest study with a current cLBP definition was a state-level telephone survey conducted in North Carolina (NC) in 1992 and 2006. [11] Our point prevalence estimate for cLBP was higher than the 2006 NC survey, 13.1% vs 10.5%, possibly because of differences in study methods, and/or continued rise in cLBP prevalence. It should be noted that the NC study also included older adults. We found a higher prevalence of cLBP in women than in men, and in Whites than in Blacks and Hispanics. We also found socioeconomic disparities, with higher odds of poor education and low income among US adults with cLBP. While direct comparisons cannot be drawn, these results are consistent with estimates for all-chronicity low back pain from US National Surveys. [12, 13]
We found a positive association between obesity (BMI>30) and cLBP. In a 2010 meta-analysis of body weight and low back pain a similar association was reported. [14] A systematic literature review from 2000 for all-chronicity LBP found a weak positive association between LBP and obesity, emphasizing that a strong relative risk above 2 was not reported in any of the reviewed epidemiologic studies. [15] We also found that former and current cigarette smoking was more prevalent among US adults with cLBP. This is consistent with a 2010 meta-analysis that reported a positive association between smoking and low back pain, which strengthens with increased chronicity. [16] Depression has a well-established association with cLBP, both as a risk factor and a consequence of living with cLBP. [17, 18]
Our data for US adults confirms a strong association between depression and cLBP, as well as between depression and frequent healthcare use in the cLBP group. The strength of both associations increased with severity of depression. We also found a strong association between sleep disturbances and cLBP. Though less extensively studied, this association has previously been described in several observational studies with varying definitions of low back pain and sleep disturbances. [19–21] In our study sleep disturbances were also strongly associated with frequent healthcare use among US adults with cLBP. We used a simple dichotomous definition of sleep disturbance available in NHANES 2009–2010 and were not able to evaluate for different sleep disorders or severity of the sleep problem.
There appears to be clustering of comorbid conditions in our study, as cLBP was independently associated with age, obesity, multiple comorbidities, depression, sleep disturbances, and tobacco use. This is consistent with previous studies of multimorbidity. [22] In a large German claims-based study of older adults that investigated connections between different chronic diseases, cLBP had the most associations with other chronic health conditions, and was described as the most important mediator of connections between chronic conditions. [23] It is known that cLBP in the US is an economic burden, due to lost work productivity and direct healthcare cost. [24, 25] A 2009 systematic review of treatments for low back pain from randomized clinical trials showed the median treatment cost of $13,015 per quality-adjusted life year (range from $304 to $579,527). [26] Our analysis highlights a subgroup of very frequent healthcare users among US adults with cLBP. This group reported more medical comorbidities, and had the highest odds of unemployment, disability, and poverty. As 50.5% of subjects with ≥10 healthcare visits/year in the cLBP group had government-subsidized health insurance, the cost of healthcare in this group is largely covered by US taxpayers. Additionally, our data showed that 23% of Americans aged 20 to 69 were uninsured in 2009–2010, regardless of their cLBP status. Although data collection took place prior to implementation of the Affordable Care Act, this number seemed unexpectedly high. We compared our results with the 2010 US Census data. Indeed, in 2009 the percentage of uninsured Americans was the highest in a decade, with up to 30.4% uninsured among young adults, and 21.7% among middle-aged adults. [27] Our dataset captured the populations with the lowest insurance rates, and did not include the elderly, who had almost universal Medicare coverage.
Our study has several important limitations. NHANES is an observational, cross-sectional study, and does not allow to establish temporal relationships or causal inferences between factors. Additionally, NHANES does not include institutionalized adults, and the back pain survey did not include elderly adults over 69 years of age, hence results cannot be extrapolated on these populations. Self-report variables are subject to inaccuracies and recall bias, however for the majority of variables in our study self-report remains the best available/realistic assessment. Using independently collected public data did not allow us to fully characterize some of the important epidemiologic parameters of cLBP, such as pain intensity and catastrophizing. We also could not account for multiple possible etiologies of cLBP, but based on previous literature, we anticipate that >85% of LBP does not have a specific cause. [28]
Despite limitations, our study has several advantages. NHANES provides data from community-based US population, and is relatively free from bias associated with healthcare-seeking behavior and billing inaccuracies, which can be seen in clinic-based and claims-based studies. NHANES uses standardized questionnaires and trained interviewers, thus improving the accuracy of self-reported data. Finally the comprehensive nature of NHANES allowed us to analyze multiple variables in the same sample. We hope that our study can further inform the selection of variables and outcomes for prospective research studies of cLBP, and can aid data comparison in the field.
In conclusion, US adults with cLBP in 2009–2010 were less educated, less wealthy, and more likely to smoke, have depression, sleep disturbances, and other medical comorbidities than those without cLBP. They made more frequent healthcare visits and more often carried government-sponsored health insurance to cover the costs. Frequent healthcare visits in the cLBP group were strongly associated with depression and sleep disturbances. While causal inference cannot be established from a cross-sectional study design, the clustering of behavioral, psychosocial, and medical issues should be considered in the care and rehabilitation of Americans with cLBP.
Significance and Innovations
We report not previously available generalizable US population estimates of a significant public health problem in the US, using current definitions and guidelines.
We highlight socio-economic disparities in US adults with chronic low back pain
We report increased healthcare utilization among US adults with chronic low back pain, and factors associated with very frequent healthcare visits.
Supplementary Material
(103K, pdf)Acknowledgments
Dr. Shmagel was funded by an NIH T32 grant for this research. Research reported in this publication was supported by the National Center for Advancing Translational Sciences of the National Institutes of Health Award Number UL1TR000114.
Footnotes
The content is solely the responsibility of the authors and does not necessarily represent the official views of the National Institutes of Health.
The authors have no conflicts of interest to disclose.
References:
Murray CJL, Atkinson C, Bhalla K, Birbeck G, Burstein R, Chou D, et al.
The State of US Health, 1990-2010: Burden of Diseases, Injuries, and Risk Factors
JAMA 2013 (Aug 14); 310 (6): 591–608Martin, BI, Deyo, RA, Mirza, SK et al.
Expenditures and Health Status Among Adults With Back and Neck Problems
JAMA 2008 (Feb 13); 299 (6): 656–664Van der Hulst M, Vollenbroek-Hutten MMR, Ijzerman MJ.
A systematic review of sociodemographic, physical, and psychological predictors
of multidisciplinary rehabilitation-or, back school treatment outcome in patients with chronic low back pain.
Spine. 2005;30:813–825Pincus T, Santos R, Breen A, Burton AK, Underwood M
Multinational Musculoskeletal Inception Cohort Study Collaboration.
A review and proposal for a core set of factors for prospective cohorts
in low back pain: a consensus statement.
Arthritis Rheum. 2008;59:14–24R.A. Deyo, S.F. Dworkin, D. Amtmann, G. Andersson, et al.,
Report of the NIH Task Force on Research Standards for Chronic Low Back Pain
Journal of Pain 2014 (Jun); 15 (6): 569–585Andersson GB.
Epidemiological features of chronic low-back pain.
Lancet. 1999;354:581–585http://www.cdc.gov/nchs/tutorials/nhanes/SurveyDesign/SampleDesign/Info1.htm
Weisman MH, Witter JP, Reveille JD.
The prevalence of inflammatory back pain: population-based estimates
from the US National Health and Nutrition Examination Survey, 2009–10.
Ann Rheum Dis. 2013;72:369–373Bush K, Kivlahan DR, McDonell MB, Fihn SD, Bradley KA.
The AUDIT alcohol consumption questions (AUDIT-C): an effective brief screening test
for problem drinking. Ambulatory Care Quality Improvement Project (ACQUIP).
Alcohol Use Disorders Identification Test.
Arch Intern Med. 1998;158:1789–1795Lawrence RC, Helmick CG, Arnett FC, Deyo RA, Felson DT, Giannini EH, et al.
Estimates of the prevalence of arthritis and selected musculoskeletal disorders
in the United States.
Arthritis Rheum. 1998;41:778–799Freburger JK, Holmes GM, Agans RP, Jackman AM, Darter JD, Wallace AS, et al.
The Rising Prevalence of Chronic Low Back Pain.
Arch Intern Med. 2009;169:251–258Deyo RA, Mirza SK, Martin BI.
Back pain prevalence and visit rates: estimates from U.S. national surveys, 2002.
Spine. 2006;31:2724–2727Deyo RA, Tsui-Wu YJ.
Descriptive epidemiology of low-back pain and its related medical care in the United States.
Spine. 1987;12:264–268Shiri R, Karppinen J, Leino-Arjas P, Solovieva S, Viikari-Juntura E.
The association between obesity and low back pain: a meta-analysis.
Am J Epidemiol. 2010;171:135–154Leboeuf-Yde C.
Body weight and low back pain. A systematic literature review of 56 journal articles
reporting on 65 epidemiologic studies.
Spine. 2000;25:226–237Shiri R, Karppinen J, Leino-Arjas P, Solovieva S, Viikari-Juntura E.
The association between smoking and low back pain: a meta-analysis.
Am J Med. 2010;123:87e7–35Pincus T, Burton AK, Vogel S, Field AP.
A systematic review of psychological factors as predictors of chronicity/disability
in prospective cohorts of low back pain.
Spine. 2002;27:E109–120Snelgrove S, Liossi C.
Living with chronic low back pain: a metasynthesis of qualitative research.
Chronic Illn. 2013;9:283–301Marty M, Rozenberg S, Duplan B, Thomas P, Duquesnoy B, Allaert F.
Quality of sleep in patients with chronic low back pain: a case-control study.
Eur Spine J. 2008;17:839–844Marin R, Cyhan T, Miklos W.
Sleep disturbance in patients with chronic low back pain.
Am J Phys Med Rehabil. 2006;85:430–435Alsaadi SM, McAuley JH, Hush JM, Maher CG.
Prevalence of sleep disturbance in patients with low back pain.
Eur Spine J. 2011;20:737–743Hestbaek L, Leboeuf-Yde C, Manniche C.
Is low back pain part of a general health pattern or is it a separate and distinctive entity?
A critical literature review of comorbidity with low back pain.
J Manipulative Physiol Ther. 2003;26:243–252Schafer I, Kaduszkiewicz H, Wagner H-O, Schon G, Scherer M, van den Bussche H.
Reducing complexity: a visualisation of multimorbidity by combining disease clusters and triads.
BMC Public Health. 2014;14:1285Dagenais S, Caro J, Haldeman S.
A Systematic Review of Low Back Pain Cost of Illness Studies
in the United States and Internationally
Spine J 2008 (Jan); 8 (1): 8–20Gore M, Sadosky A, Stacey BR, Tai KS, Leslie D.
The Burden of Chronic Low Back Pain: Clinical Comorbidities, Treatment Patterns,
and Health Care Costs in Usual Care Settings
Spine (Phila Pa 1976). 2012 (May 15); 37 (11): E668–677Dagenais S, Roffey DM, Wai EK, Haldeman S, Caro J.
Can cost utility evaluations inform decision making about interventions for low back pain?
Spine J. 2009;9:944–957DeNavas-Walt C, Proctor BD, Smith JC.
Income, Poverty, and Health Insurance Coverage in the United States: 2009. US Census Bureau; 2010.
https://www.census.gov/prod/2010pubs/p60-238.pdfJarvik JG, Deyo RA.
Diagnostic evaluation of low back pain with emphasis on imaging.
Ann Intern Med. 2002;137:586–597.
Return to LOW BACK PAIN
Return NON-PHARMACOLOGIC THERAPY
Since 6-20-2021
| Home Page | Visit Our Sponsors | Become a Sponsor |
Please read our DISCLAIMER |