Figure 2.
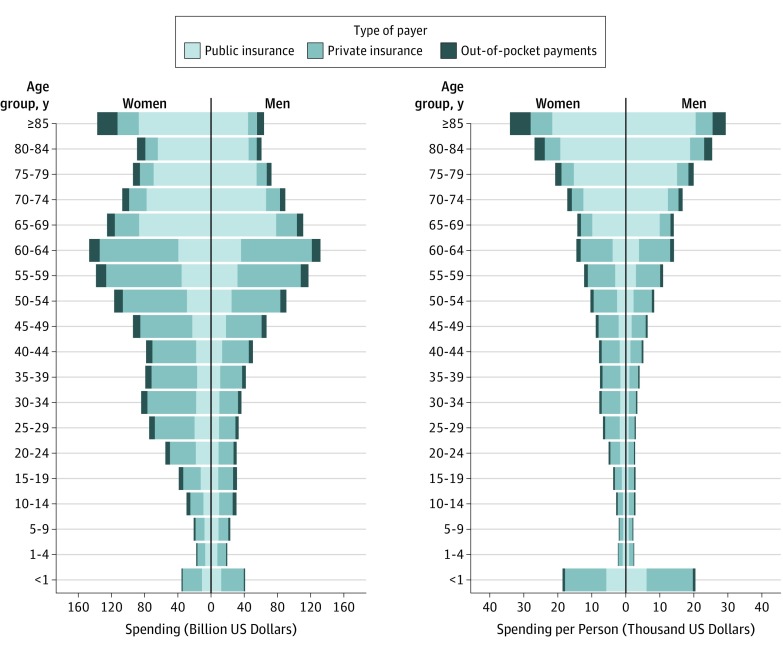
Estimated Health Care Spending by Age Group, Sex, and Payer in 2016
Reported in 2016 US dollars. Increases in spending along the x-axis show more spending.
Figure 2.
Estimated Health Care Spending by Age Group, Sex, and Payer in 2016
Reported in 2016 US dollars. Increases in spending along the x-axis show more spending.