Figure 3.
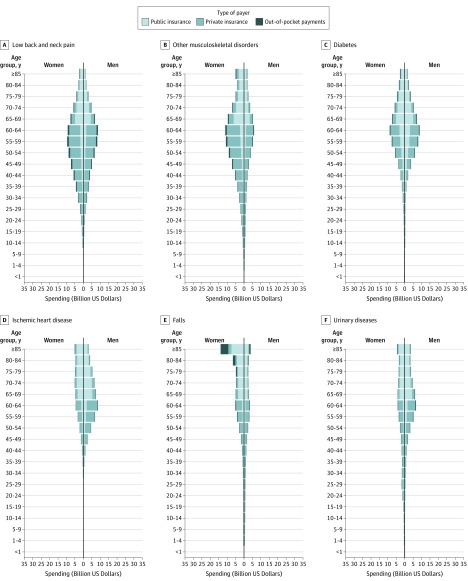
Six Health Conditions With the Highest Spending by Sex and Payer and Across Age Groups in 2016
Reported in 2016 US dollars. Increases in spending along the x-axis show more spending.
Figure 3.
Six Health Conditions With the Highest Spending by Sex and Payer and Across Age Groups in 2016
Reported in 2016 US dollars. Increases in spending along the x-axis show more spending.