Figure 5.
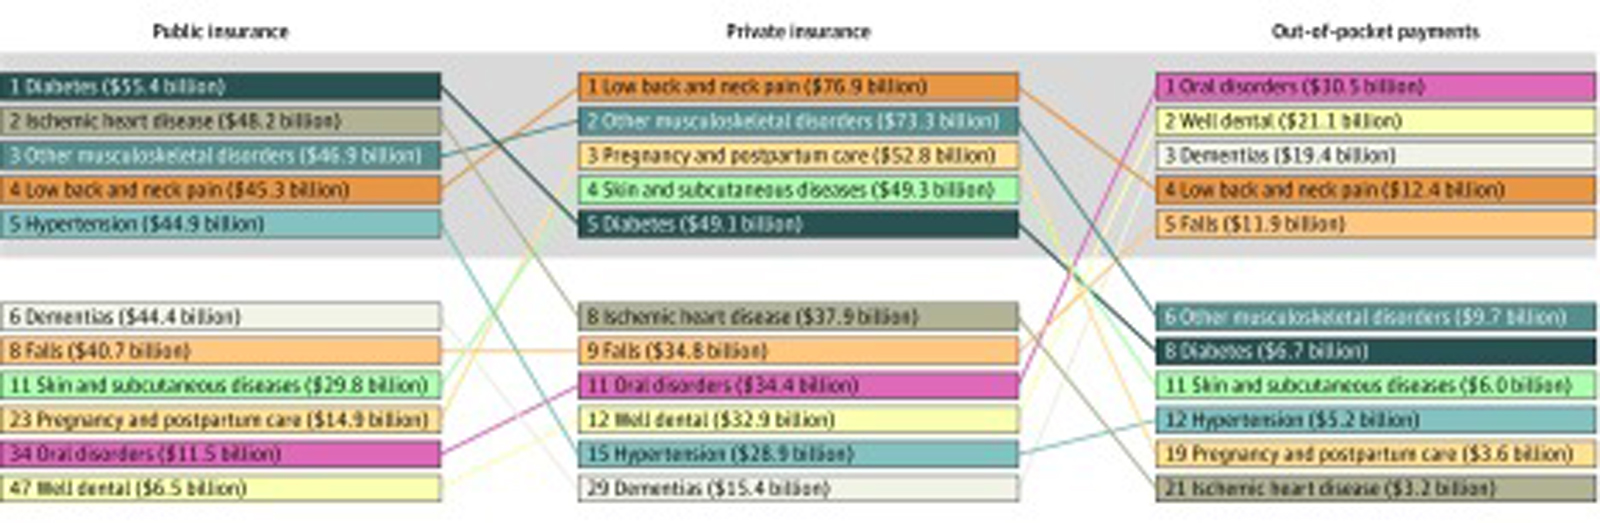
Estimated Health Care Spending by Payer and Type of Care in 2016
Reported in 2016 US dollars. The 11 conditions that were in the top 5 for 1 or more payers are depicted with the top 5 in the gray shaded box. Numbers to the left of each entry represent the rank for that payer. The solid lines join the health conditions by payer.