Figure 7.
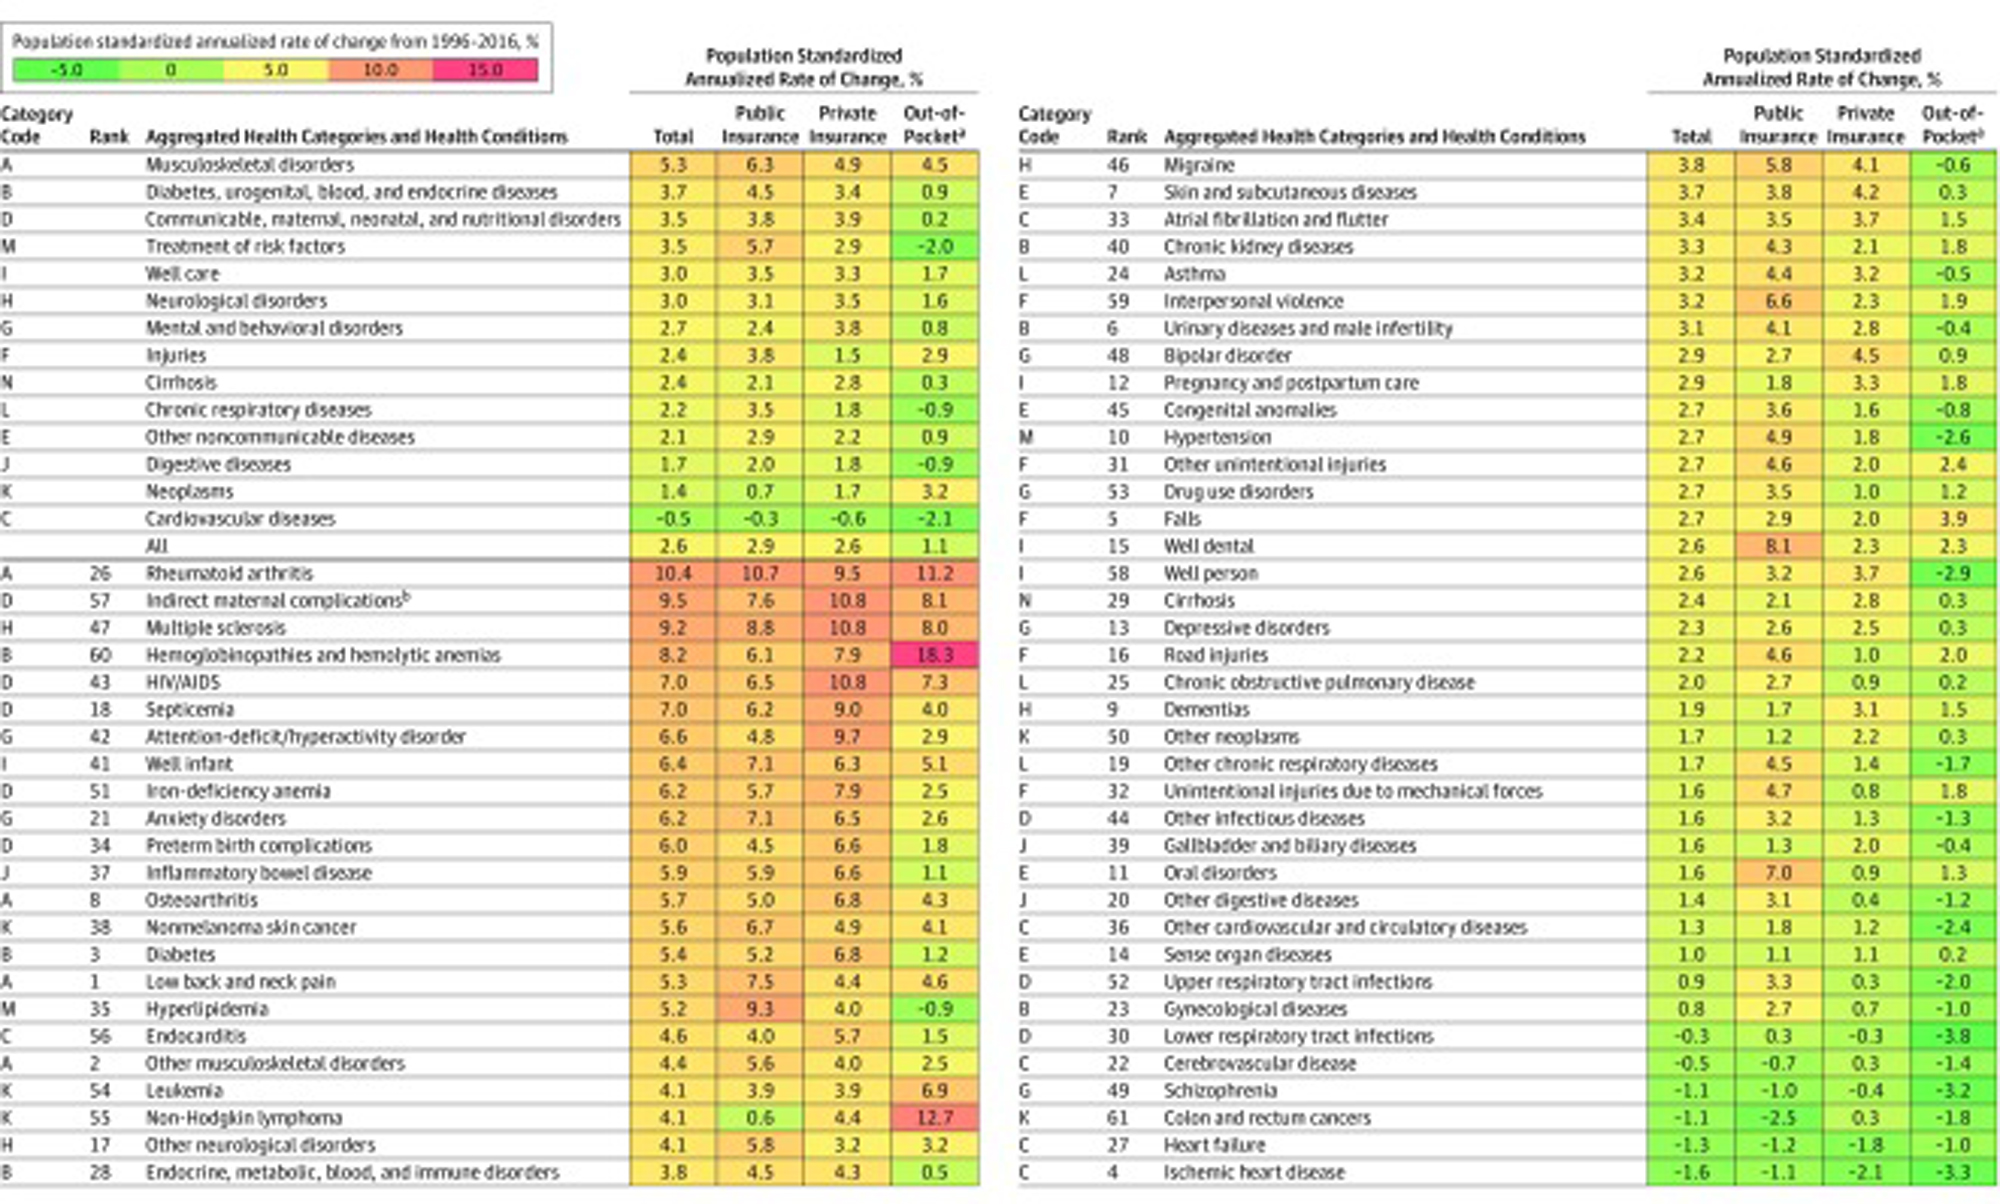
Population Standardized Annualized Rate of Change in Health Care Spending for Health Conditions With More Than $10 Billion in Spending for 2016
The aggregated health categories and health conditions are listed in descending order relative to their rates of change. The 1996 estimated spending growth was adjusted to reflect 2016 population sizes, ages, and sex. Data for all health conditions appear in eTable 12.2 in the Supplement.
a Out-of-pocket payments.
b Due to a preexisting condition.