Warning: The NCBI web site requires JavaScript to function. more...
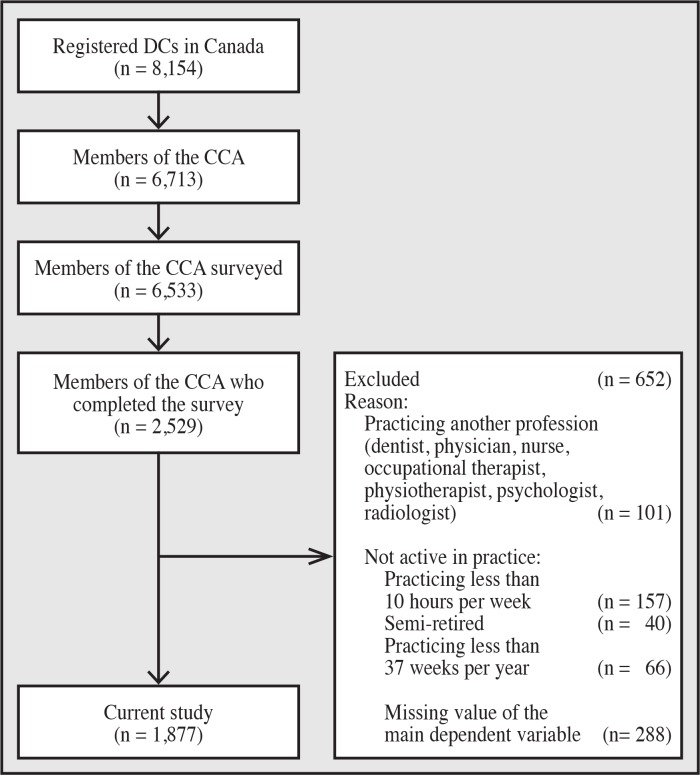
Flow chart diagram showing the inclusion and exclusion of respondents through each stage of the study