Fig. 2
 Change in the four primary outcomes by treatment group.
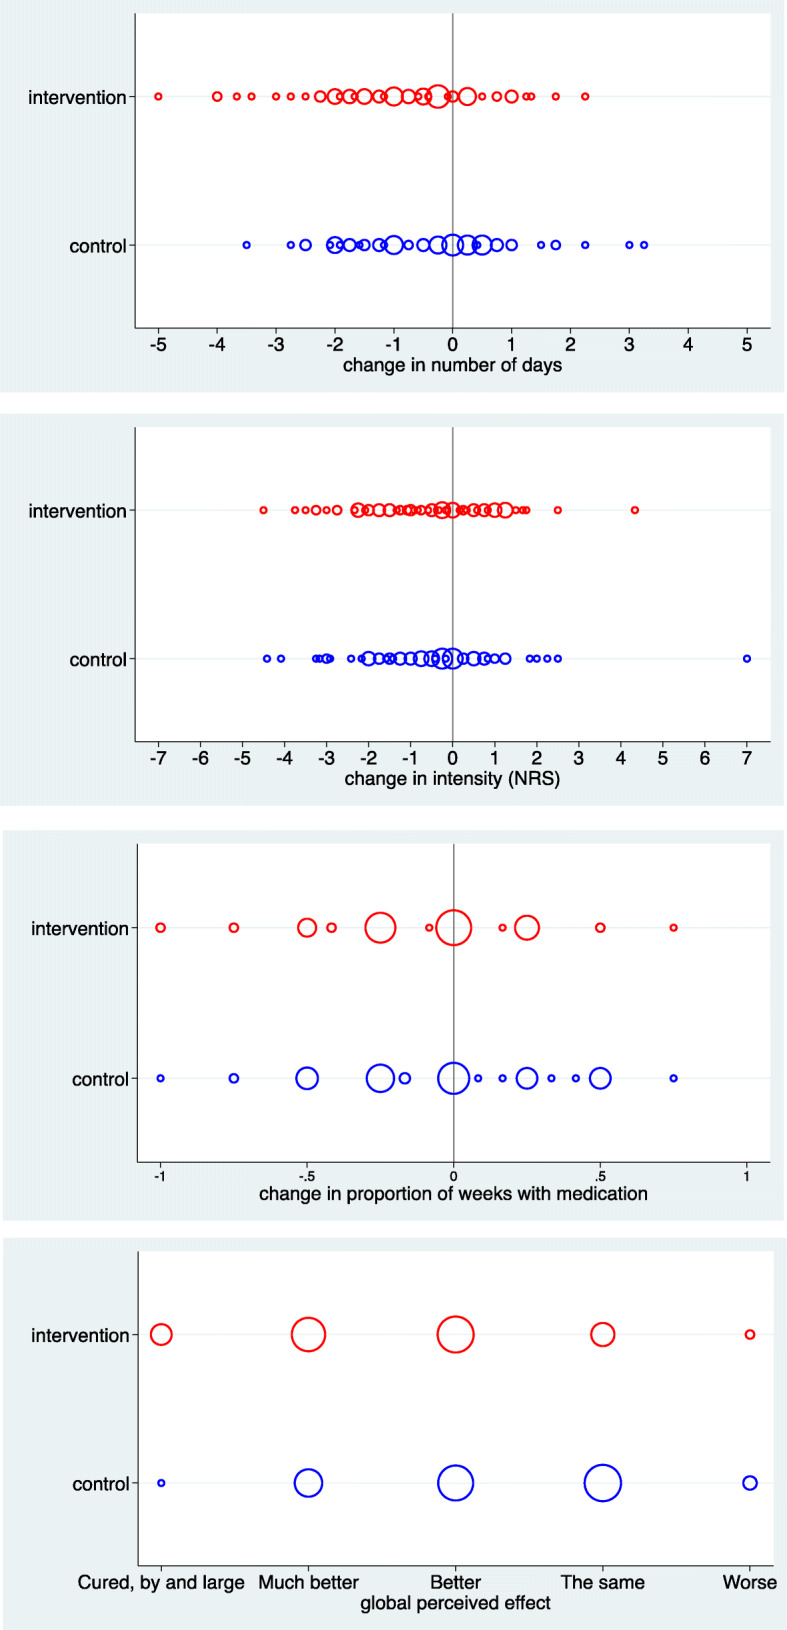
The size of the symbols is proportional to the number of children
Fig. 2
The size of the symbols is proportional to the number of children