PMC full text:
Published online 2019 Feb 25. doi: 10.1038/s41598-019-39577-5
Figure 3
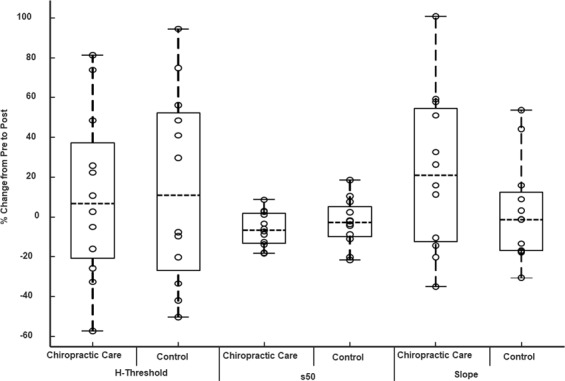
Effect of chiropractic care on H-reflex parameters: the effects are shown in the boxplot for percentage change from the values obtained from the period preceding the chiropractic care or control intervention. ‘o’ represents an individual data point, ‘------’ represents the median value There were no significant changes in the threshold for eliciting the reflexes, s50 or slope following either intervention.