

Development and Validation of a Model Predicting Post-Traumatic
Headache Six Months After a Motor Vehicle Collision in AdultsThis section is compiled by Frank M. Painter, D.C.
Send all comments or additions to: Frankp@chiro.org


FROM: Accident Analysis and Prevention 2020 (May 20); 142: 105580 ~ FULL TEXT
OPEN ACCESS Carol Cancellierea, Eleanor Boylec, Pierre Côté, Lena W. Holm, Louis-Rachid Salmig, J. David Cassidy
Faculty of Health Sciences,
Ontario Tech University,
Oshawa, Ontario, Canada;
Centre for Disability Prevention and Rehabilitation,
Ontario Tech Universty and Canadian Memorial Chiropractic College,
Oshawa, Ontario, Canada.
Importance: The prognosis of post-traumatic headache is poorly understood.
Objective: To develop 0and validate a prognostic model to predict the presence of post-traumatic headache six months after a traffic collision in adults with incident post-traumatic headache.
Design: Secondary analyses of adults with incident post-traumatic headache injured in traffic collisions between November 1997 and December 1999 in Saskatchewan, Canada (development cohort); and between January 2004 and January 2005 in Sweden (validation cohort).
Setting: The Saskatchewan cohort (development) was population-based (N = 4162). The Swedish cohort (validation) (N = 379) were claimants from two insurance companies covering 20 % of cars driven in Sweden in 2004.
Participants: All adults injured in traffic collisions who completed a baseline questionnaire within 30 days of collision. Excluded were those hospitalized >2 days, lost consciousness >30 min, or reported headache <3/10 on the numerical rating scale. Follow-up rates for both cohorts were approximately 80 %.
Predictors: Baseline sociodemographic, pre-injury, and injury factors.
Outcome: Self-reported headache pain intensity ≥3 (numerical rating scale) six months after injury.
Results: Both cohorts were predominantly female (69.7 % in Saskatchewan, 65.2 % in Sweden), with median ages 35.9 years (Saskatchewan), and 38.0 years (Sweden). Predictors were age, work status, headache pain intensity, symptoms in arms or hands, dizziness or unsteadiness, stiffness in neck, pre-existing headache, and lower recovery expectations. With a positive score (i.e., ≥0.75 probability), the model can rule in the presence of post-traumatic headache at six months (development: specificity = 99.8 %, 95 % CI 99.5 %-99.9 %; sensitivity = 1.6 %, 95 % CI 1.0 %-2.6 %; positive likelihood ratio (LR+) = 8.0, 95 % CI 2.7-24.1; negative likelihood ratio (LR-) = 1.0, 95 % CI 1.0-1.0; validation: specificity = 95.5 %, 95 % CI 91.1 %-97.8 %; sensitivity = 27.2 %, 95 % CI 20.4 %-35.2 %); LR+ = 6.0, 95 % CI 2.8-13.2; LR- = 0.8, 95 % CI 0.7-0.8).
Conclusions and relevance: Clinicians can collect patient information on the eight predictors of our model to identify patients that will report ongoing post-traumatic headache six months after a traffic collision. Future research should focus on selecting patients at high risk of poor outcomes (using our model) for inclusion in intervention studies, and determining effective interventions for these patients.
KEYWORDS: Craniocerebral trauma; Neck injuries; Post-traumatic headache; Prognosis.
From the FULL TEXT Article:
Introduction
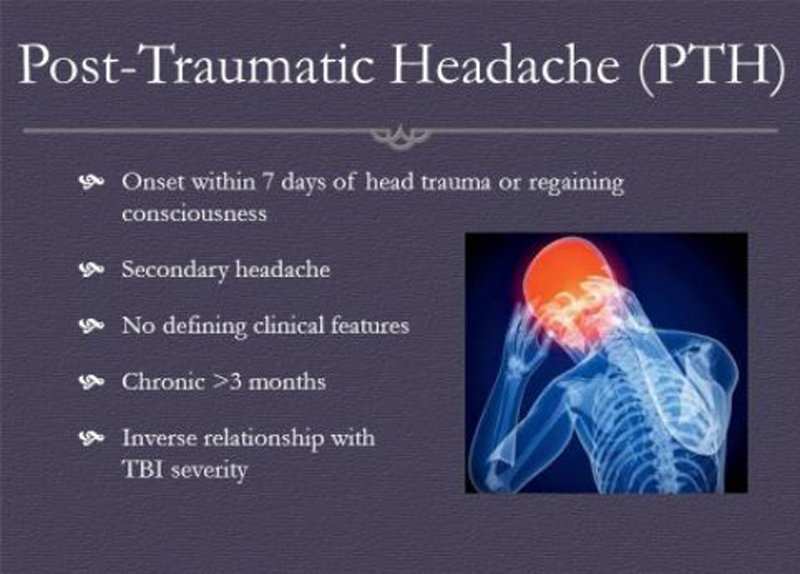
According to the International Classification of Headache Disorders—ICHD-3, post-traumatic headache (PTH) is defined as a new headache, or worsening of a pre-existing headache beginning within seven days after head injury, whiplash, craniotomy, or regaining of consciousness following trauma [Headache Classification Committee of the International Headache Society, 2013]. Some evidence suggests that the onset of PTH may be delayed and begin within 30 days of the injury [Headache Classification Committee of the International Headache Society, 2013]. The pathophysiology of PTH is poorly understood, but its etiology likely includes physical and psychological causes [Ferrari et al., 2005].
PTH is associated with mild traumatic brain injury (MTBI) and whiplash-associated disorders (WAD) [Ferrari et al., 2005; Cassidy et al., 2014a]. The annual incidence of MTBI and WAD is approximately 600 per 100,000 persons [Cassidy et al., 2004, 2000]. Individuals with MTBI and WAD experience a constellation of symptoms known as postconcussion symptoms (PCS) [Ferrari et al., 2005; Cassidy et al., 2014b; American Psychiatric Association, 2000; Marshall et al., 2012]. PTH is the most common PCS and it may persist for up to one year postinjury in 30 % of individuals [Ferrari et al., 2005; Cassidy et al., 2014b]. Persistent PTH results in personal suffering, disability and impaired quality of life [Leonardi et al., 2005; Russo et al., 2014]. The World Health Organization [1992] recognizes headache disorders as a highpriority public health problem, deserving greater attention in research and healthcare [Leonardi et al., 2005].
The proportion of individuals affected by PTH after motor vehicle collisions (MVC) varies between 48 % and 86 %, given heterogeneous patient populations. [Ferrari et al., 2005; Cassidy et al., 2014a; Lucas et al., 2014; Sawyer et al., 2015; Crutebo et al., 2010; Partheni et al., 2000] Whiplash-associated disorders and head injuries are common in MVCs [Schelp and Ekman, 1990]. However, very little is known about the prognostic factors of PTH. Therefore, our objective was to develop and validate a prediction model for reporting PTH six months following MVC in adults who reported PTH during their baseline interview within 30 days of their collision.
Methods
This study complied with the transparent reporting of a multivariable prediction model for individual prognosis or diagnosis (TRIPOD) statement [Moons et al., 2015]. It was approved by the Research Ethics Boards (REBs) of the University of Toronto, and the University Health Network. The original studies were previously approved by the REBs of the University of Saskatchewan, and the University of Alberta (development cohort), and the Regional Committee on Ethics at Karolinska Institute, Stockholm (validation cohort).
Study design and participants
Development cohort (Saskatchewan): We conducted a secondary analysis of a population-based incidence cohort study. All adults treated for motor vehicle injuries in the province of Saskatchewan, Canada, a province with approximately 743,210 adults (1998) [Saskatchewan Government, 2020], were followed for one-year after injury (i.e., between December 1, 1997 and November 30, 1999). Details on the cohort formation are published elsewhere [Johansson et al., 2015; Cassidy et al., 2007]. Isolated neck pain after traffic injury is extremely rare; rather, pain after traffic injury is most commonly reported in multiple body areas [Ferrari et al., 2005; Johansson et al., 2015; Cassidy et al., 2007; Hincapie et al., 2010; Côté et al., 2019]. While WAD is typically labelled as a neck injury, it is best acknowledged as a syndrome that extends well beyond the neck region [Ferrari et al., 2005; Hincapie et al., 2010].Validation cohort (Sweden): We conducted a secondary analysis of an incidence cohort study of personal injury claimants to two Swedish traffic insurers. Sweden had approximately 7,200,000 adults in 2004 [Statistics Sweden, 2020]. The insurers, Trygg-Hansa and Aktsam, insured about 20 % of cars driven in Sweden in 2004 [Holm et al., 2008a]. The inception period was between January 15, 2004, and January 12, 2005, and the participation rate was 76 %. Details on the formation of the cohort are published elsewhere [Holm et al., 2008a]. As with the Saskatchewan cohort, the Swedish cohort comprised adults reporting injury in multiple body areas.
Despite some differences in data collected from both cohorts, we selected Sweden as the validation cohort because of the similarities between Saskatchewan and Sweden [L. Holm, personal communication, March 15, 2015]. Both are Western populations. They experienced the same climates with four distinct seasons of similar lengths, they had similar car safety laws and speed limits, universal access to health care, and they had comparable processes for making insurance claims after a traffic collision.
Eligibility criteria We included all adults who made a bodily injury claim or were treated by a registered health professional for a motor-vehicle related injury, and were at least 18 years old at the time of the collision. We excluded those who (1) did not occupy a motor vehicle at the time of the collision, (2) completed their baseline questionnaire>30 days after their collision, (3) reported being hospitalized>2 days as a result of the collision, (3) reported lost consciousness>30 min after the collision (Saskatchewan cohort only), and (4) reported that the “accident caused” headache with intensity<3/10 on the 11-point numerical rating scale (NRS) at the time of completing their baseline questionnaire. The Saskatchewan cohort was asked about “average” headache intensity over the prior week, while the Swedish cohort was asked about “current” headache intensity.Data collection
In both cohorts, baseline data were collected through a self-report questionnaire, which included sociodemographic factors (e.g., age, education), preinjury health status (e.g., pre-existing headache), injuries and other symptoms experienced since the collision (e.g., arm pain, dizziness), depressive symptomology, and recovery expectations. Validated measures were used to collect data wherever possible, such as the NRS for pain intensity, [Jensen et al., 1986] overall general health (Zajacova and Dowd, 2011), and the Centre for epidemiological Studies – Depression Scale (CES-D) (Devins et al., 1988). Follow-up data was collected by computer-assisted telephone interview in Saskatchewan and self-reported questionnaire in Sweden.
Outcome
PTH at six months was defined as self-reported headache as a result of the accident (≥3 NRS) at six months after the collision. Similar to the baseline questionnaires, the Saskatchewan cohort was asked about “average” headache intensity over the prior week, while the Swedish cohort was asked about “current” headache intensity.
AnalysisModel development and validation All analyses were conducted using SAS software, version 9.4 (SAS Institute Inc.). Model development and validation occurred in five steps.
Step 1: candidate predictors. In prediction modelling, predictors should be selected based on previous studies and clinical knowledge rather than solely relying on statistical selection methods. [Steyerberg and Vergouwe, 2014] It is reasonable to include all clinically relevant predictors in a prediction model despite non-significant univariable associations. We selected 36 baseline characteristics as candidate predictors (Table 1) using the scientific literature, clinical knowledge, and the International Classification of Functioning, Disability and Health (ICF) model [Leonardi et al., 2005; Moons et al., 2012; Royston et al., 2009]. Candidate predictors are correlated to, but not necessarily causal of the target outcome and typically include sociodemographic factors, health history, and physical examination findings [Steyerberg, 2009]. We grouped the candidate predictors according to the five domains of the ICF model: (1) personal factors, (2) impairments, (3) activity limitations, (4) participation restrictions, and (5) environmental factors (barriers or facilitators in the physical, social and attitudinal environment).
In the personal factors domain, female sex has been shown to be associated with poorer outcomes with respect to PTH, [Sawyer et al., 2015] WAD [Holm et al., 2008b; Scholten-Peeters et al., 2003; Walton et al., 2013], and migraine [Buse et al., 2013]. Younger age has been shown to be associated with worse PTH outcomes [Sawyer et al., 2015], whereas studies of WAD [Holm et al., 2008b; Scholten-Peeters et al., 2003; Bohman et al., 2012] and mTBI demonstrated that older age is associated with worse outcomes [Cassidy et al., 2014b; Carroll et al., 2004; Scopaz and Hatzenbuehler, 2013]. Being a student has been shown to be associated with worse outcomes in the mTBI literature [Carroll et al., 2004; Mann et al., 2004]. The level of education has been shown to be predictive of a number of health-related outcomes, with higher education being associated with improved outcomes [Marshall et al., 2015]. Lifestyle factors (e.g., smoking and alcohol consumption, diet, and physical activity) [Lantz et al., 2001], and other personal characteristics (e.g., self-efficacy, coping, pain catastrophizing, fearavoidance beliefs, and self-esteem) significantly influence health. Selfefficacy refers to individuals’ assessments of their effectiveness or competency to perform a specific behaviour successfully required to produce certain outcomes [Khaw et al., 2008]. It has a beneficial effect on health behaviour and health status in adults [Bandura, 2004]. Pain catastrophizing refers to feelings of helplessness, active rumination and excessive magnification of cognitions and feelings toward the painful condition [Grembowski et al., 1993]. Ineffective coping mechanisms, pain catastrophizing, and fear-avoidance beliefs (i.e., fear of movement) are associated with physical disability in both acute injury and chronic pain conditions, including whiplash [Leung, 2012; Penley et al., 2002; Sullivan et al., 2011; Nederhand et al., 2004]. Finally, self-esteem is a protective factor in physical and mental health [Andersen et al., 2016].
The ICF model characterizes impairments as problems with function or structure (e.g., signs, symptoms, and abnormal clinical or laboratory findings). Various physical and psychological impairments have been shown to be associated with poor outcomes after injury. Initial pain intensity, such as headache intensity and neck pain intensity was shown to be associated with poor outcomes after mTBI Cassidy et al., 2014b and WAD [Holm et al., 2008b; Walton et al., 2013; Bohman et al., 2012; Carroll et al., 2009a; Williams et al., 2007]. Pain areas, such as arm pain, have been shown to be associated with poor outcomes after mTBI [Cassidy et al., 2014b], and pain other than neck and back pain has been shown to be predictive for recovery after WAD [Bohman et al., 2012]. Depression, anxiety and stress have also been shown to affect recovery after mTBI, [Cassidy et al., 2014b] and WAD [Sterling et al., 2005]. Impairments such as bone fractures, and vision and hearing problems may contribute to injury-related stress and thus may help to predict PTH at six months [Nash and Thebarge, 2006]. A wide range of symptoms may be reported after traffic collisions. For example, associated with poor outcomes after WAD are dizziness and fatigue [Williams et al., 2007]. These symptoms are also associated with poor outcomes after mTBI [Cassidy et al., 2014b; Scopaz and Hatzenbuehler, 2013; Mann et al., 2004]. Loss of consciousness, post-traumatic amnesia, and disorientation or confusion, are used in diagnosing mTBI. They have not been shown to be prognostic of recovery after mTBI; Cassidy et al., 2014b however, it is not known whether any or all of these signs help predict recovery of PTH. General health and comorbidities are potentially important predictors of outcomes in adults with PTH. Individuals with poor health are susceptible to comorbidities and symptoms. Having poor health or comorbidities is stressful, and headache could be a side effect of medications [Kuhn et al., 2010]. Preexisting health conditions or comorbidities such as pre-existing headache, musculoskeletal problems and mental or emotional problems have been shown to predict morbidity after trauma including mTBI [Cassidy et al., 2014b; Sawyer et al., 2015; Hassani-Mahmooei et al., 2016]. Some researchers also speculate that repeated head injuries delay the recovery from post-concussion symptoms [Guskiewicz et al., 2003].
Activity limitations and participation restriction are important to consider as candidate predictors. Activity limitations may occur in the home, work, or school. Participation restriction refers to problems with recreational activities, as well as problems with interpersonal relationships and quality of life. Initial restrictions in activities of daily living and recreation predicted prolonged symptoms after WAD [Sterling et al., 2005].
An individual’s physical, social and attitudinal environment should be considered when attempting to predict health outcomes [Seeman and Crimmins, 2001]. For example, loud noise or glaring lights in the physical environment can trigger migraines [Headache Classification Committee of the International Headache Society, 2013]. Finally, recovery expectation, influenced in part by society, has been shown to be predictive of recovery in many conditions including mTBI [Cassidy et al., 2014b], WAD [Bohman et al., 2012], and cancer [Watson et al., 2005].Candidate predictors were summarized using frequencies and percentages. Age was categorized as 18–23, 24–29, 30–39, 4–049, and ≥50 years [Cassidy et al., 2014a]. Headache pain intensity was categorized as mild to moderate pain (3–7), and severe pain (8–10) [Bohman et al., 2012; Fejer et al., 2005; Zelman et al., 2003; Jensen et al., 2001]. The other pain areas (neck, midback, low back, and face) were dichotomized (≥3 indicated pain) to remain consistent with our definition of headache (≥3 NRS).
Step 2: multivariable analysis. We followed best practices to develop our prediction model by using a combination of clinical knowledge and data-based methods. In contrast to causal modelling, in prediction modelling, a simple, robust model may not fit the data perfectly, but is preferred to a complex, overly fine-tuned model for the specific data under study. This is because overspecifying a model may lead to one that may not generalize to new subjects outside the data under study (i.e., an overfitted model) [Steyerberg and Vergouwe, 2014]. While candidate predictors are considered in the multivariable analysis, they do not necessarily end up in the final model. Often, a parsimonious model is preferred if it performs as well as a full model. We began by selecting all clinically relevant predictors, then used a data-driven predictor selection strategy, whereby predictors that do not contribute usefully in the multivariable model are removed [Moons et al., 2012]. Backward elimination is a preferred strategy for prediction models, beginning with all candidate predictors and running a sequence of tests to remove or keep variables in the model [Moons et al., 2012; Royston et al., 2009]. This is based on a predefined nominal significance level for variable removal (e.g., 0.10, 0.05, or 0.01). We developed the model using complete case analysis and multivariable logistic regression with backward elimination (p-value 0.01 for removal given the large sample size of the development cohort) [Steyerberg, 2009]. Age and pain intensity did not have a linear relationship with the logit, thus were categorized into clinically meaningful and interpretable cut-points as stated above.
We tested two interaction terms based on previous literature, [Bohman et al., 2012; Carroll et al., 2009a, b] (1) baseline headache pain intensity and recovery expectations, and (2) baseline headache pain intensity and depression. We hypothesized that adults would report poorer recovery expectations and higher levels of depression if they reported severe, rather than low to moderate, baseline headache pain intensity. As with other candidate predictors, we included interaction terms in the model if they remained in the multivariable logistic regression after backward elimination ((p-value 0.01 for removing variables) [Steyerberg, 2009]. If multicollinearity was present (variance inflation factor (VIF)>2.5), the predictor that was judged to be the least clinically important was removed [Bohman et al., 2012].
Step 3: model evaluation. We reported standard measures of discrimination: concordance statistic (c-statistic), sensitivity, specificity, and positive and negative likelihood ratios; and calibration: the Hosmer-Lemeshow (H–L) test, and calibration plot [Steyerberg, 2009; Harrell et al., 1996; Hosmer and Lemeshow, 2004; Steyerberg et al., 2010; Kraft et al., 2009].
Decision-analytic measures are needed if the model is to be used for making clinical decisions, such as giving patients prognostic estimates, and deciding on treatment strategies [Steyerberg et al., 2010]. A probability threshold can be selected to categorize patients as positive or negative and to weight false positive and false negative classifications. The harm to benefit ratio defines the relative weight of falsepositive decisions to true-positive decisions. For example, the probability threshold may be low if the harm or unnecessary treatment (a false-positive decision) is relatively limited. On the other hand, if treatment or overtreatment is harmful, a higher probability threshold may be selected before making a treatment decision. The ideal threshold would be one that minimizes bad consequences for those classified as false positive and false negative. For our model, we decided that mitigating false positives is more clinically important than reducing false negatives for predicting poor outcomes for adults with PTH because there are currently no known effective treatments [Côté et al., 2015] and overtreatment may do more harm than good [Cassidy et al., 2007; Côté et al., 2007]. Thus, we opted to categorize patients as "positive" at a high probability threshold that maximized the specificity of the model while keeping the prevalence of positive results high.
Step 4: internal validation. The model was internally validated using random bootstrap resampling with replacement (200 samples) [Moons et al., 2015].
Step 5: external validation. We used the beta coefficients from the revised Saskatchewan model that included the characteristics that were available in the Swedish dataset. In this dataset, information was not collected for the characteristics midback pain, face pain, unusual fatigue or tiredness, and current general health status.
Missing follow-up PTH data In both cohorts, the baseline characteristics were compared between those who responded to the headache pain intensity question at six months and those who did not, using the chi-square statistic.
Sensitivity analysis Sensitivity analyses are important to assess the robustness of findings or conclusions in a study. We conducted sensitivity analyses to assess the impact of missing outcome data on the overall conclusions of our study. Missing outcome data can result in selection bias. If, after performing sensitivity analyses the findings are consistent with those from the primary analysis and would lead to similar conclusions, we can be assured that the missing outcome data had little or no influence on our conclusions. In this case, the results or conclusions are considered “robust”. Specifically, we tested if imputing missing outcome values according to three different scenarios lead to different models and predictive abilities. The three scenarios were: (1) assumed “no PTH” for those with a missing outcome value (best case scenario); (2) assumed “PTH” (worst case scenario); and (3) “carry forward the last observation” (whether at six weeks or three months). We selected the extremes - best and worst case scenarios - to test the stability of the model. The multivariable analysis was repeated for each scenario and the discrimination statistics of the resulting three models were compared to those resulting from the complete case analysis.
Results
Participants in the development and validation cohorts
The median time between the date of collision and completing the baseline questionnaire was 10 days (1st to 3rd quartiles 6–16) in the Saskatchewan cohort, and 22 (1st to 3rd quartiles 17–27) in the Swedish cohort. The number of eligible participants was 4162 (Saskatchewan) and 379 (Sweden) (Fig. 1). The final samples included participants with complete outcome and predictor information (Saskatchewan: n = 2949, 71 %; Sweden: n = 293, 77 %).

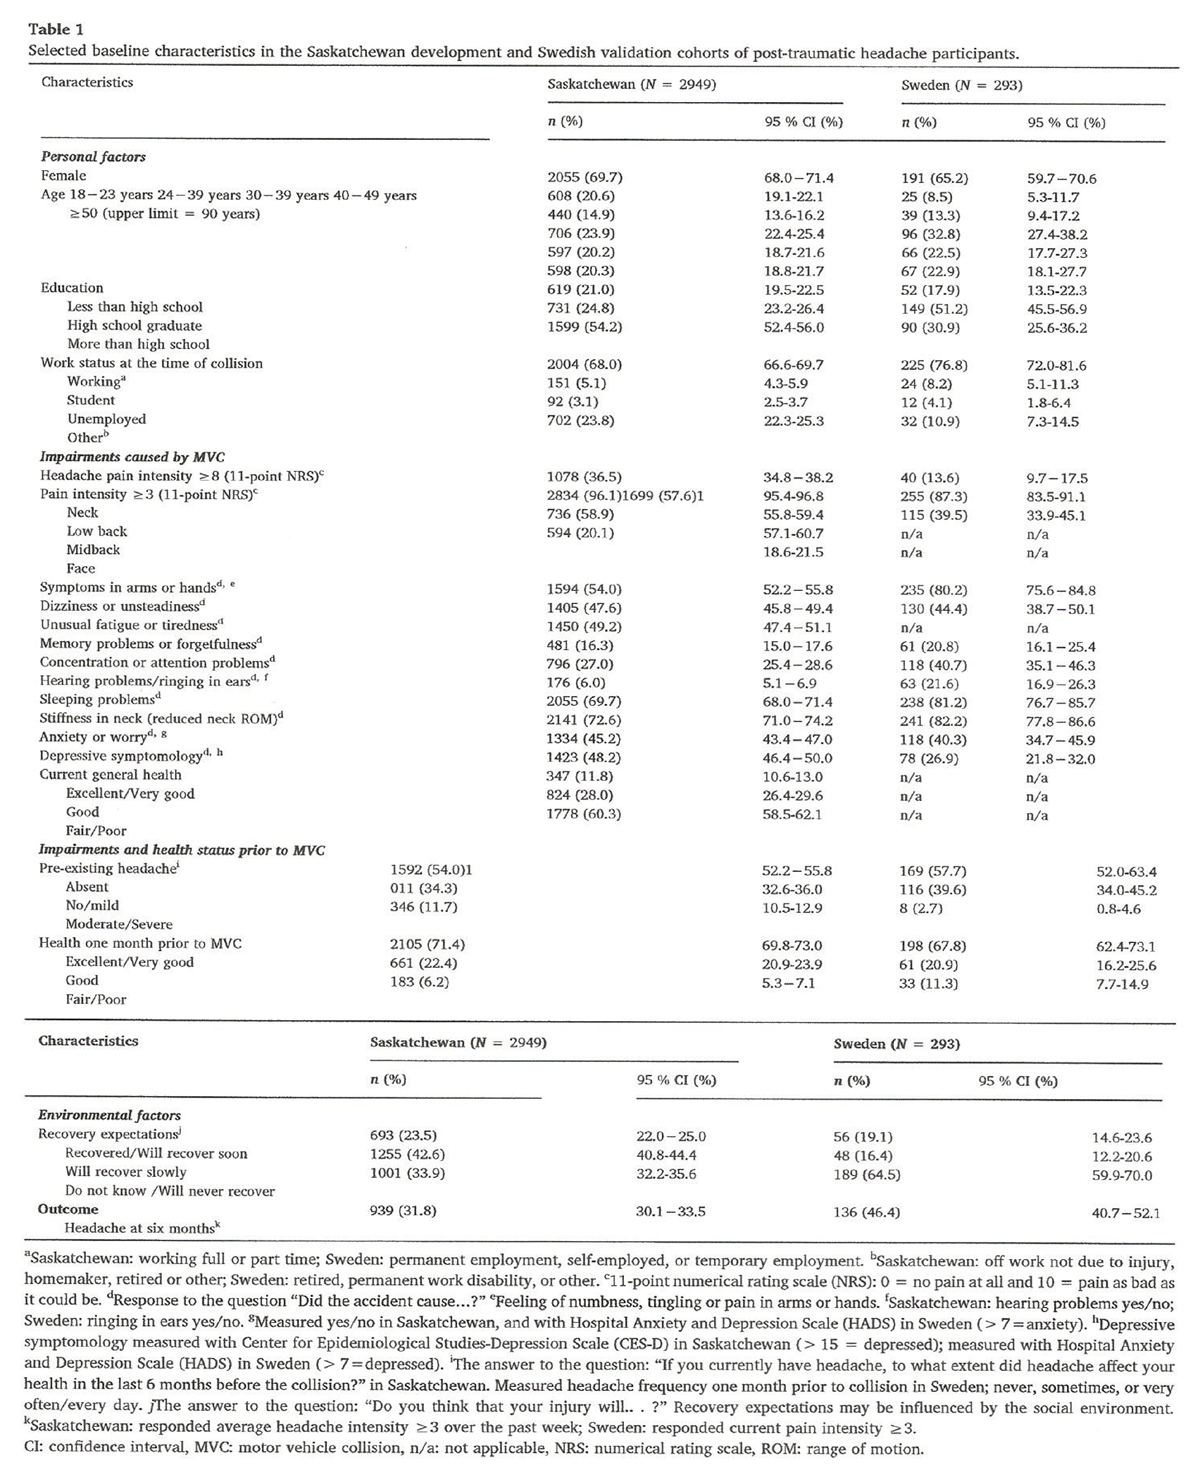
Table 1 Both cohorts were predominantly female (69.7 % Saskatchewan, 65.2 % Sweden). The median age was 35.9 years (1st to 3rd quartiles 25.6–47.2) in Saskatchewan, and 38.0 years (1st to 3rd quartiles 30.0–47.0) in Sweden (Table 1). A larger proportion of participants reported severe headache pain intensity at baseline in Saskatchewan (n = 1078, 36.5 %) compared to Sweden (n = 40, 13.6 %). A larger proportion of participants reported PTH at six months in Sweden (n = 136, 46.4 %) compared to Saskatchewan (n = 939, 31.8 %).
Model development and validation
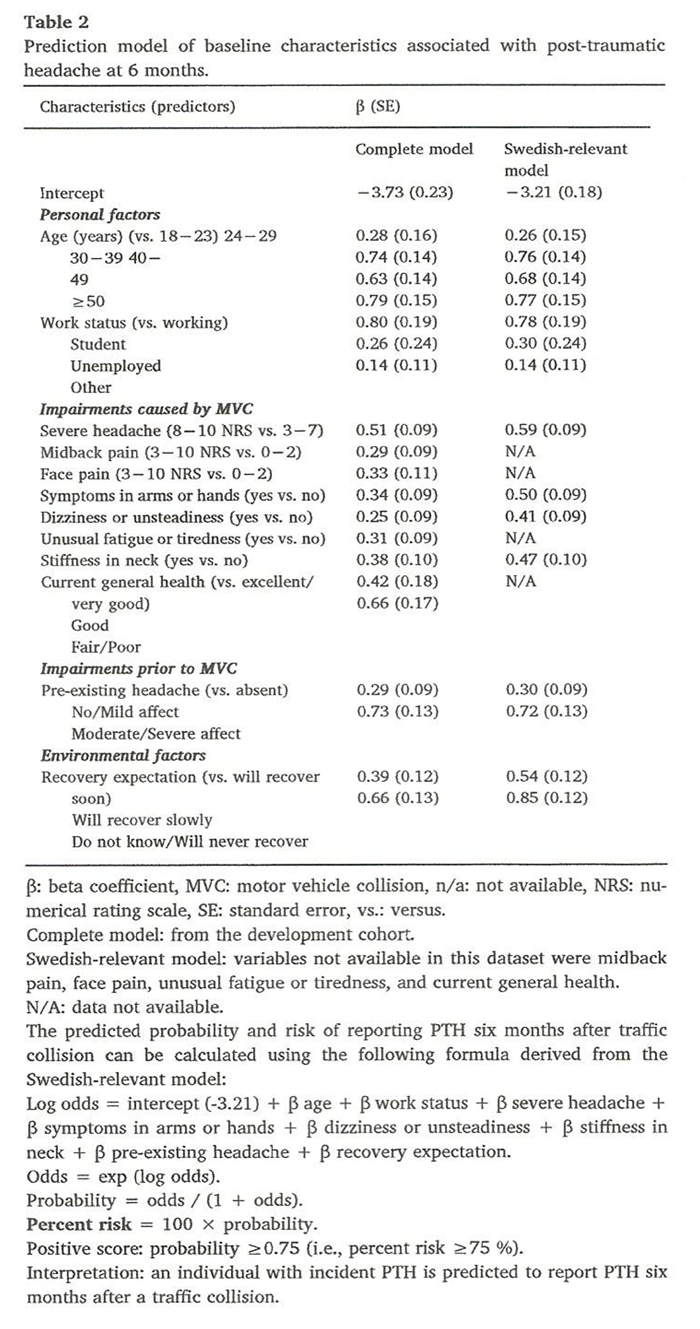
Table 2 During assessment for multicollinearity, all VIF values were less than 2.5, thus there were no problems with multicollinearity. Multivariable analysis resulted in a prediction model including: age, work status, headache pain intensity, midback pain, face pain, symptoms in arms or hands, dizziness or unsteadiness, unusual fatigue or tiredness, stiffness in neck, poorer current general health, pre-existing headache, and lower recovery expectations (Table 2). The two interaction terms did not make it into the model. We could not validate this full model in the Swedish cohort because four predictor variables were not available (midback pain, face pain, unusual fatigue or tiredness, and poorer current general health). Therefore, we tested the performance of the parsimonious, Swedish-relevant model (with four fewer predictor variables) in the development cohort prior to externally validating it.
Table 3
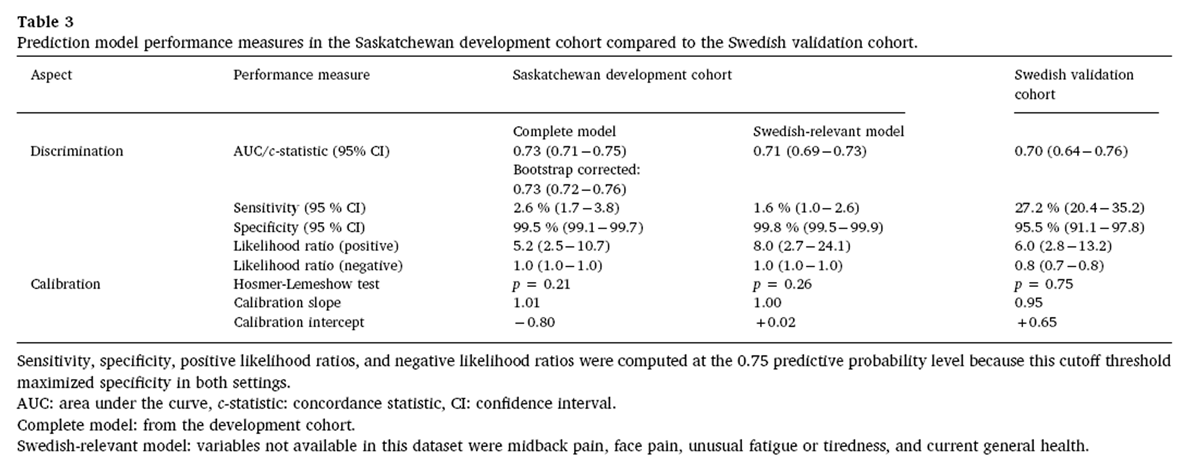
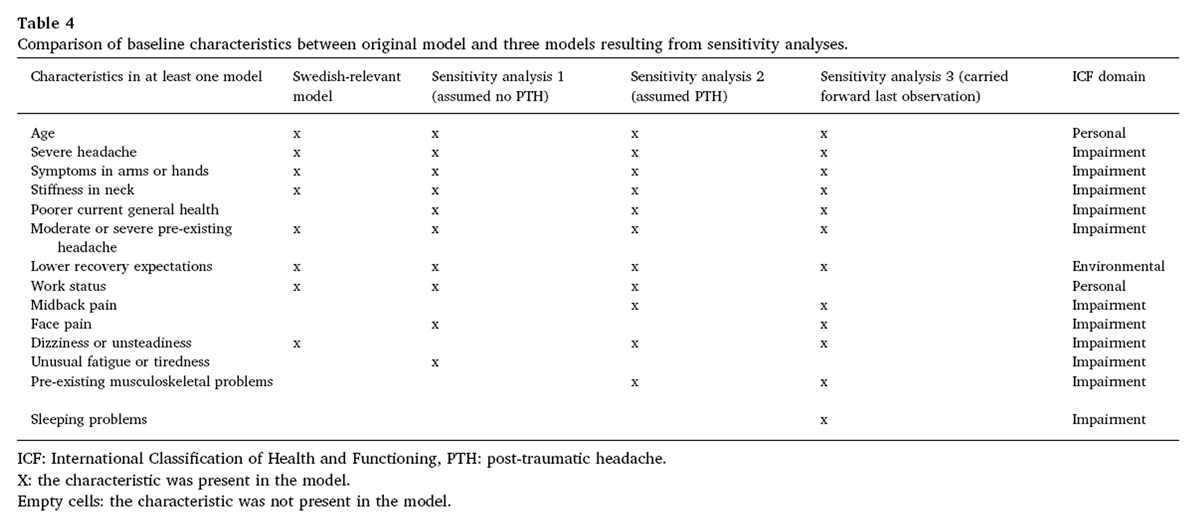
Table 4 We opted to categorize patients as "positive" (i.e., will have PTH at six months) at a high probability threshold that maximized the specificity of the model while keeping the prevalence of positive results high. Therefore, we selected a probability threshold of 0.75 because this value appeared to best meet these criteria in the Swedish-relevant model (Table 3; see also eTable 2 – full model). This means that anyone who scores a probability level of 0.75 or higher using our model would be categorized as "positive" for the likely presence of PTH at six months after a traffic collision. At this level, the development (Swedish-relevant) model specificity was 99.8 % (95 % CI 99.5 %–99.9 %) and LR + 8.0 (95 % CI 2.7–24.1) (Table 3). The validation model specificity was 95.5 % (95 % CI 91.1 %–97.8 %) and positive LR + 6.0 (95 % CI 2.8–13.2) (Table 3, Table 4). The full prediction formula is presented in Table 2. Inserting the correct regression coefficients of observed values (β) from Table 2 will yield individual probabilities of the outcome. Further, multiplying the probability by 100 will translate the probability into percent risk.
Missing data and sensitivity analyses
Participants with missing outcome information (Saskatchewan: n = 1,067, 25.6 %; Sweden: n = 77, 20.3 %) or missing data on predictors (Saskatchewan: n = 146, 3.5 %; Sweden: n = 9, 2.4 %) were excluded from the analysis. In general, a higher proportion of participants with incomplete outcome data in both cohorts reported depressive symptomology, anxiety, pre-existing headache, and poorer health (eTable 5, eTable6).
We imputed outcome values for the missing outcomes according to three different scenarios. The original 8-predictor model (Table 4) and the three models developed from sensitivity analyses (eTables 7–10) consisted of between 8 (Swedish-relevant) and 12 (“carry forward last observation”) predictors. The four models had the majority of predictors in common (n = 6) – age, severe PTH, symptoms in arms or hands, stiffness in neck, moderate or severe pre-existing headache, and lower recovery expectations. Compared to the Swedish-relevant model, the predictive abilities of the three other models were slightly lower. The “best case” model was most similar to the Swedish-relevant model, consisting of all predictors except dizziness or unsteadiness. The “best case” model also included the predictors poorer current general health, face pain and unusual fatigue or tiredness.
Discussion
To the best of our knowledge, we are the first to develop and externally validate a prediction model to predict PTH six months after a collision in adults who were identified as having PTH at their baseline interview. On their own, discrimination and calibration measures such as the c-statistic, H–L test and calibration plot, are not clinically useful [Steyerberg, 2009]. Rather, clinicians need to identify who is likely to have the target disorder which is best expressed by likelihood ratios. Thus, we selected a threshold value that best suits clinicians’ and researchers’ needs – to rule in PTH and minimizing false positives given the lack of effective interventions for PTH, as well as identifying people at high risk of poor outcomes that should be targeted in trials [Côté et al., 2015]. The magnitude of the positive likelihood ratios in both cohorts further adds to the value of using our rule for these purposes. We grouped our predictors according to the ICF model. [Leonardi et al., 2005] Most of the predictors fall under the ICF domain ‘impairments’, with ‘personal’ and ‘environmental’ factors also present. Our results align with prediction models developed for people recovering after traffic injuries [Bohman et al., 2012; Hartling et al., 2002; Ritchie et al., 2013; McLean et al., 2014], with respect to overall predictive accuracy and predictors. For instance, other models generally included a combination of sociodemographic (e.g., age), psychosocial (e.g., posttraumatic stress symptoms, recovery expectations), pre-injury (e.g., prior head pain) and physical (e.g., head, neck or back pain) predictors. Interestingly, in line with other studies on the prognosis of mTBI, [Cassidy et al., 2014b] factors specific to head injury – LOC and posttraumatic amnesia - were not predictive of PTH at six months.
There were some differences in data collection between the development and validation cohorts. First, the time frames for completing the baseline questionnaire differed (median 10 days in Saskatchewan vs. median 22 days in Sweden). As we move away from the baseline period, we are dealing with prevalent headaches. In other words, the milder incident cases have since improved. Second, there were differences regarding some of the predictor and outcome definitions and measurements. For example, with all pain intensity questions, the Saskatchewan cohort participants were asked about “average” pain over the past week, while the Swedish cohort participants were asked about “current” pain. Current pain and average pain are not the same and average pain over the past week may be a more accurate measure of pain than current pain [Bolton, 1999]. Third, the outcome data were collected through computer-aided telephone interviews in the Saskatchewan cohort, whereas they were collected via a self-report mailed questionnaire in the Swedish cohort. Computer-aided telephone interviews are monitored and quality controlled, and may be more accurate than paper questionnaires. Given these differences between the cohorts, we expected our model to have lower predictive ability during external validation. However, our model performed similarly in both cohorts.
Strengths and limitations
The prediction model was developed using a large population-based incidence cohort. This resulted in stable model estimates [Steyerberg, 2009] leading to similar predictive ability, specificity and positive likelihood ratio when tested in an independent population. The large number of events in the development cohort enabled the assessment of several candidate predictors that have been shown to be related with health outcomes. The predictors were assessed using psychometrically sound measures where available. The model was developed using subject matter knowledge and data-based methods, to achieve a parsimonious and clinically interpretable model based on predictors that clinicians can easily collect. Finally, we conducted a geographic validation study, which is a stringent form of validation [Steyerberg, 2009]. One limitation of our study is the definition of headache. Without a gold standard diagnosis of PTH, we selected a 30-day cut-off for PTH onset based on the literature, [Headache Classification Committee of the International Headache Society, 2013] and we selected a cut-off for pain intensity (≥3 NRS) to capture clinically important pain [Krebs et al., 2007]. Adults were excluded if they were hospitalized for more than two days after the MVC, or if they lost consciousness (LOC) for more than 30 min. These criteria indicate a more severe injury and have been used in previous studies of minor traffic injuries [Cassidy et al., 2014a; Bohman et al., 2012]. LOC was not measured in the Swedish cohort. However, only a small proportion of people likely satisfied this criterion since in Saskatchewan, less than 3% reported LOC greater than 30 min.
Our cohorts were formed 20 years ago, but we are not aware of any secular or time-related changes in the occurrence or recovery of PTH. The datasets were not designed to develop or validate the prediction model; therefore, not all potentially important predictors were available for inclusion. These may include psychological factors (e.g., coping, [Keefe et al., 1992] fear avoidance beliefs, catastrophizing [Sullivan et al., 2011], and self-efficacy) [Williamson et al., 2008]; lifestyle factors (e.g., smoking, alcohol/substance use, diet, exercise, and sleep); symptoms of post-traumatic stress disorder (e.g., avoidance and hyperarousal) [Ritchie et al., 2013], factors related to compensation [Cassidy et al., 2000], factors related to the physical or social environment [Leonardi et al., 2005], or perhaps predictors which have yet to be discovered.
The participation rate in the Swedish cohort was 76 %, potentially contributing to selection bias and reduced model performance. However, those who did not participate were more likely not to have completed the injury claim – supporting the hypothesis that non-responders had a transient injury or no injury. [Crutebo et al., 2010]. We had loss to follow up in the development cohort, and conducted sensitivity analyses testing the extremes (best and worst case scenarios). We found that three different sensitivity analyses resulted in three models that were somewhat different from each other and had lower predictive abilities. Therefore, our model may have preformed more poorly; however, it performed similiarly in the validation cohort as it did in the development cohort.
Developers of prediction models must decide whether it is more important to achieve a high sensitivity or high specificity; high sensitivity comes at the expense of high specificity and vice versa. Because we know very little about the effectiveness of treatments for PTH, it is more important to “rule in” PTH rather than to rule it out [Côté et al., 2015]. Thus, we decided a priori that we valued reducing false positives, although this came at the expense of a significant number of false negatives. We made this decision after considering the consequences of classification – true positive (those who are classified as having a high probability of the target outcome that do develop the outcome), true negative (those who are classified as having a low probability of the target outcome that do not develop the outcome), false positive (those who are classified as having a high probability of the target outcome that do not develop the outcome), and false negative (those who are classified as having a low probability of the target outcome that do develop the outcome) [Kraft et al., 2009]. Offering tests and treatments to all adults with incident PTH after a traffic collision may expose large numbers of patients with a low probability of poor outcomes to unnecessary intervention, which can be costly and potentially harmful [Cassidy et al., 2007; Côté et al., 2007]. A high number of false negatives would be worrisome if effective interventions are held back from patients who could benefit. With the current lack of evidence demonstrating effective treatments for PTH and other common injuries for people with PTH, such as neck and low back pain [Watanabe et al., 2012; Varatharajan et al., 2016], identifying true positives may help to inform a patient of their prognosis and encourage self-management strategies (e.g., exercise, managing sleep and stress) [Marshall et al., 2015]. At best, the range of currently available interventions produce short-term benefits in the form of symptom relief or increased function, and many commonly used interventions provide no more benefit than sham or placebo (e.g., pharmacological therapies, manual therapy of the spine, and cognitive behavioural therapy) [Côté et al., 2015]. Identifying true negatives will help to reassure patients that their condition will improve. Identifying false negatives may not be too problematic at this point if there are no known effective treatments. Finally, identifying false positives may be the most troublesome misclassification, since treatments may not only be ineffective and costly, but may also have harmful side effects [Côté et al., 2007]. Indeed, another analysis using this same Saskatchewan cohort showed that multidisciplinary rehabilitation of whiplash actually delayed recovery [Cassidy et al., 2007].
Implications
Clinicians can use our model to collect information on the eight predictors from patients with PTH after a traffic collision. This information collectively may help clinicians to identify patients who will have ongoing PTH at six months. Clinicans can provide self-management strategies to promote healthful lifestyles and symptom management to all individuals with incident PTH given that these are low-cost, non-invasive interventions (e.g., proper sleep, nutrition, exercise, coping, and stress management).. For patients identified as likely to have ongoing PTH (i.e., are aged over 29 years, students; reported severe headache, symptoms in arms or hands, dizziness or unsteadiness, stiffness in neck, moderate/severe pre-existing headache, and uncertain or poor recovery expectations at the intial interview), clinicians may monitor them more closely and deliver self-management strategies more intensely. Furthermore, given that persons injured in traffic collisions may have injuries and symptoms beyond the head and neck that may impact PTH outcomes, [Cassidy et al., 2014a; Bohman et al., 2012; Ritchie et al., 2013] offering evidence-based care for neck and back pain, for instance, may help to improve outcomes for patients with PTH [Stulemeijer et al., 2008; Côté et al., 2016]. Thus clinicians should move beyond a focussed headache assessment even for those who primarily report headache after a traffic collision. There may be disadvantages for patients who report ongoing PTH but were not classified as such. For example, they may experience feelings of discouragement or distress, and for those who were not self-manageing as well as they might have, more direct monitoring and education by clinicians might have been helpful. This may be mitigated by recommending to patients at their initial visit to contact their healthcare provider if their symptoms are not improving after the acute period (e.g., 4–6 weeks).
Our model can assist researchers to rule in the presence of PTH six months after a traffic collision in adults with incident PTH. Researchers may use our equation to identify participants with a high probability of ongoing PTH, and assess candidate inteventions in randomized controlled trials targeted for these individuals. Candidate interventions may include multimodal interventions that target psychosocial barriers to recovery such as recovery expectations, lifestyle and behavioural factors, pain, as well as factors related to activity and participation limitations.
Finally, our prediction model may offer a more clinically useful way of classifying PTH rather than the ICHD-3 definition, Headache Classification Committee of the International Headache Society, 2013 for which there is no high-quality supporting evidence of its clinical utility. Classification might be better served if it was based on prognostic information, rather than an unknown pathophysiology. Clinicians should focus on improving outcomes for patients by integrating prognostic information that might affect patient outcomes [Wong et al., 2017].
Conclusion
Post-traumatic headache is common and often persists beyond the acute period. Our model is useful in helping clinicians predict PTH six months after a traffic collision in primary care populations. The main priority for future research is to assess candidate interventions for people that are at high risk of PTH at six months. This work also suggests the potential usefulness of a prognostic approach to classifying PTH beyond the ICHD-3 Headache Classification Committee of the International Headache Society, 2013.
Acknowledgements
CC was funded by a Canadian Institutes of Health Research Doctoral Award (2013–2015). CC completed the first draft, all analyses, results and interpretation. EB, PC, LWH, LRS, and JDC contributed to all analyses, results and interpretation. JDC
Declaration of Competing Interest
The authors declare that there are no conflicts of interest.
References:
American Psychiatric Association, 2000.
Diagnostic and Statistical Manual of Mental Disorders (DSM-IV-TR), 4th ed.
APA, Washington, DC.Andersen, T.E., Karstoft, K.I., Brink, O., Elklit, A., 2016.
Pain-catastrophizing and fearavoidance beliefs as mediators between post-traumatic stress symptoms
and pain following whiplash injury - a prospective cohort study.
Eur. J. Pain 20 (8), 1241–1252.Bandura, A., 2004.
Health promotion by social cognitive means.
Health Educ. Behav. 31 (2), 143–164.Bohman, T., Côté, P., Boyle, E., Cassidy, J.D., Carroll, L.J., Skillgate, E., 2012.
Prognosis of patients with whiplash-associated disorders consulting physiotherapy:
development of a predictive model for recovery.
BMC Musculoskelet. Disord. 13, 264.Bolton, J.E., 1999.
Accuracy of recall of usual pain intensity in back pain patients.
Pain 83 (3), 533–539.Buse, D.C., Loder, E.W., Gorman, J.A., et al., 2013.
Sex differences in the prevalence, symptoms, and associated features of migraine, probable migraine
and other severe headache: results of the American Migraine Prevalence and Prevention (AMPP) Study.
Headache 53 (8), 1278–1299.Carroll, L.J., Cassidy, J.D., Peloso, P.M., et al., 2004.
Prognosis for mild traumatic brain injury: results of the WHO Collaborating Centre Task Force on
mild traumatic brain injury.
J. Rehabil. Med. (43 Suppl), 84–105.Carroll, L.J., Holm, L.W., Hogg-Johnson, S., et al., 2009a.
Course and Prognostic Factors for Neck Pain in Whiplash-associated Disorders (WAD):
Results of the Bone and Joint Decade 2000-2010 Task Force on
Neck Pain and Its Associated Disorders
Spine (Phila Pa 1976). 2008 (Feb 15); 33 (4 Suppl): S83–92Carroll, L.J., Holm, L.W., Ferrari, R., Ozegovic, D., Cassidy, J.D., 2009b.
Recovery in whiplash-associated disorders: do you get what you expect?
J. Rheumatol. 36 (5), 1063–1070.Cassidy, J.D., Carroll, L.J., Côté, P., Lemstra, M., Berglund, A., Nygren, A., 2000.
Effect of eliminating compensation for pain and suffering on the outcome of insurance claims for whiplash injury.
N. Engl. J. Med. 342 (16), 1179–1186.Cassidy, J.D., Carroll, L.J., Peloso, P.M., et al., 2004.
Incidence, risk factors and prevention of mild traumatic brain injury: results of the WHO
collaborating centre task force on mild traumatic brain injury.
J. Rehabil. Med. (43 Suppl), 28–60.Cassidy, J.D., Carroll, L.J., Côté, P., Frank, J., 2007.
Does multidisciplinary rehabilitation benefit whiplash recovery?: results of a population-based incidence cohort study.
Spine (Phila Pa 1976) 32 (1), 126–131.Cassidy, J.D., Boyle, E., Carroll, L.J., 2014a.
Population-based, Inception Cohort Study of the Incidence, Course, and Prognosis of
Mild Traumatic Brain Injury After Motor Vehicle Collisions
Arch Phys Med Rehabil. 2014 (Mar); 95 (3 Suppl): S278–285Cassidy, J.D., Cancelliere, C., Carroll, L.J., et al., 2014b.
Systematic Review of Self-Reported Prognosis in Adults After Mild Traumatic Brain Injury:
Results of the International Collaboration on Mild Traumatic Brain Injury Prognosis
Arch Phys Med Rehabil. 2014 (Mar); 95 (3 Suppl): S132–151Côté, P., Boyle, E., Shearer, H.M., et al., 2019.
Is a government-regulated rehabilitation guideline more effective than general practitioner education
or preferred-provider rehabilitation in promoting recovery from acute whiplash-associated disorders?
A pragmatic randomised controlled trial.
BMJ Open 9 (1), e021283.Côté, P., Hogg-Johnson, S., Cassidy, J.D., Carroll, L., Frank, J.W., Bombardier, C., 2007.
Early aggressive care and delayed recovery from whiplash: isolated finding or
reproducible result?
Arthritis Rheum. 57 (5), 861–868.Côté, P., Shearer, H., Ameis, A., et al., 2015.
Enabling Recovery From Common Traffic Injuries: A Focus on the Injured Person.
Financial Services Commission of Ontario
https://www.fsco.gov.on.ca/en/auto/Documents/2015-cti.pdf
Accessed April 30, 2017.Côté, P., Wong, J.J., Sutton, D., et al., 2016.
Management of Neck Pain and Associated Disorders: A Clinical Practice Guideline
from the Ontario Protocol for Traffic Injury Management (OPTIMa) Collaboration
European Spine Journal 2016 (Jul); 25 (7): 2000–2022Crutebo, S., Nilsson, C., Skillgate, E., Holm, L.W., 2010.
The course of symptoms for whiplash-associated disorders in Sweden: 6-month followup study.
J. Rheumatol. 37 (7), 1527–1533.Devins, G.M., Orme, C.M., Costello, C.G., et al., 1988.
Measuring depressive symptoms in illness populations: psychometric properties of the Center for
Epidemiologic Studies Depression (CES-D) scale.
Psychological Health. 2, 139–156.Fejer, R., Jordan, A., Hartvigsen, J., 2005.
Categorising the severity of neck pain:
establishment of cut-points for use in clinical and epidemiological research.
Pain 119 (1–3), 176–182.Ferrari, R., Russell, A.S., Carroll, L.J., Cassidy, J.D., 2005.
A re-examination of the whiplash associated disorders (WAD) as a systemic illness.
Ann. Rheum. Dis. 64 (9), 1337–1342.Grembowski, D., Patrick, D., Diehr, P., et al., 1993.
Self-efficacy and health behavior among older adults.
J. Health Soc. Behav. 34 (2), 89–104.Guskiewicz, K.M., McCrea, M., Marshall, S.W., et al., 2003.
Cumulative effects associated with recurrent concussion in collegiate football players:
the NCAA Concussion Study. JAMA 290 (19), 2549–2555.Harrell Jr., F.E., Lee, K.L., Mark, D.B., 1996.
Multivariable prognostic models: issues in developing models, evaluating assumptions and adequacy,
and measuring and reducing errors.
Stat. Med. 15 (4), 361–387. Hartling, L., Pickett, W., Brison, R.J., 2002.
Derivation of a clinical decision rule for whiplash associated disorders among individuals
involved in rear-end collisions.
Accid. Anal. Prev. 34 (4), 531–539.Hassani-Mahmooei, B., Berecki-Gisolf, J., Hahn, Y., McClure, R.J., 2016.
The effect of preexisting health conditions on the cost of recovery from road traffic injury:
insights from data linkage of medicare and compensable injury claims in Victoria, Australia.
BMC Health Serv. Res. 16, 162.Headache Classification Committee of the International Headache Society, 2013.
The international classification of headache disorders, 3rd edition (beta version).
Cephalalgia 33 (9), 629–808.Hincapie, C.A., Cassidy, J.D., Côté, P., Carroll, L.J., Guzman, J., 2010.
Whiplash injury is more than neck pain: a population-based study of pain localization after traffic injury.
J. Occup. Environ. Med. 52 (4), 434–440.Holm, L.W., Carroll, L.J., Cassidy, J.D., Skillgate, E., Ahlbom, A., 2008a.
Expectations for Recovery Important in the Prognosis of Whiplash Injuries
PLoS Med. 2008 (May 13); 5 (5): e105Holm, L.W., Carroll, L.J., Cassidy, J.D., et al., 2008b.
The Burden and Determinants of Neck Pain in Whiplash-associated Disorders after Traffic Collisions:
Results of the Bone and Joint Decade 2000–2010 Task Force on Neck Pain and Its Associated Disorders
Spine (Phila Pa 1976). 2008 (Feb 15); 33 (4 Suppl): S52-59Hosmer Jr, D.W., Lemeshow, S., 2004.
Applied Logistic Regression.
John Wiley & Sons, New York.Jensen, M.P., Karoly, P., Braver, S., 1986.
The measurement of clinical pain intensity: a comparison of six methods.
Pain 27 (1), 117–126.Jensen, M.P., Smith, D.G., Ehde, D.M., Robinsin, L.R., 2001.
Pain site and the effects of amputation pain:
further clarification of the meaning of mild, moderate, and severe pain.
Pain 91 (3), 317–322.Johansson, M.S., Boyle, E., Hartvigsen, J., Jensen Stochkendahl, M., Carroll, L., 2015.
A population-based, incidence cohort study of mid-back pain after traffic collisions:
factors associated with global recovery.
Eur. J. Pain 19 (10), 1486–1495.Keefe, F.J., Salley Jr., A.N., Lefebvre, J.C., 1992.
Coping with pain: conceptual concerns and future directions.
Pain 51 (2), 131–134.Khaw, K.T., Wareham, N., Bingham, S., Welch, A., Luben, R., Day, N., 2008.
Combined impact of health behaviours and mortality in men and women:
the EPIC-Norfolk prospective population study.
PLoS Med. 5 (1), e12.Kraft, P., Wacholder, S., Cornelis, M.C., et al., 2009.
Beyond odds ratios–communicating disease risk based on genetic profiles.
Nat. Rev. Genet. 10 (4), 264–269.Krebs, E.E., Carey, T.S., Weinberger, M., 2007.
Accuracy of the pain numeric rating scale as a screening test in primary care.
J. Gen. Intern. Med. 22 (10), 1453–1458.Kuhn, M., Campillos, M., Letunic, I., Jensen, L.J., Bork, P., 2010.
A side effect resource to capture phenotypic effects of drugs.
Mol. Syst. Biol. 6, 343.Lantz, P.M., Lynch, J.W., House, J.S., et al., 2001.
Socioeconomic disparities in health change in a longitudinal study of US adults:
the role of health-risk behaviors.
Soc. Sci. Med. 53 (1), 29–40.Leonardi, M., Steiner, T.J., Scher, A.T., Lipton, R.B., 2005.
The global burden of migraine: measuring disability in headache disorders with
WHO’s Classification of Functioning, Disability and Health (ICF).
J. Headache Pain 6 (6), 429–440.Leung, L., 2012.
Pain catastrophizing: an updated review.
Indian J. Psychol. Med. 34 (3), 204–217.Lucas, S., Hoffman, J.M., Bell, K.R., Dikmen, S., 2014.
A prospective study of prevalence and characterization of headache following
mild traumatic brain injury.
Cephalalgia 34 (2), 93–102.Mann, M., Hosman, C.M., Schaalma, H.P., de Vries, N.K., 2004.
Self-esteem in a broadspectrum approach for mental health promotion.
Health Educ. Res. 19 (4), 357–372.Marshall, S., Bayley, M., McCullagh, S., Velikonja, D., Berrigan, L., 2012.
Clinical practice guidelines for mild traumatic brain injury and persistent symptoms.
Can. Fam. Phys. 58 (3), 257–267 e128-240.Marshall, S., Bayley, M., McCullagh, S., et al., 2015.
Updated clinical practice guidelines for concussion/mild traumatic brain injury and persistent symptoms.
Brain Inj. 29 (6), 688–700.McLean, S.A., Ulirsch, J.C., Slade, G.D., et al., 2014.
Incidence and predictors of neck and widespread pain after motor vehicle collision among
US litigants and nonlitigants.
Pain 155 (2), 309–321.Moons, K.G., Kengne, A.P., Woodward, M., et al., 2012.
Risk prediction models: I. Development, internal validation, and assessing the incremental value
of a new (bio) marker.
Heart 98 (9), 683–690.Moons, K.G., Altman, D.G., Reitsma, J.B., et al., 2015.
Transparent Reporting of a multivariable prediction model for Individual Prognosis or Diagnosis (TRIPOD):
explanation and elaboration.
Ann. Intern. Med. 162 (1), W1–73.Nash, J.M., Thebarge, R.W., 2006.
Understanding psychological stress, its biological processes, and impact on primary headache.
Headache 46 (9), 1377–1386.Nederhand, M.J., Ijzerman, M.J., Hermens, H.J., Turk, D.C., Zilvold, G., 2004.
Predictive value of fear avoidance in developing chronic neck pain disability:
consequences for clinical decision making.
Arch. Phys. Med. Rehabil. 85 (3), 496–501.Partheni, M., Constantoyannis, C., Ferrari, R., Nikiforidis, G., Voulgaris, S., 2000.
A prospective cohort study of the outcome of acute whiplash injury in Greece.
Clin. Exp. Rheumatol. 18 (1), 67–70.Penley, J.A., Tomaka, J., Wiebe, J.S., 2002.
The association of coping to physical and psychological health outcomes: a meta-analytic review.
J. Behav. Med. 25 (6), 551–603.Ritchie, C., Hendrikz, J., Kenardy, J., Sterling, M., 2013.
Derivation of a clinical prediction rule to identify both chronic moderate/severe disability
and full recovery following whiplash injury.
Pain 154 (10), 2198–2206.Royston, P., Moons, K.G., Altman, D.G., Vergouwe, Y., 2009.
Prognosis and prognostic research: developing a prognostic model.
BMJ 338, b604.Russo, A., D’Onofrio, F., Conte, F., Petretta, V., Tedeschi, G., Tessitore, A., 2014.
Posttraumatic headaches: a clinical overview.
Neurol. Sci. 35 (Suppl 1), 153–156.Saskatchewan Government, 2020.
https://www.saskatchewan.ca/government/government-data/bureau-of-statistics/population-and-census
Accessed June 15, 2018.Sawyer, K., Bell, K.R., Ehde, D.M., et al., 2015.
Longitudinal study of headache trajectories in the year after mild traumatic brain injury:
relation to posttraumatic stress disorder symptoms.
Arch. Phys. Med. Rehabil. 96 (11), 2000–2006.Schelp, L., Ekman, R., 1990.
Road traffic accidents in a Swedish municipality.
Public Health 104 (1), 55–64.Scholten-Peeters, G.G., Verhagen, A.P., Bekkering, G.E., et al., 2003.
Prognostic factors of whiplash-associated disorders: a systematic review of prospective cohort studies.
Pain 104 (1–2), 303–322.Scopaz, K.A., Hatzenbuehler, J.R., 2013.
Risk modifiers for concussion and prolonged recovery.
Sports Health 5 (6), 537–541.Seeman, T.E., Crimmins, E., 2001.
Social environment effects on health and aging: integrating epidemiologic and demographic
approaches and perspectives.
Ann. N. Y. Acad. Sci. 954, 88–117.Statistics Sweden,
http://www.scb.se/en/finding-statistics/statistics-by-subject-area/population/population-composition/
population-statistics/pong/tables-and-graphs/yearly-statistics–the-whole-country/
summary-of-population-statistics/
Accessed June 15, 2018.Sterling, M., Jull, G., Vicenzino, B., Kenardy, J., Darnell, R., 2005.
Physical and psychological factors predict outcome following whiplash injury.
Pain 114 (1–2), 141–148.Steyerberg, E.W., 2009.
Clinical Prediction Models. A Practical Approach to Development, Validation, and Updating.
Springer-Verlag, New York. LI>Steyerberg, E.W., Vergouwe, Y., 2014.
Towards better clinical prediction models: seven steps for development and an ABCD for validation.
Eur. Heart J. 35 (29), 1925–1931.Steyerberg, E.W., Vickers, A.J., Cook, N.R., et al., 2010.
Assessing the performance of prediction models: a framework for traditional and novel measures.
Epidemiology 21 (1), 128–138.Stulemeijer, M., van der Werf, S., Borm, G.F., Vos, P.E., 2008.
Early prediction of favourable recovery 6 months after mild traumatic brain injury.
J. Neurol. Neurosurg. Psychiatry 79 (8), 936–942.Sullivan, M.J., Adams, H., Martel, M.O., Scott, W., Wideman, T., 2011.
Catastrophizing and perceived injustice: risk factors for the transition to chronicity after whiplash injury.
Spine (Phila Pa 1976) 36 (25 Suppl), S244–249.Varatharajan, S., Ferguson, B., Chrobak, K., et al., 2016.
Are non-invasive interventions effective for the management of headaches associated with neck pain?
An update of the bone and joint decade task force on neck pain and its associated disorders
by the Ontario Protocol for Traffic Injury Management (OPTIMa) collaboration.
European Spine Journal, 25(7), 1971–1999Walton, D.M., Macdermid, J.C., Giorgianni, A.A., Mascarenhas, J.C., West, 2013.
Risk factors for persistent problems following acute whiplash injury:
update of a systematic review and meta-analysis. J. Orthop.
Sports Phys. Ther. 43 (2), 31–43.Watanabe, T.K., Bell, K.R., Walker, W.C., Schomer, K., 2012.
Systematic review of interventions for post-traumatic headache.
PM R 4 (2), 129–140.Watson, M., Homewood, J., Haviland, J., Bliss, J.M., 2005.
Influence of psychological response on breast cancer survival: 10-year follow-up of a population-based cohort.
Eur. J. Cancer 41 (12), 1710–1714.Williams, M., Williamson, E., Gates, S., Lamb, S., Cooke, M., 2007.
A systematic literature review of physical prognostic factors for the development of Late Whiplash Syndrome.
Spine (Phila Pa 1976) 32 (25), E764–780.Williamson, E., Williams, M., Gates, S., Lamb, S.E., 2008.
A systematic literature review of psychological factors and the development of late whiplash syndrome.
Pain 135 (1–2), 20–30.Wong, J.J., Côté, P., Sutton, D.A., et al., 2017.
Clinical Practice Guidelines for the Noninvasive Management of Low Back Pain:
A Systematic Review by the Ontario Protocol for Traffic Injury Management
(OPTIMa) Collaboration
European J Pain 2017 (Feb); 21 (2): 201–216World Health Organization, 1992.
International Statistical Classification of Diseases and Related Health Problems, 10th ed.
World Health Organization, Geneva, Switzerland.Zajacova, A., Dowd, J.B., 2011.
Reliability of self-rated health in US adults.
Am. J. Epidemiol. 174 (8), 977–983.Zelman, D.C., Hoffman, D.L., Seifeldin, R., Dukes, E.M., 2003.
Development of a metric for a day of manageable pain control:
derivation of pain severity cut-points for low back pain and osteoarthritis.
Pain 106 (1–2), 35–42.
Return to HEADACHE
Since 5-25-2020
| Home Page | Visit Our Sponsors | Become a Sponsor |
Please read our DISCLAIMER |