

Characterizing the Course of Low Back Pain:
A Latent Class AnalysisThis section is compiled by Frank M. Painter, D.C.
Send all comments or additions to: Frankp@chiro.org


FROM: American J Epidemiology 2006 (Apr 15); 163 (8): 754–761 ~ FULL TEXT
OPEN ACCESS Kate M. Dunn, Kelvin Jordan, Peter R. Croft
Primary Care Sciences Research Centre,
Keele University,
Keele, United Kingdom.
k.m.dunn@cphc.keele.ac.uk
Understanding the course of back pain is important for clinicians and researchers, but analyses of longitudinal data from multiple time points are lacking. A prospective cohort study of consecutive back pain consulters from five general practices in the United Kingdom was carried out between 2001 and 2003 to identify groups defined by their pain pathways. Patients were sent monthly questionnaires for a year. Longitudinal latent class analysis was performed by using pain intensity scores for 342 consulters. Analysis yielded four clusters representing different pathways of back pain. Cluster 1 ("persistent mild"; n = 122) patients had stable, low levels of pain. Patients in cluster 2 ("recovering"; n = 104) started with mild pain, progressing quickly to no pain. Cluster 3 ("severe chronic"; n = 71) patients had permanently high pain. For patients in cluster 4 ("fluctuating"; n = 45), pain varied between mild and high levels. Distinctive patterns for each cluster were maintained throughout follow-up. Clusters showed statistically significant differences in disability, psychological status, and work absence (p < 0.001). This is the first time, to the authors' knowledge, that latent class analysis has been applied to longitudinal data on back pain patients. Identification of four distinct groups of patients improves understanding of the course of back pain and may provide a basis of classification for intervention.
From the FULL TEXT Article:
INTRODUCTION
Understanding the course of low back pain is important for clinicians and researchers because it provides information on the need for, and potential benefits of, treatment. [1, 2] It also helps patients learn what to expect in terms of symptoms, the impact of the problem on their life, and the interventions they may receive. Information on symptom course may enable patients with nonspecific low back pain to be classified into clinically meaningful subgroups. There are currently no accepted methods for classifying these patients, who constitute 85–95 percent of those seeking care for low back pain. [3] Thus, it is difficult to select clearly defined subgroups of patients for clinical trials, and the potential effectiveness of treatments may be masked by the heterogeneity of the patients studied.
It has been suggested that long-term pain conditions, such as low back pain, follow recurrent or fluctuating patterns [4, 5], and hypothetical time courses for these conditions have been proposed. [6] However, because of, in part, the difficulties in measuring such symptoms and the repeated measurements necessary [6], there is little empirical evidence to support these models. Previous study of the course of low back pain has tended to provide data on only the proportion of persons who have recovered or are still experiencing symptoms at various time points. [2, 4] The majority of longitudinal studies of low back pain are not designed to characterize symptom course but to collect information at baseline, which is then used to predict an outcome at later time points, commonly 3, 6, or 12 months. [7-10] A few studies have gathered more detailed information over shorter time periods [11, 12], but studies collecting detailed measurements over a longer period of time are lacking. Such studies using repeated measurements are necessary to characterize the course of symptoms over time and to group patients with similar symptom pathways.
The aim of this study was to identify and describe groups of primary care low back pain patients defined by their patterns of change in or stability of pain over time. There were two main objectives:1) to establish, using longitudinal latent class analysis, whether there were distinct groups
of patients with different pathways of back pain in the 6 months following primary
care consultation; and
2) to determine whether membership in the groups was associated with other characteristics at
the initial time of consultation or with subsequent outcome 12 months after consultation.
MATERIALS AND METHODS
Participants
The analyses presented here are based on data for 342 primary care low back pain consulters who returned a baseline questionnaire, consented to follow-up, and completed at least four monthly questionnaires during the 6 months following baseline. The original sample consisted of 1,464 consecutive back pain consulters aged 30–59 years from five general practices in the United Kingdom. Patients were recruited during 2001 and 2002 and were followed up from 2001 to 2003. This study was approved by the Local Research Ethics Committee, and all patients received usual care.
All consulters were mailed a self-completion questionnaire within a week of consultation; 65 percent (n = 935) responded, and 83 percent (n = 776) of them gave written consent to be followed up using monthly questionnaires as part of the study. A total of 619 patients (80 percent) returned at least one questionnaire in the period up to the 6-month follow-up, 342 patients returned four or more questionnaires, and 188 patients returned and completed all six follow-up questionnaires.
Those consulters whose follow-up data were complete, and the 342 who returned four or more questionnaires, had similar characteristics and were representative of the total sample. Their levels of pain and disability were similar to those in the baseline responders who either did not consent to follow-up or returned fewer than four follow-up questionnaires.
Data collection
The baseline questionnaire collected information on demographic and work-related items including absence from work because of back pain. Pain intensity was derived from the mean of three 0–10 numeric rating scales for the least and usual back pain over the previous 2 weeks, and from current back pain intensity. Information was also collected on the presence or absence of leg pain during the previous 2 weeks. The Chronic Pain Grade [13] classified persons into one of five grades of chronic back pain, ranging from 0 (pain free) to IV (high disability, severely limiting).
Patients were asked about the bothersomeness of their back pain during the previous 2 weeks [14]; bothersome back pain was defined as a rating of “very much” or “extremely” bothersome. Low back pain duration was measured by patients recalling time since the last pain-free month, which is based on the definition of a low back pain episode proposed by de Vet et al.: “a period of pain in the lower back lasting for more than 24 hours, preceded and followed by a period of at least one month without low back pain” (15, p. 2413).
Disability was measured by using the modified 23-item Roland-Morris Disability Questionnaire (RMDQ) [16, 17]; high disability was defined as a score greater than 14 [18]. Psychological status was assessed by using the Hospital Anxiety and Depression Scale [19], and a probable case was defined for each dimension (anxiety and depression) as a score of 11 or more. [20] Catastrophizing was classified according to a single item modified from the catastrophizing subscale of the Coping Strategies Questionnaire. [21]
Statistical analysis
The monthly pain intensity scores were trichotomized into no pain (a score of less than 1), mild-moderate pain, and high pain (a score of 5 or more). This cutoff for high pain is supported by Von Korff et al. [13], who found that patients scoring less than the midpoint on a pain intensity scale were unlikely to have significant levels of disability. The pain trichotomy for months 1–6 (i.e., the first 6 months after the baseline measurement but not including the baseline measurement) was then used to characterize groups of subjects, using longitudinal latent class analysis, based on the trajectory of their back pain over these first 6 months. The baseline measurements were not included because of the likelihood of regression to mean pain levels for most patients in the weeks immediately following consultation. The monthly pain levels were treated as ordinal, with the levels equally spaced, in the latent class analysis.
The assumption behind latent class analysis is that there exists a certain number of distinct pathways of back pain, and subjects can be grouped into a small number of distinct clusters known as latent classes, based on their profile of back pain over the 6 months, with each subject belonging to one cluster. Latent class modeling aims to obtain the smallest number of clusters that accounts for all the associations between the variables, in this case, between the monthly pain levels. [22]
Thus, local independence exists within clusters because the probability of a certain level of pain for any month is independent of the level of pain for any other month. The posterior probability of belonging to each cluster can be obtained for each person, with subjects allocated to the cluster for which this probability is the largest. Cluster-specific probabilities of having each level of pain for each month, given membership in that cluster, allow profiles of the pathway of pain to be developed for subjects in each cluster.
Latent class models are fitted successively, starting with a one-cluster model (whereby it is assumed that all subjects have the same pathway of back pain) and then adding another cluster for each successive model. The optimal number of clusters can be determined in a variety of ways [23], and the methods used here are detailed in the Appendix.
Although subjects do not have to have complete data (i.e., data for all 6 months) to be included in a longitudinal latent class analysis, when subjects whose data are missing are included, goodness-of-fit tests to determine the optimal number of clusters should be treated with caution. [24] Therefore, the first analysis assessed the optimal solution for just those subjects whose data were complete. The analysis was then rerun by including the subjects with at least 4 months of data, enabling us to make the most use of the data but still restricting the analysis to those subjects with enough data to allow a pathway of back pain to be reasonably inferred.
Subjects were allocated to clusters based on the posterior probabilities of belonging to each cluster. These derived clusters were subsequently compared at baseline and 12 months with respect to other variables measured by using chi-squared tests.
Latent Gold 3.0.6 (24) and SPSS for Windows 12.0 (25) software programs were used to perform the analyses.
RESULTS
Results from the longitudinal latent class analysis suggested that the optimal number of clusters was either four or six (the derivation and justification for this decision are provided in the Appendix). In light of the smaller size of clusters in the six-cluster solution and the fact that the additional clusters could be considered subsets of two of the four clusters, the subsequent analysis concentrates on the four-cluster solution.
Characterization of clusters
The models including and excluding subjects whose data were missing gave the same cluster structures, and the two groups of subjects had similar levels of pain and disability at baseline (refer to the Materials and Methods section). Therefore, the additional analyses were performed by using data for the 342 subjects with at least four monthly pain intensity scores.

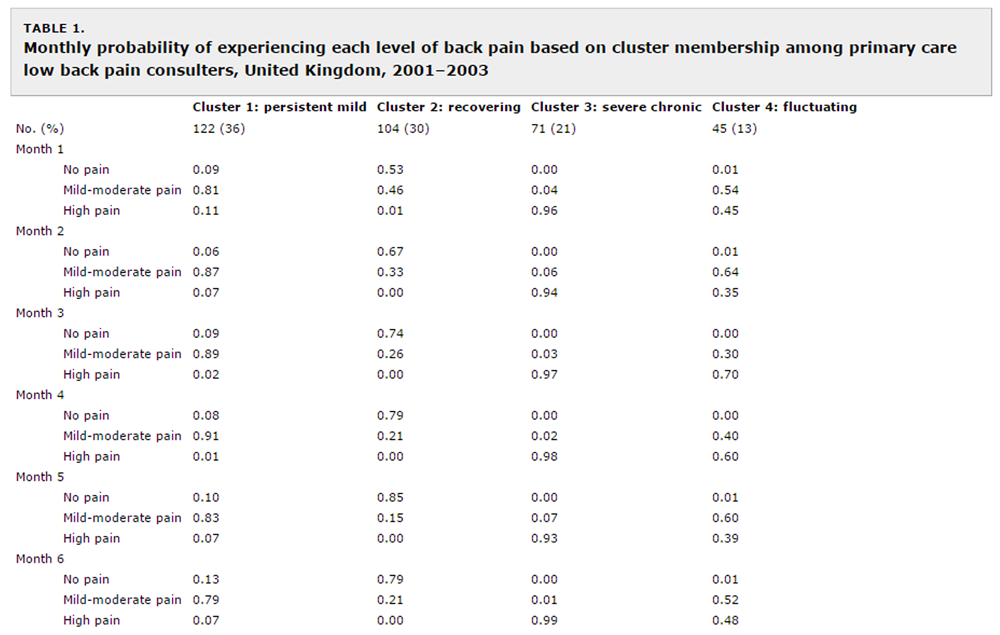
Table 1 Table 1 shows the probability of having each level of pain based on cluster. Cluster 1 was the most common (n = 122, 36 percent) and was characterized by “persistent mild” pain. For subjects in this cluster, the probability of mild-moderate pain intensity levels was 79 percent or more for all 6 months, and the majority of subjects had mild-moderate pain for at least 4 of the 6 months. Thirty percent of subjects (n = 104) were classified into cluster 2 and were identified as “recovering.” They reported having no back pain soon after baseline and, from month 3 on, continued to have at least a 74 percent probability of having no back pain. For at least 4 of the 6 months, this group had no pain and were very unlikely to have high pain levels. Cluster 3 (n = 71, 21 percent) represents a group who had continuous high pain levels and could be classified as “severe chronic” back pain sufferers. They had at least a 93 percent probability of high pain levels each month; they usually had at least 5 months with such pain and never reported having no back pain. The final group of patients (cluster 4; n = 45, 13 percent) oscillated between mild-moderate and high pain, and they represented a “fluctuating” group. This group was very unlikely to report having no back pain at any time during the 6-month period. The six-cluster model suggested that the recovering group could be split into those recovering in month 1 (n = 55) and those recovering after month 1 and that a small subgroup (n = 14) of the fluctuating group progressed from mild-moderate to high pain during the 6 months.
Course of pain and disability
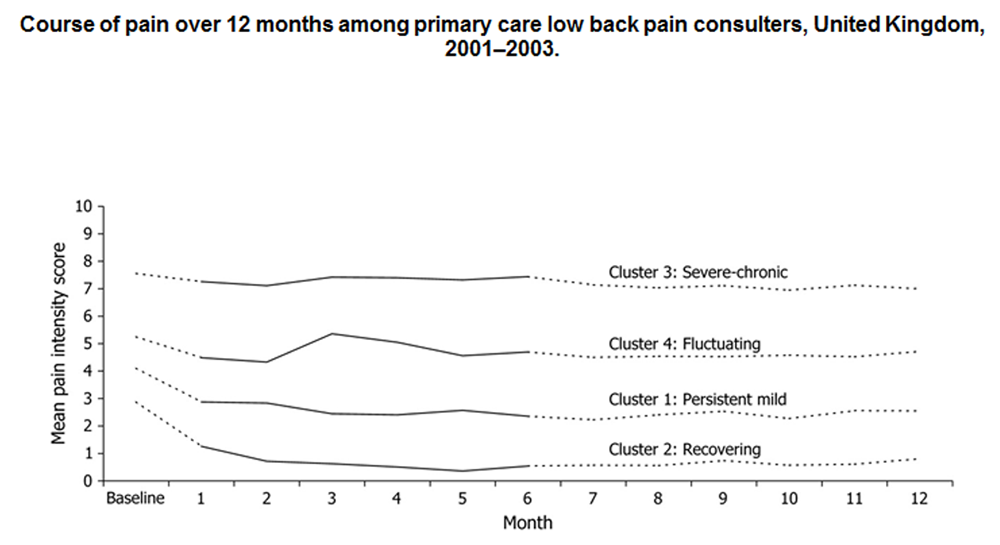
Figure 1 Figure 1 highlights the distinctive pain pathways (measured by mean back pain intensity score) over the 6 months used for classification (solid lines) and the subsequent pathways for months 7–12 (dashed lines). As shown, all four clusters displayed a reduction in mean pain intensity from baseline to month 1, with the recovering cluster improving the most (mean difference, 1.7; 95 percent confidence interval: 1.2, 2.2) and the severe chronic cluster improving the least (mean difference, 0.3; 95 percent confidence interval: –0.02, 0.7). Relatively stable mean pain levels followed this initial improvement throughout follow-up.
Table 2
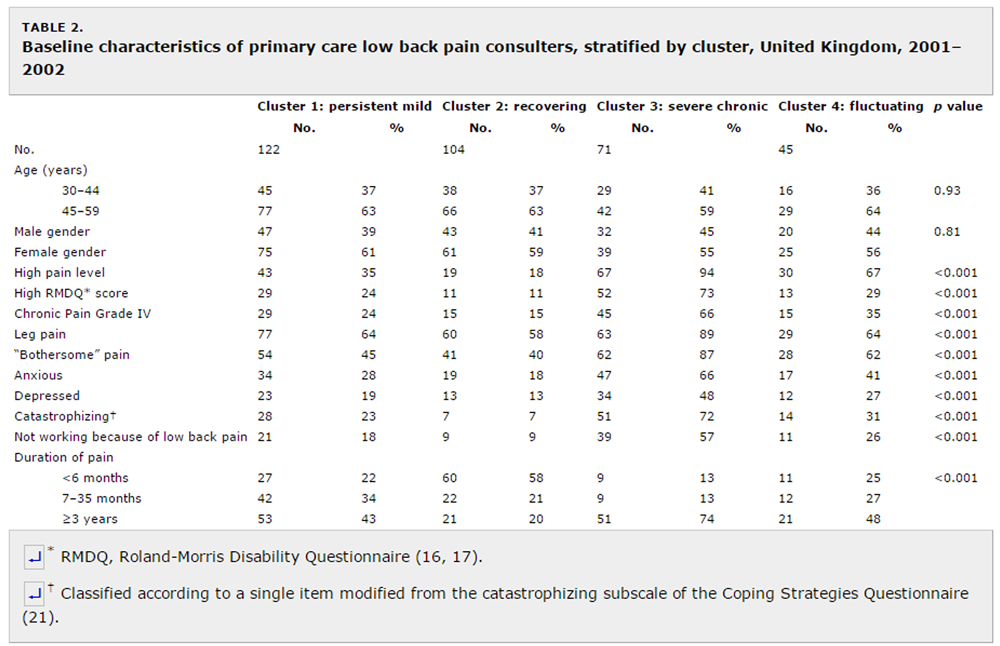
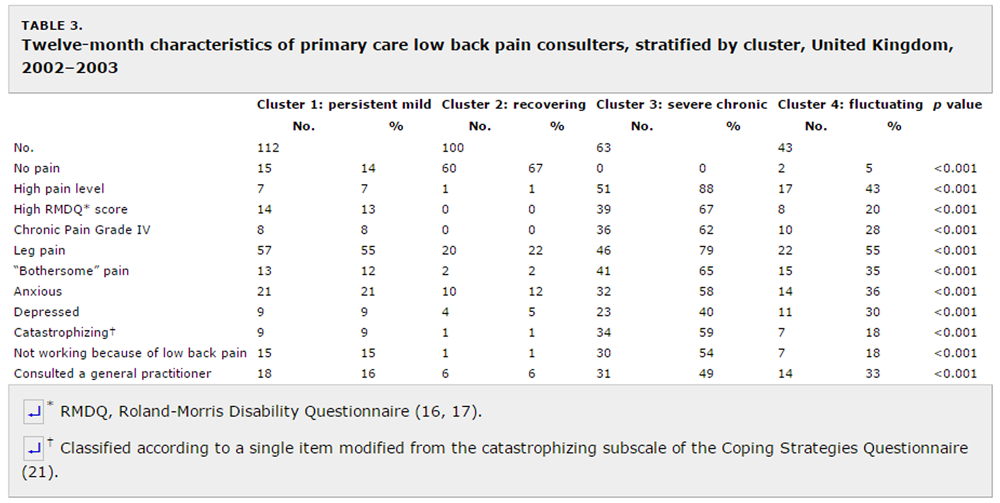
Table 3 The time course of disability for subjects in each cluster was examined in a comparable way by using RMDQ scores. The observed patterns were similar to those found for pain intensity. Subjects in the persistent mild pain intensity group had low to moderate disability, with monthly mean RMDQ scores of about 6 during follow-up. Subjects classified as recovering in terms of their pain intensity also had consistently low disability levels, with monthly mean RMDQ scores of less than 2. The severe chronic group had high disability levels, with mean RMDQ scores above 14 for all 12 months. The fluctuating group had moderate disability levels; their monthly mean RMDQ scores ranged from 8 to 11. Additional characteristics of cluster members The clusters did not vary by age or gender. However, there were significant differences between the groups regarding all the other variables at baseline (table 2, all p < 0.001) and at 12 months (table 3, all p < 0.001).
Cluster 1: Persistent mild.
This group of patients with relatively stable, low levels of pain improved substantially in terms of the other variables, both physical and psychological, throughout the year. For example, the proportion of subjects in this group experiencing high disability levels fell from 24 percent at baseline to 13 percent 12 months later, and the proportion categorized as Chronic Pain Grade IV fell from 24 percent to 8 percent. The improvement in psychological status was particularly marked for depression, with a reduction from 19 percent classified as probable depression cases at baseline to 9 percent a year later. However, the proportion of subjects absent from work because of their low back pain was similar at baseline (18 percent) and at 12 months (15 percent).
Cluster 2: Recovering.
Patients in cluster 2 had mild-moderate pain improving to no pain, and their health status at baseline was generally good and was maintained or improved at follow-up. Only 11 percent of these patients had high levels of disability, and 15 percent were categorized as Chronic Pain Grade IV sufferers at baseline; none had high disability levels or experienced Chronic Pain Grade IV 1 year later. Duration of symptoms at consultation was less than 6 months for the majority (58 percent) of this group. Few patients (9 percent) were absent from work because of their low back pain at baseline, and only one person was off work a year later. The general psychological status of this group was good at baseline and improved further during the year.
Cluster 3: Severe chronic.
These patients had consistently high levels of pain and disability. Three quarters had high RMDQ scores at baseline, with only a slight reduction 1 year later. The majority (74 percent) had had back pain for over 3 years. Work absence was high, with more than half the group off work both at baseline and 12 months later because of their low back pain. Their overall psychological status was also poor; 66 percent were anxious and 48 percent were depressed at baseline, with little change at follow-up. At 12 months, almost half were still consulting their general practitioner for their back pain.
Cluster 4: Fluctuating.
For these patients whose pain intensity varied between mild-moderate and high, there was a small improvement in disability from 29 percent with high RMDQ scores at baseline to 20 percent at 12 months. However, their psychological status did not improve, with the proportion classified as depressed remaining constant (27–30 percent). Almost half had experienced pain for over 3 years, and a third were still consulting their general practitioner about back pain at the 12-month follow-up.
DISCUSSION
We classified back pain patients into distinct groups by using statistical analysis of detailed data on the course of their pain over time. To our knowledge, this is the first time that this has been done. Latent class analysis was applied to longitudinal data on low back pain patients, and four distinct pathways in the course of pain intensity were identified. Further examination of these groups established that they also differed regarding other important variables such as disability, psychological status, and work absence. Change in status throughout the study year regarding these other variables was also linked to cluster membership. Classification of back pain in primary care has been highlighted as important for the management of these patients; our findings may therefore have valuable implications for intervention and research into back pain in primary care settings.
We know of no study that has attempted to characterize the course of low back pain by using repeated measurements on a large sample of patients. Previous longitudinal studies have collected data at two or three time points [7–10], which were used mainly to provide information on individual prognostic indicators at each of those time points. Our results are in line with these findings, in that we confirmed that the group with the highest pain, disability, and psychological distress levels at baseline also had the poorest chance of recovery. However, we also added detail to this finding, and, rather than simply dichotomizing the sample as recovered or not, we confirmed that there were four clusters with distinctive pain pathways and characteristics that could be identified during a 6-month period, and whose distinguishing attributes were maintained throughout the subsequent 6 months.
Long-term mild back pain has previously been reported to have little impact on disability or psychological status. [26] This finding seemed to be confirmed by the persistent mild group, although our data showed that a significant minority of this group were absent from work. Elliott et al. [27] used the Chronic Pain Grade to assess changes among people with chronic pain in the community and showed that people tended to retain the same Chronic Pain Grade over time. We found that most people in the severe chronic cluster (69 percent) did not change grade. However, in the two most common groups (persistent mild and recovering), most (61 percent and 66 percent, respectively) changed their Chronic Pain Grade during the study year. This finding reinforces the hypothesis that looking in more detail at subgroups can help uncover patterns of change over time that are not apparent in undifferentiated groups of people. It has implications for clinical trials, because researchers may want to induce changes in patients not likely to improve without an effective treatment (e.g., the severe chronic group) or to exclude patients likely to improve with usual care alone (e.g., the recovering group).
A number of previous longitudinal studies of low back pain have concentrated on patients with acute back pain. [8, 28–31] Such studies have shown high rates of recovery and have led to the belief that the majority of primary care low back pain patients recover. These patients are likely to be most similar to the “recovering” group in this study, who represented about a third of the total sample. There has been less research on patients with more chronic symptoms who constitute the majority of patients seen in primary care. Our study provided information about the likely course of symptoms among these more chronic patients and may be a useful comparison for studies in which patients have received specific interventions.
Figure 1 shows the average patterns over time among people categorized into each cluster, but such summaries can mask individual variability in back pain trajectories. [1] When the individual courses of pain were plotted, only small fluctuations around the mean levels were apparent. Furthermore, no one in the persistent mild or recovering groups developed high levels of pain during the 7–12-month period, even though their group status was based on their time course of pain during the first 6 months. This finding appears to conflict with those of Von Korff [1], who suggested that the course of back pain occurs in phases, with people experiencing transient, chronic, or recurrent pain at different times. Longer-term follow-up of these patients is necessary to determine whether their group status is maintained over a period longer than 1 year. It may transpire in the longer term that our identified groups do not represent completely separate groups of patients but are phases that many patients go through.
Another interesting finding was the similarity between trajectories of pain and disability. This finding appears to contrast with other research, which has shown little correlation between pain and disability. [5] When we examined this issue further, we found moderately strong correlations between pain and disability at baseline (Pearson's r = 0.71) and 12 months (r = 0.83) for the whole group, and correlations within the latent classes were moderate (r = 0.44–0.64 at baseline and r = 0.54–0.74 at 12 months). This finding indicates that, although agreement between the two constructs was not perfect, pain and disability appear to follow similar patterns.
The power of longitudinal latent class analysis to characterize longitudinal patterns has been shown with nighttime continence in children aged 4–15 years. [32] The model derived from longitudinal latent class analysis gave a slightly better fit to the data, and was more stable, than that derived from latent class growth analysis. This type of analysis has been used, for example, to characterize patterns over time of alcohol consumption in adults [33] and is an alternative method of assessing pathways of pain because it may be more parsimonious. [34] However, the relative stability of the pain in primary care consulters suggests that using latent class growth analysis to impose different trend structures on the clusters would not lead to a greatly different cluster solution. Pain profiles of individual subjects in each cluster derived from longitudinal latent class analysis matched that of the cluster as a whole, and the clusters themselves revealed distinct pathways of pain and related health status.
Subjects were allocated to the cluster for which they had the highest probability of membership. The lowest probability of belonging to the cluster to which the subject was allocated was 50 percent, and only 26 subjects had a probability of less than 70 percent. However, for 80 percent of subjects, the probability of belonging to their cluster was 90 percent or higher. There is no one preferred method of deciding on an optimal number of clusters, and these four pathways may not reflect the precise number of pathways of low back pain among primary care consulters. The six-cluster model suggests that the recovering and fluctuating groups could be further divided. Because the extra groups were small and not dissimilar to the existing groups, there was little benefit to be gained from assessing a six-cluster solution. Our findings suggest that the majority of subjects were clearly allocated to their cluster and closely followed the pathway of low back pain described by the cluster to which they belonged.
There may be some bias in baseline response to this study (the response rate was slightly higher among women and older people), but the pain and disability levels of the 342 subjects in the analysis were similar to those of the 593 persons who responded to the baseline questionnaire but had incomplete follow-up and were not included in this analysis. Loss to follow-up at 12 months was also minimal (7 percent) among the 342 subjects, and there was no evidence of bias in response to follow-up. Biases in response and consent could affect the proportions of persons in each cluster but are unlikely to impact the characteristics of the clusters. The majority of patients in this sample had experienced back pain for more than 6 months. However, patients lost from the sample during the study may have had less severe symptoms (e.g., those who had recovered before receiving the questionnaire may have been less likely to respond). Other studies suggest that the low back pain of most patients in primary care can be classified as chronic. [13, 35] In light of our findings, the use of an “umbrella term” of chronic does not seem appropriate, and our classification into four pathways of persistent mild, recovering, fluctuating, and severe chronic does provide a more detailed alternative. Although we defined specific subgroups and described their different pain pathways and distinctive characteristics, we did not specifically investigate predictors of group membership. Further work would be needed to elucidate the characteristics of patients and the timing of measurement that would enable accurate prediction of patients' likely pain pathways.
We identified four distinct groups of patients with different pathways in the course of back pain intensity and significant differences regarding a range of other important variables. This knowledge improves our understanding of the course of low back pain. Classification of primary care patients into these groups may help in the management of nonspecific low back pain and contribute to future trials of treatment.
APPENDIX
Technical Information
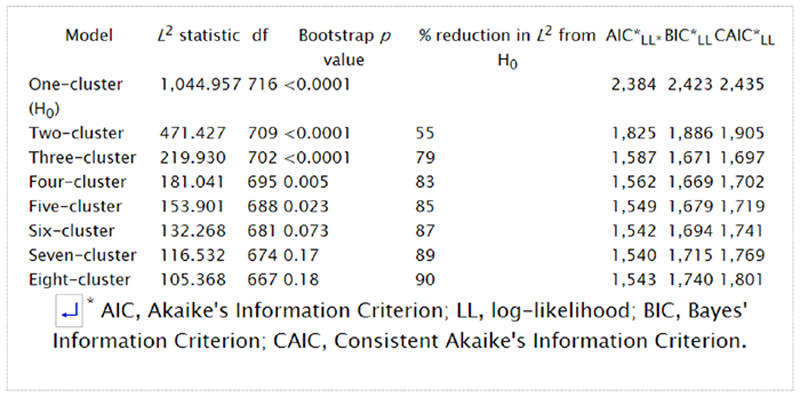
No definitive method of determining the optimal number of clusters in a latent class analysis exists. One of the most common is to examine the model fit likelihood ratio chi-squared statistic, L2: the amount of the relation between the monthly levels of pain that remains to be explained. The larger the value of L2, the worse the model fit, and a p value can be calculated to assess the goodness of fit. When data might be sparse—for example, when there are a large number of variables or categories compared with the number of observations—the chi-squared distribution should not be used to determine the p value, and bootstrap p values are recommended instead. [36] The optimal number of clusters is where the p value becomes nonsignificant at the desired significance level. Other methods that are particularly useful when data are sparse include information criterion statistics that take into account the parsimony of the model, such as Akaike's Information Criterion, Bayes' Information Criterion, and the Consistent Akaike's Information Criterion. [23] The optimal number of clusters occurs when the information criterion value is at its lowest. A more subjective method is to assess the percentage reduction in L2 from the model with one cluster and select the number of clusters from the model beyond which this reduction is considered minor. [23]
Latent Gold uses both the estimation-maximization and Newton-Raphson algorithms to estimate model parameters. [24] A problem that sometimes occurs in latent class analysis is that a local maximum, rather than the global best solution, is obtained. To avoid this situation, 1,000 repeated runs were performed from random start values. Bootstrap p values based on 500 replications were determined to assess the model fit based on the L2 statistic.
The goodness-of-fit statistics for the one-cluster to eight-cluster models are shown in appendix table 1. These statistics are based on the 188 subjects whose data were complete. Based on bootstrap p values for the model fit L2 statistics, the six-cluster model was the optimal assuming a 5 percent significance level. However, the percentage reduction in L2 from the one-cluster model (H0) suggests that little benefit is gained by expanding beyond a four-cluster model. There was an 83 percent reduction in L2 from the one-cluster model to the four-cluster model. The six-cluster model reduced L2 by only a further 4 percent. The information criterion values suggested a seven-cluster solution based on Akaike's Information Criterion, a four-cluster model based on Bayes' Information Criterion, and a three-cluster model based on the Consistent Akaike's Information Criterion.
APPENDIX TABLE 1. Goodness-of-fit statistics for cluster models of primary care
low back pain consulters (n = 188), United Kingdom, 2001–2003
Goodness-of-fit statistics in which data for all 342 subjects were used suggested a four-cluster solution (based on Bayes' Information Criterion, Consistent Akaike's Information Criterion, and percentage reduction in L2) or a six-cluster solution (bootstrap p value, Akaike's Information Criterion). On the basis of these results and the characteristics and size of the clusters, the four-cluster solution was selected as optimal.
Acknowledgements
This work was supported by a research grant from the Wellcome Trust and by the North Staffordshire and Cheshire General Practice Research Network.
Conflict of interest:
none declared.
References
Von Korff M.
Studying the natural history of back pain.
Spine 1994;19:2041S–6S.Hestbaek L, Leboeuf-Yde C, Manniche C.
Low Back Pain: What Is The Long-term Course?
A Review of Studies of General Patient Populations
European Spine Journal 2003 (Apr); 12 (2): 149–165Waddell G.
Subgroups within “nonspecific” low back pain.
J Rheumatol 2005;32:395–6.Von Korff M, Saunders KW.
The course of back pain in primary care.
Spine 1996;21:2833–7.Waddell G.
The back pain revolution.
Edinburgh, United Kingdom:
Churchill Livingstone, 1998Von Korff M, Jensen MP, Karoly P.
Assessing global pain severity by self-report in clinical and health services research.
Spine 2000;25:3140–51van den Hoogen HJ, Koes BW, van Eijk JT, et al.
On the course of low back pain in general practice: a one year follow up study.
Ann Rheum Dis 1998;57:13–19.Schiřttz-Christensen B, Nielsen GL, Hansen VK, et al.
Long-term prognosis of acute low back pain in patients seen in general practice: a 1-year prospective follow-up study.
Fam Pract 1999;16:223–32Thomas E, Silman AJ, Croft PR, et al.
Predicting who develops chronic low back pain in primary care: a prospective study.
BMJ 1999;318:1662–7Nyiendo J, Haas M, Goldberg B.
Pain, Disability, and Satisfaction Outcomes and Predictors of Outcomes:
A Practice-based Study hronic Low Back Pain Patients
Attending Primary Care and Chiropractic Physicians
J Manipulative Physiol Ther. 2001 (Sep); 24 (7): 433–439Carey TS, Garrett JM, Jackman AM.
Beyond the good prognosis. Examination of an inception cohort of patients with chronic low back pain.
Spine 2000;25:115–20Grotle M, Brox JI, Veierřd MB, et al.
Clinical course and prognostic factors in acute low back pain: patients seeking help for their first time.
Spine 2005;30:976–82Von Korff M, Ormel J, Keefe FJ, et al.
Grading the severity of chronic pain.
Pain 1992;50:133–49.Dunn KM. Croft PR.
Classification of Low Back Pain in Primary Care: Using "Bothersomeness"
to Identify the Most Severe Cases
Spine (Phila Pa 1976). 2005 (Aug 15); 30 (16): 1887–1892de Vet HC, Heymans MW, Dunn KM, et al.
Episodes of low back pain: a proposal for uniform definitions to be used in research.
Spine 2002;27:2409–16Roland M, Morris R.
A study of the natural history of back pain. Part I: development of a reliable and sensitive measure of disability in low-back pain.
Spine 1983;8:141Patrick DL, Deyo RA, Atlas SJ, et al.
Assessing health-related quality of life in patients with sciatica.
Spine 1995;20:1899–908Cherkin DC, Wheeler KJ, Barlow W, et al.
Medication use for low back pain in primary care.
Spine 1998;23:607–14.Zigmond AS, Snaith RP.
The Hospital Anxiety and Depression Scale.
Acta Psychiatr Scand 1983;67:361–70Greenough CG, Fraser RD.
Comparison of eight psychometric instruments in unselected patients with back pain.
Spine 1991;16:1068–7Rosenstiel AK, Keefe FJ.
The use of coping strategies in chronic low back pain patients: relationship to patient characteristics and current adjustment.
Pain 1983;17:33–44McCutcheon AL.
Latent class analysis.
Newbury Park, CA: Sage Publications, 1987.
(Sage university paper series on quantitative applications in the social sciences, no. 07-064)Magidson J, Vermunt JK.
Latent class models.
In: Kaplan D, ed. The Sage handbook of quantitative methodology for the social sciences.
Thousand Oaks, CA:
Sage Publications, 2004:175–Vermunt JK, Magidson J.
Latent Gold 3.0 user's guide.
Belmont, MA: Statistical Innovations Inc, 2003SPSS for Windows, release 12.0.0.
Chicago, IL: SPSS Inc, 2003Von Korff M, Deyo RA, Cherkin DC, et al.
Back pain in primary care. Outcomes at 1 year.
Spine 1993;18:855–62Elliott AM, Smith BH, Hannaford PC, et al.
The course of chronic pain in the community: results of a 4-year follow-up study.
Pain 2002;99:299–307Chavannes AW, Gubbels J, Post D, et al.
Acute low back pain: patients' perceptions of pain four weeks after initial diagnosis and treatment in general practice.
J R Coll Gen Pract 1986;36:271–3Coste J, Delecoeuillerie G, Cohen de Lara A, et al.
Clinical course and prognostic factors in acute low back pain: an inception cohort study in primary care practice.
BMJ 1994;308:577–8Klenerman L, Slade PD, Stanley IM, et al.
The prediction of chronicity in patients with an acute attack of low back pain in a general practice setting.
Spine 1995;20:478–84Carey TS, Garrett JM, Jackman AM, et al.
Recurrence and care seeking after acute back pain: results of a long-term follow-up study. North Carolina Back Pain Project.
Med Care 1999;37:157–Croudace TJ, Jarvelin MR, Wadsworth ME, et al.
Developmental typology of trajectories to nighttime bladder control: epidemiologic application of longitudinal latent class analysis.
Am J Epidemiol 2003;157:834–42Delucchi KL, Matzger H, Weisner C.
Dependent and problem drinking over 5 years: a latent class growth analysis.
Drug Alcohol Depend 2004;74:235–4Muthén B.
Latent variable analysis.
In: Kaplan D, ed. The Sage handbook of quantitative methodology for the social sciences.
Thousand Oaks, CA:
Sage Publications, 2004:345–68Pedersen PA.
Prognostic indicators of low back pain.
J R Coll Gen Pract 1981;31:209–16.Langeheine R, Pannekoek J, Van de Pol F.
Bootstrapping goodness-of-fit measures in categorical data analysis.
Sociol Methods Res 1996;24:492–516
Return to LOW BACK PAIN
Return to TRAJECTORIES OF LOW BACK PAIN
Since 9-06-2016
| Home Page | Visit Our Sponsors | Become a Sponsor |
Please read our DISCLAIMER |