

Use of Chiropractic Spinal Manipulation in Older Adults
is Strongly Correlated with SupplyThis section is compiled by Frank M. Painter, D.C.
Send all comments or additions to: Frankp@chiro.org


FROM: Spine (Phila Pa 1976). 2012 (Sep 15); 37 (20): 1771–1777 ~ FULL TEXT
OPEN ACCESS James M. Whedon, DC, Yunjie Song, PhD, Matthew A. Davis, DC, MPH, and Jonathan D Lurie, MD, MS
Dartmouth Institute for Health Policy & Clinical Practice,
Lebanon, NH 03756, USA.
james.m.whedon@dartmouth.edu
STUDY DESIGN: Retrospective cross-sectional analysis of administrative data.
OBJECTIVE: To examine the relationship between regional chiropractic supply and both use and utilization intensity of chiropractic services among Medicare beneficiaries.
SUMMARY OF BACKGROUND DATA: Numerous studies have documented trends and patterns in the utilization of chiropractic services in the United States, but little is known about geographic variation in the relationship between chiropractic supply and utilization.
METHODS: We analyzed Medicare claims data for services provided by chiropractic physicians in 2008. We aggregated the data to the hospital referral region level and used small area analysis techniques to generate descriptive statistics. We mapped geographic variations in chiropractic supply, use and utilization intensity (treatments per user), and quantified the variation by coefficient of variation and extremal ratio. We used Spearman rank correlation coefficient to correlate use with supply. We used a logistic regression model for chiropractic use and a multiple linear regression model for chiropractic utilization intensity.
RESULTS: The average regional supply of chiropractic physicians was 21.5 per 100,000 adult capita. The average percentage of beneficiaries who used chiropractic was approximately 7.6 (SD, 3.9). The average utilization intensity was 10.6 (SD, 1.8). Regional chiropractic supply varied more than 14-fold, and chiropractic use varied more than 17-fold. Chiropractic supply and use were positively correlated (Spearman ?, 0.68; P < 0.001). A low back or cervical spine problem was strongly associated with chiropractic use (odds ratios, 21.6 and 14.3, respectively). Increased chiropractic supply was associated with increased chiropractic use (odds ratio, 1.04) but not with increased chiropractic utilization intensity.
CONCLUSION: Both the supply of chiropractors and the utilization of chiropractic by older US adults varied widely by region. Increased chiropractic supply was associated with increased chiropractic use but not with increased chiropractic utilization intensity. Utilization of chiropractic care is likely sensitive to both supply and patient preference.
Keywords: Chiropractic, Spinal Manipulation, Medicare
From the FULL TEXT Article:
Introduction
The phenomenon of unwarranted geographic variations in medical care has been well documented. Through the use of small area analysis methods that define and evaluate health care markets, previous studies have uncovered significant variations in the distribution and use of medical services across the United States (US). For example, a high degree of regional variation in rates of lumbar spine surgery has been reported. [1] Such variations are likely to be unwarranted if they cannot be explained by patient preferences or underlying differences in population disease rates. In medical care, over-utilization of supply-sensitive care occurs when care is rendered in proportion to increased availability rather than clinical necessity. In many areas, more medical resources means delivery of more medical services, often without a corresponding improvement in health outcomes or better patient satisfaction. [2, 3] Despite the significant policy implications of these findings for medical and surgical services, few studies have explored geographic variations in the supply and utilization of alternative and complementary health services such as chiropractic.
Patients utilize chiropractic spinal manipulation (CSM) for treatment of pain. CSM has been found to be an effective treatment for certain types of pain of spinal origin, including lower back pain, neck pain and headaches. [4–9] Numerous studies have documented trends and patterns in the utilization of chiropractic services in the US. [10–21] Sharma and colleagues (2003) used logistic regression models for determinants of self-referral to chiropractors among adults, and found low back pain, increased patient age and income, availability of insurance coverage, and confidence in chiropractic physicians were among the factors associated with choice of chiropractic care. [22] Whedon and Song (in press) found that average chiropractic users in Medicare were 74 years old, 58–59% female and 96–97% White. [18] Weigel and colleagues (2010) found that chiropractic users in Medicare were more likely to visit medical physicians more frequently, live in the Midwest, and live in an area with fewer physicians per capita. [16]
Estimates of chiropractic supply run somewhat lower than Grier and Lepnurm’s (1995) proposed ideal ratio of 3.8 chiropractors per 10,000 population,23 (a generous estimate based upon the number of chiropractors that would be required to care for all patients with musculoskeletal disorders). Davis and colleagues (2009) estimated the supply of US chiropractors to be 2.4 per 10,000 adults in 2004, [12] but little is known about geographic variation in the relationship between chiropractic supply and utilization. Several studies have reported geographic variations in chiropractic utilization, but acknowledged the results may not have been nationally representative. [13, 24–26] A survey of 121 chiropractors found no correlation between numbers of new patients or patient visits and the chiropractor/population ratio in Australia, [27] where chiropractic is covered under federal insurance plans only by medical referral. [28] A national study of chiropractic utilization in the US found the use of chiropractic services under Medicare to be strongly correlated with the number of chiropractors per state. [17] Actual patterns of patient utilization of clinical services however often cross state borders, and US states typically contain multiple local health care markets, so state-level patterns of utilization may obscure local variations. [29–31]
A more granular geographic analysis should more accurately reflect patterns of chiropractic utilization and provide a better assessment of the supply sensitivity of chiropractic care. This investigation employed techniques of small area analysis in the evaluation of chiropractic supply and utilization under Medicare. Medicare is a US government administered health insurance program that provides access to health care services for US citizens aged 65 and older and for younger people with disabilities and certain illnesses. In 1972, Congress mandated the inclusion of chiropractic services as a Medicare benefit with limited coverage, [32]Medicare payments for chiropractic services are restricted to spinal manipulation treatments. Allowable reimbursement levels vary geographically and are determined by each of 15 Medicare administrative carrier jurisdictions. In 2008, chiropractic physicians provided 18.6 million clinical services under Medicare Part B at a cost of $420 million. [20]
The volume of chiropractic services in a given region is a function of both the number of chiropractic users and the utilization intensity (number of services per user). Geographic variations in the volume of services may therefore be sensitive to either the proportion of chiropractic users per region, the utilization intensity, or both. Increased regional supply could create a competitive environment that drives increased utilization intensity, and/or low supply could limit access to services, leading to decreased utilization. Chiropractors’ recommendations to their patients would likely influence the number of services their patients utilized, but chiropractors may lack similar opportunities to influence the initial choice to use chiropractic care. Therefore we hypothesized that an increased supply of chiropractors would be associated with increased utilization intensity, but the proportion of the population that used chiropractic would be less dependent on supply. The primary objective of this study was to examine the relationship between regional chiropractic supply and both use and utilization intensity of chiropractic services among Medicare beneficiaries.
Materials and Methods
Study Design
We used a cross-sectional design to analyze Medicare claims data for services provided by chiropractic physicians in 2008. The data used in this study were acquired and analyzed under a data user agreement with The Centers for Medicare and Medicaid Services (CMS). We performed the data analyses in STATA 11 (StataCorp LP, College Station, Texas) and SAS (SAS Institute Inc., Cary, North Carolina). We mapped geographic variations with ArcMap 10.0 (ESRI, Redlands, California). The author’s institutional review board reviewed and approved the research plan.
Sample
Chiropractic claims were identified by provider specialty code 35. We merged claims data in Carrier files with beneficiary demographics data in Denominator files. We based the file merger on the unique beneficary identifier. The resultant file was merged by Hospital Referral Region (HRR) [33] with US Census data from 2000 to provide population level data. The Carrier files provided a 20% representative sample of all Medicare Part B Fee-For-Service claims. The sample was restricted to beneficiaries aged 65–99 (living as of January 1st 2008), and the analysis was restricted to claims originating in the fifty US states and the District of Columbia. We excluded unallowed claims and duplicate claims for the same patient, provider, procedure and date of service. We excluded Medicare beneficiaries older than 99 to reduce the likelihood of individual identification, and suppressed data fields with fewer than 11 observations, in accordance with CMS rules for privacy protection. We aggregated the data to the HRR level and generated statistics for the 306 HRRs in the US. [34] The number of Medicare beneficiaries in the 20% sample was 5,022,782.
Analyses
We employed small area analysis techniques 35 to generate descriptive statistics by each of the 306 HRRs. We identified chiropractic users as beneficiaries with at least one claim for chiropractic services in 2008. We analyzed geographic variations in chiropractic supply (chiropractic physicians per 100,000 population), chiropractic use (chiropractic users per 1,000 Medicare beneficiaries), and chiropractic utilization intensity (services per chiropractic user).
The only chiropractic clinical service covered under Medicare is CSM, and Medicare will pay for only one clinical encounter per patient per day; so number of services may be equated with number of office visits. Chiropractic users (defined as beneficiaries with at least one chiropractic claim in 2008) were categorized by diagnosis code, using the International Classification of Diseases, Ninth Revision, Clinical Modification (ICD-9-CM). CMS allows claims for CSM only for certain specified diagnoses. Drawing from the ICD-9-CM codes allowable for chiropractic claims under Medicare, [36] we created categories intended to capture by anatomic region the pain disorders of spinal origin most effectively treated by chiropractors; low back pain, neck pain and headaches. [5, 6, 9, 37, 38] The three categories were “Low Back/Pelvis”, “Cervical Spine” and “Cranial”. [Appendix A] All Medicare beneficiaries were assigned to a diagnostic category if at least one of the diagnoses associated with a claim for any healthcare service under Medicare Part B was included in that category.
We mapped variations in chiropractic supply, use and utilization intensity under Medicare by HRR, and quantified the amount of variation by coefficient of variation (CV) and extremal ratio (ER). We employed Spearman’s rank correlation coefficient to correlate use with supply. We employed a logistic regression model for chiropractic use (as defined above) among Medicare Part B beneficaries. Multiple independent variables included both continuous and categorical covariates for provider supply and subject characteristics. Individual beneficiary age in years was categorized as 65–69 (the referent category), [70–74, 75–79, 80–84], and 85–99. Female gender was modeled in reference to male gender. Race was categorized as White (the referent category), Black, Hispanic, Asian, Native American and Other/Unknown. Diagnoses were categorized as described above. Two other group level independent variables from 2000 US census data measured subject demographic characteristics: percent of population with high school education (by zip code), and population median household income (in dollars, by zip code). Chiropractic and primary care physician supply were defined as providers per 100,000 general population. Primary care physicians (PCPs) were defined as medical doctors specializing in Internal Medicine, Family Medicine or General Practice. All provider types were identified by physician specialty code. We also modeled utilization intensity (as defined above) among beneficiaries who were chiropractic users; the multiple linear regression model used the same covariates as the logistic regression.
Results

Table 1
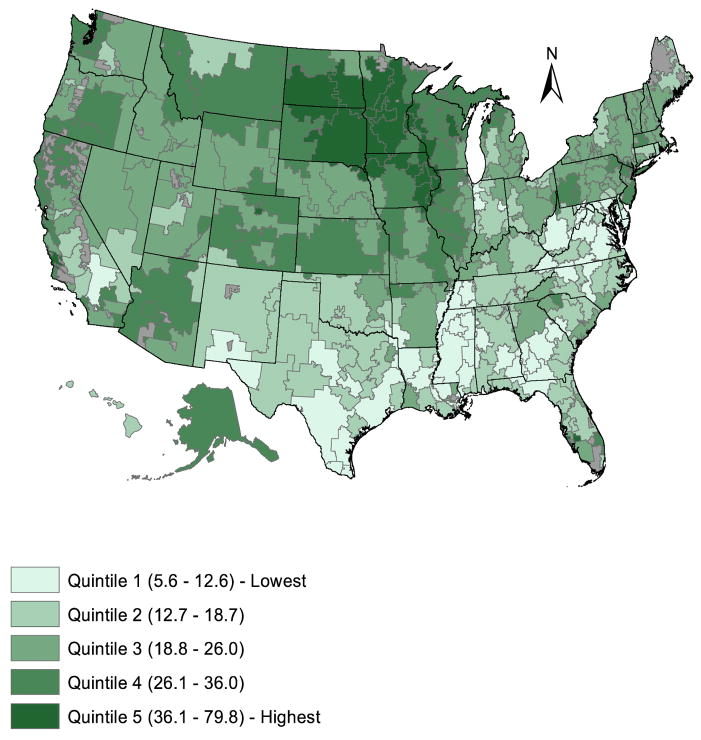
Figure 1
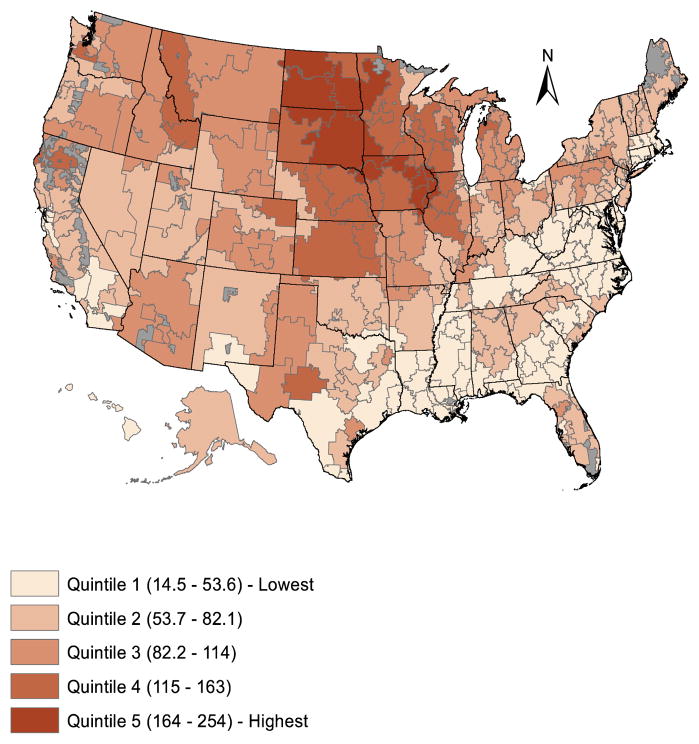
Figure 2 The average regional supply of chiropractic physicians was 21.5 per 100,000 population in 2008.[Table 1] The average percentage of beneficiaries who used CSM was approximately 7.6 (SD 3.9). CSM was used by an average 31% (SD 12.6) of 3,295 beneficiaries with an allowable lower back/pelvis diagnosis, 46% (SD 14.9) of 1,446 beneficiaries with an allowable cervical spine diagnosis, and 19% (SD 10.1) of 310 beneficiaries with an allowable cranial diagnosis. The average number of CSM treatments provided per user was 10.6 (SD 1.8).
Chiropractic Supply
Chiropractic supply varied regionally by a factor of more than 14 (CV 0.44). [Table 1] Areas where chiropractic supply was the highest included the Iowa regions of Davenport (79.8 chiropractic physicians per 100,000 population), Iowa City (47.8), and Sioux City (46.3), as well as Bismarck, North Dakota (48.1) and Sioux Falls, South Dakota (44.1). Among regions where supply was the lowest were the Mississippi regions of Oxford (5.6 chiropractic physicians per 100,000 population), Meridian (6.1), and Jackson (6.3), and the Texas regions of McAllen (6.5) and Harlingen (6.8). [Figure 1]
Chiropractic Use
Figure 2 illustrates regional geographic variations in chiropractic use. Overall use varied regionally by a factor of more than 17 (CV 0.51). Areas where chiropractic use was the highest includedMason City, Iowa (217 chiropractic users per 1,000 Medicare beneficiaries)
as well as four of the regions with the highest chiropractic supply:
Davenport (209) and Sioux City (254) in Iowa,
Bismarck, North Dakota (245), and Sioux Falls, South Dakota (244).
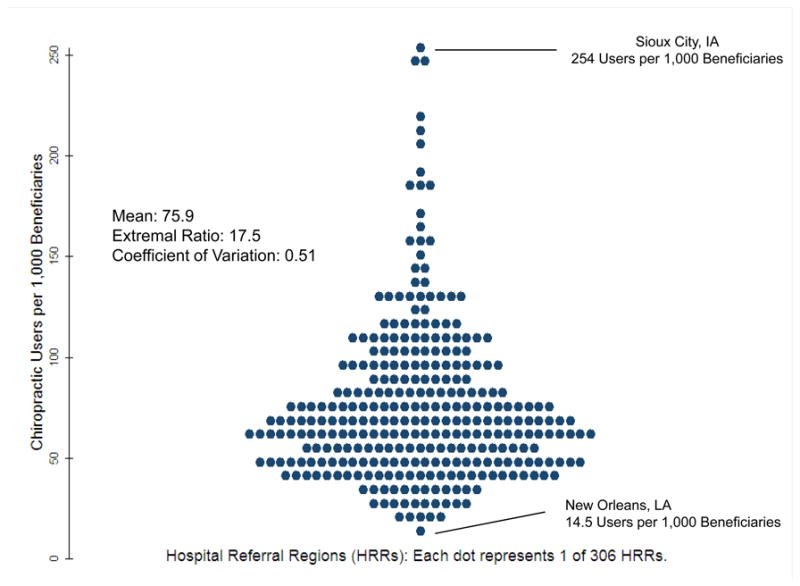
Figure 3
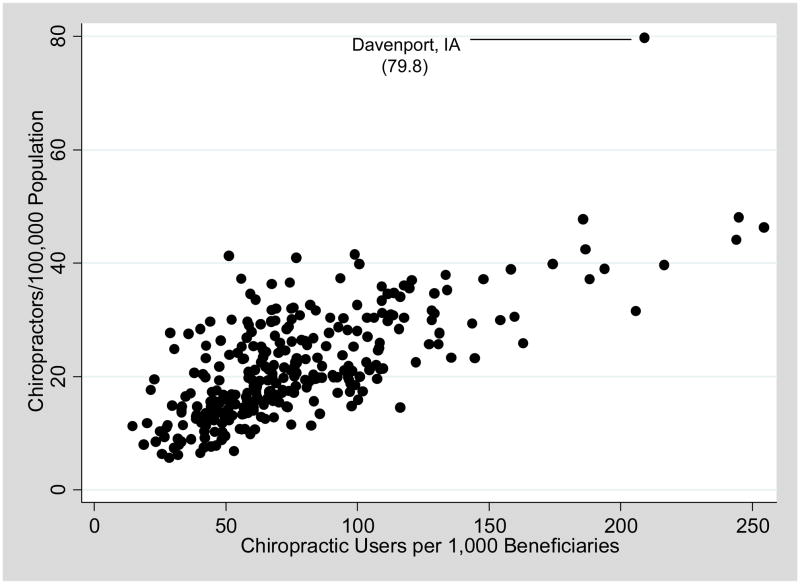
Figure 4 Among regions where chiropractic use was the lowest were the Louisiana regions of New Orleans (15 chiropractic users per 1,000 Medicare beneficiaries), Baton Rouge (20), and Metairie (23), as well as Takoma Park, Maryland (19) and Honolulu, Hawaii (22). The turnip plot further illustrates the distribution of regional variation in chiropractic use. [Figure 3] The greatest amount of variation in use was observed at the high end, beyond one standard deviation above the mean.
We found a strong positive correlation by HRR between chiropractic supply and overall chiropractic use. (Spearman’s rho 0.68, p<.001). [Figure 4] Chiropractic use declined as age increased. Asians, Hispanics Blacks and Native Americans were less likely to use chiropractic than Whites. A low back/pelvis or cervical spine problem (OR 21.6 and 14.3, respectively) was strongly associated with chiropractic use, but a cranial problem had no significant effect on the likelihood of chiropractic use. Higher population levels of income and PCP supply were associated with very small decreases in the likelihood of chiropractic use among beneficiaries. Chiropractic supply was associated with chiropractic use, independent of rates of allowable back and neck pain diagnoses in the Medicare beneficiary population (OR 1.04); for every additional chiropractor per 100,000 Medicare beneficiaries, the odds of a beneficiary being a chiropractic user increased by 4%. [Appendix B]
Chiropractic Utilization Intensity
Regional variation in utilization intensity (CV 0.17) was low relative to chiropractic supply (CV 0.44) and chiropractic use (CV 0.51). Chiropractic users aged 80–99 had significantly fewer visits than those aged 65–69. Female chiropractic users had more visits than male users. Asian, Hispanic and Native American chiropractic users had lower but Black users higher utilization intensity, as compared with White users. Patients with back or neck pain were more likely to receive more intensive treatment than those with cranial complaints. Level of chiropractic supply was not associated with level of utilization intensity. Higher population levels of education, income and PCP supply were associated with slightly greater utilization intensity among chiropractic users. [Appendix C]
Discussion
Implications
Our estimate of the supply of chiropractors is consistent with previous reports, [12, 17] and our regression model confirmed that chiropractic use was sensitive to gender and race.18 The observed patterns of geographic variation in use, and the correlation between supply and use also confirmed previous findings. [17] Contrary to our hypotheses, increased chiropractic supply was associated with increased use, but not with increased utilization intensity. We were surprised to find that a greater percentage of patients with allowable cervical spine problems (46%) than with allowable lower back problems (31%) used CSM, because the evidence for CSM is stronger for lower back problems than for cervical spine problems. Most chiropractic users were diagnosed with both lower back/pelvis and cervical spine problems, consistent with the increasingly common practice by chiropractors of treating three to four spinal regions per clinical encounter. [20] The inverse relationship between PCP supply and chiropractic use, although unexplained, is consistent with previous findings. [16] The curious relationship between PCP supply and chiropractic utilization intensity could reflect chiropractors’ response to competition from PCPs.
A patient’s decision to utilize a healthcare service should be based on need and/or preference. A Medicare beneficiary with primary and secondary diagnoses allowable for chiropractic claims meets the diagnostic criteria for “medical necessity” of CSM, as defined by CMS, [36] but a procedure that is medically necessary for purposes of claims processing should not be confused with clinically necessary care. For most of the conditions that chiropractors treat, such as non-specific low back pain, CSM is not the only appropriate treatment choice. Thus, use of CSM is likely preference sensitive. It is not known how the inclusion of information on chiropractic in shared clinical decision making process would affect rates of chiropractic use. Because the determinants of patient preference for chiropractic use are uncertain, it is not possible to determine optimal levels of chiropractic use. However, given the high degree of regional variation, it seems reasonable to conclude that use is not optimal everywhere. Our findings suggest that, regardless of beneficiary characteristic or diagnosis, the greater the regional supply of chiropractors, the more Medicare beneficiaries will use CSM. Use of CSM is likely sensitive in varying degrees to both supply and patient preference.
Analyzing for Geographic Variations in Chiropractic: Choice of Geographic Unit Patient choice of physician in the US is not always constrained by political boundaries, and patients frequently cross municipal, county and even state lines when seeking clinical care. Observation of actual medical utilization patterns has led to the development of several geographic units of analysis to facilitate the study of small area variations in healthcare. [34, 39] The 3,436 Hospital Service Areas (HSAs) and 6,542 Primary Care Service Areas (PCSAs) are small local markets for hospital care and primary care, respectively. The 306 Hospital Referral Regions (HRRs) are larger regional markets for tertiary health care. Localized patterns of chiropractic utilization have not been observed on a national basis, so no “chiropractic service areas” have been defined.
Chiropractic physicians practice in some ways like primary care doctors, and in other ways as specialists. Actual chiropractic utilization patterns may more closely resemble those of primary care than tertiary care, but the PCSA is too fine a unit of analysis for a national study of chiropractic. Because patients use fewer chiropractic services than medical services, analysis using small markets such as the HSA, PCSA or county would result in numerous units without data. Our use of the HRR as the unit of analysis represented a compromise between choice of units that that are either too big or too small. The development of chiropractic service areas would facilitate the conduct of future studies of geographic variations in chiropractic care.
Limitations
This study was subject to the limitations imposed by analysis of administrative data. Specifically, inconsistencies in the use of diagnosis codes is a threat to the validity of results related to patient condition. Our use of broad diagnostic categories was intended to blunt the impact of this issue. The results of the regression models may have been subjected to confounding because not all predictors of utilization were available for inclusion as covariates, and limited information on patient characteristics and clinical indications likely constrained the explanatory power of the models. The degree to which description of variation by HRR reflects actual utilization patterns is uncertain, but the size of the HRR appears to be a reasonable fit for the number and geographic distribution of chiropractic providers and users. Because chiropractic services have been available in certain Veteran’s Administration (VA) hospitals since 2004, our analysis may have underestimated chiropractic use among Medicare beneficiaries who were also eligible to receive VA health services. Finally, because of the restrictive nature of chiropractic coverage under Medicare, the results of this study cannot be used to evaluate chiropractic care in general - only CSM specifically. [40]
Conclusions
The supply of US chiropractors and utilization of CSM by older US adults varied widely by region. The variations cannot be entirely explained by basic patient characteristics or clinical indication, and there is insufficient evidence to explain the variation by patient preferences. Increased chiropractic supply was associated with increased CSM use, but not with increased CSM utilization intensity. Utilization of chiropractic care is likely sensitive to both supply and patient preference. To better inform the most advantageous allocation and patient-centered utilization of chiropractic resources, more research is needed on how and why patients do or do not choose chiropractic care.
KEY POINTS
Chiropractic supply and utilization under Medicare varied widely by US region.
There was a strong positive correlation between chiropractic supply and
overall chiropractic use among Medicare beneficiaries.The regional supply of chiropractors was predictive of use of chiropractic care by
Medicare beneficiaries, but did not predict number of visits per user.Utilization of chiropractic care by Medicare beneficiaries is likely sensitive to
both supply and patient preference.Supplementary Material
SOURCES OF FUNDING
Dr. Whedon is funded by an NIH grant (Award Number 5K01AT005092; National Center for Complementary and Alternative Medicine) and by a private foundation grant: “Another look at the budget neutrality of the Medicare chiropractic services demonstration” (NCMIC Foundation).
Dr. Davis is funded by an NIH grant (Award Number 1K01AT006162; National Center for Complementary and Alternative Medicine).
Dr. Song has no funding to declare.
Dr. Lurie is funded by grants from NIH and AHRQ.
CONFLICTS OF INTEREST
Dr. Lurie consults for Baxano, FIMDM, and Blue Cross Blue Shield. The other authors have no conflicts of interest to disclose.
The views expressed herein do not necessarily represent the official views of the National Center for Complementary and Alternative Medicine or the National Institutes of Health.
The research plan for this study was reviewed and approved by The Committee for Protection of Human Subjects, Dartmouth College.
The manuscript submitted does not contain information about medical device(s)/drug(s). Grant funds were received to support this work. One or more of the author(s) has/have received or will receive benefits for personal or professional use from a commercial party related directly or indirectly to the subject of this manuscript: e.g., honoraria, gifts, consultancies, royalties, stocks, stock options, decision making position
Contributor Information
James M. Whedon, The Dartmouth Institute for Health Policy and Clinical Practice, Lebanon, NH.
Yunjie Song, The Dartmouth Institute for Health Policy and Clinical Practice, Lebanon, NH.
Matthew A. Davis, The Dartmouth Institute for Health Policy and Clinical Practice, Lebanon, NH.
Jonathan D Lurie, Orthopaedic Surgery and The Dartmouth Institute, Lebanon, NH.
References:
Weinstein JN, Lurie JD, Olson PR, Bronner KK, Fisher ES.
United States’ trends and regional variations in lumbar spine surgery: 1992–2003.
Spine. 2006 Nov 1;31(23):2707–2714Fisher ES, Wennberg DE, Stukel TA, Gottlieb DJ, Lucas FL, Pinder EL.
The implications of regional variations in Medicare spending. Part 2: health outcomes and
satisfaction with care.
Ann Intern Med. 2003 Feb 18;138(4):288–298Fisher ES, Wennberg DE, Stukel TA, Gottlieb DJ, Lucas FL, Pinder EL.
The implications of regional variations in Medicare spending. Part 1: the content, quality,
and accessibility of care.
Ann Intern Med. 2003 Feb 18;138(4):273–287Bronfort G., Assendelft W.J.J., Evans R., Haas M., Bouter L.
Efficacy of Spinal Manipulation for Chronic Headache: A Systematic Review
J Manipulative Physiol Ther 2001 (Sept); 24 (7): 457–466Bronfort G Haas M Evans RL et al.
Efficacy of Spinal Manipulation and Mobilization for Low Back Pain and Neck Pain:
A Systematic Review and Best Evidence Synthesis
Spine J (N American Spine Soc) 2004 (May); 4 (3): 335–356Bronfort G, Nilsson N, Haas M, et al.
Non-invasive Physical Treatments for Chronic/Recurrent Headache
Cochrane Database Syst Review 2004; (3): CD001878Chou R, Qaseem A, Snow V, Casey D, Cross JT Jr., Shekelle P, Owens DK:
Diagnosis and Treatment of Low Back Pain: A Joint Clinical Practice Guideline
from the American College of Physicians and the American Pain Society
Annals of Internal Medicine 2007 (Oct 2); 147 (7): 478–491Guzman J, Haldeman S, Carroll LJ, et al.
Clinical Practice Implications of the Bone and Joint Decade 2000-2010
Task Force on Neck Pain and Its Associated Disorders:
From Concepts and Findings to Recommendations
Spine (Phila Pa 1976). 2008 (Feb 15); 33 (4 Suppl): S199–S212Rubinstein SM, van Middelkoop M, Assendelft WJ, de Boer MR, van Tulder MW.
Spinal manipulative therapy for chronic low-back pain.
Cochrane Database Syst Rev. 2011;2:CD008112Cherkin DC, Deyo RA, Volinn E, Loeser JD.
Use of the International Classification of Diseases (ICD-9-CM) to identify hospitalizations
for mechanical low back problems in administrative databases.
Spine. 1992 Jul;17(7):817–825Davis, MA, Sirovich, BE, and Weeks, WB.
Utilization and Expenditures on Chiropractic Care
in the United States from 1997 to 2006
Health Serv Res. 2010 (Jun); 45 (3): 748-761Davis MA, Davis AM, Luan J, Weeks WB.
The supply and demand of chiropractors in the United States from 1996 to 2005.
Alternative Therapies in Health & Medicine. 2009;15(3):36–40Hawk C, Long CR.
Factors affecting use of chiropractic services in seven midwestern states of the United States.
Journal of Rural Health. 1999;15(2):233–239Hurwitz EL, Coulter ID, Adams AH, Genovese BJ, Shekelle PG.
Use of chiropractic services from 1985 through 1991 in the United States and Canada.
American Journal of Public Health. 1998;88(5):771–776Lawrence, DJ and Meeker, WC.
Chiropractic and CAM Utilization: A Descriptive Review
Chiropractic & Osteopathy 2007 (Jan 22); 15: 2Weigel P, Hockenberry JM, Bentler SE, Obrizan M, Kaskie B, Jones MP, Ohsfeldt RL.
A Longitudinal Study of Chiropractic Use Among Older Adults in the United States
Chiropractic & Osteopathy 2010 (Dec 21); 18: 34Whedon JM.
Geographic variations in availability, use and cost of chiropractic under Medicare.
J Manipulative Physiol Ther. 2012 Feb;35(2):101–9Whedon JM.
Racial inequalities in the use of chiropractic under Medicare.
Alternative Therapies in Health and Medicine In PressWhedon JM, Davis MA.
Medicare part B claims for chiropractic spinal manipulation, 1998 to 2004.
J Manipulative Physiol Ther. 2010;33(8):558–561Whedon JM, Song Y, Davis MA.
Trends in the Use and Cost of Chiropractic Spinal Manipulation Under Medicare Part B
Spine J. 2013 (Nov); 13 (11): 1449–1454Wolinsky F, Liu L, Miller T, et al.
The use of chiropractors by older adults in the United States.
Chiropr Osteopat. 2007 Sep 6;15(12)Sharma R, Haas M, Stano M.
Patient Attitudes, Insurance, and Other Determinants of
Self-referral to Medical and Chiropractic Physicians
American Journal of Public Health 2003 (Dec); 93 (12): 2111–2117Grier AR, Lenora R.
Modeling a chiropractor: population ratio.
J Manipulative Physiol Ther. 1995;7(18):464–470Cherkin DC, Mootz RD, eds.
Chiropractic in the United States: Training, Practice, and Research
Rockville, Md: Agency for Health Care Policy and Research,
Public Health Service, US Dept of Health and Human Services; 1997.
AHCPR publication 98-N002.Shekelle PG, Brook RH.
A community-based study of the use of chiropractic services.
Am J Public Health. 1991 Apr;81(4):439–442Von Kuster T.
Chiropractic Health Care: A National Study of Cost of Education, Service Utilization,
Number of Practicing Doctors of Chiropractic and Other Key Policy Issues.
Washington, DC: Foundation for the Advancement of Chiropractic Tenets and Science; 1980Leboeuf C, Morrow JD, Payne RL.
A preliminary investigation of the relationship between certain practice characteristics and
practice location: chiropractor-population ratio.
J Manipulative Physiol Ther. 1989 Aug;12(4):253–258Xue CC, Zhang AL, Lin V, Myers R, Polus B, Story DF.
Acupuncture, chiropractic and osteopathy use in Australia: a national population survey.
BMC Public Health. 2008;8(105):105Goodman DC, Mick SS, Bott D, et al.
Primary care service areas: a new tool for the evaluation of primary care services.
Health Serv Res. 2003 Feb;38(1 Pt 1):287–309Goody B.
Defining rural hospital markets.
Health Serv Res. 1993 Jun;28(2):183–200Zwanziger J, Mukamel DB, Indridason I.
Use of resident-origin data to define nursing home market boundaries.
Inquiry. 2002 Spring;39(1):56–66United States Congress. HR 1: Social Security Amendments for 1972.
Washington, DC: US Government Printing Office; 1972The Dartmouth Atlas of Healthcare. [Accessed August 12, 2011];Data by Region.
http://www.dartmouthatlas.org/data/region/The Dartmouth Institute for Health Policy and Clinical Practice.
Appendix on the Geography of Health Care in the United States.
The Dartmouth Atlas of Health Care; [Accessed December 7, 2011].
http://www.dartmouthatlas.org/downloads/methods/geogappdx.pdfPaul-Shaheen P, Williams D, Clark J.
Small Area Analysis: A Review and Analysis of the North American Literature.
Journal of Health Politics, Policy and Law. 1987;12(4):741–809Centers for Medicare and Medicaid Services.
Chiropractic Billing Guide.
Washington, DC: U.S. Department of Health and Human Services; Jul, 2010Gross A, Miller J, D’Sylva J, Burnie SJ, Goldsmith CH, Graham N, et al.
Manipulation or Mobilisation For Neck Pain: A Cochrane Review
Manual Therapy 2010 (Aug); 15 (4): 315–333Walker BF, French SD, Grant W, Green S.
Combined chiropractic interventions for low-back pain.
Cochrane Database Syst Rev. 2011;14(4):CD005427The Dartmouth Institute for Health Policy and Clinical Practice. [Accessed June 21, 2011];
The Primary Care Service Area Project.
http://pcsa.dartmouth.edu/pcsa.html.Whedon JM, Davis MA, Phillips RB.
Implications and Limitations of Appropriateness Studies for Chiropractic.
Journal of Chiropractic Humanities. 2010;17(1):40–46.
Return to MEDICARE
Return to LOW BACK PAIN
Since 9–16–2017
| Home Page | Visit Our Sponsors | Become a Sponsor |
Please read our DISCLAIMER |