

Where the United States Spends its Spine Dollars:
Expenditures on Different Ambulatory Services
for the Management of Back and Neck ConditionsThis section is compiled by Frank M. Painter, D.C.
Send all comments or additions to: Frankp@chiro.org


FROM: Spine (Phila Pa 1976). 2012 (Sep 1); 37 (19): 1693–1701 ~ FULL TEXT
OPEN ACCESS Matthew A. Davis, DC, MPH
The Dartmouth Institute for Health Policy and Clinical Practice,
Lebanon, NH 03766, USA.
matthew.a.davis@dartmouth.edu
STUDY DESIGN: Serial, cross-sectional, nationally representative surveys of noninstitutionalized US adults.
OBJECTIVE: To examine expenditures on common ambulatory health services for the management of back and neck conditions.
SUMMARY OF BACKGROUND DATA: Although it is well recognized that national costs associated with back and neck conditions have grown considerably in recent years, little is known about the costs of care for specific ambulatory health services that are used to manage this population.
METHODS: We used the Medical Expenditure Panel Survey to examine adult (aged 18 yr or older) respondents from 1999 to 2008 who sought ambulatory health services for the management of back and neck conditions. We used complex survey design methods to make national estimates of mean inflation-adjusted annual expenditures on medical care, chiropractic care, and physical therapy per user for back and neck conditions.
Results Approximately 6% of US adults reported an ambulatory visit for a primary diagnosis of a back or neck condition (13.6 million in 2008).CONCLUSION: Although this study did not explore the relative effectiveness of different ambulatory services, recent increasing costs associated with providing medical care for back and neck conditions (particularly subspecialty care) are contributing to the growing economic burden of managing these conditions.
- Between 1999 and 2008, the mean inflation-adjusted annual expenditures
on medical care for these patients increased by 95% (from $487 to $950);
most of the increase was accounted for by increased costs for
medical specialists, as opposed to primary care physicians.Over the study period, the mean inflation-adjusted annual expenditures
on chiropractic care were relatively stable;While physical therapy was the most costly service overall, in recent years
those costs have contracted.
Keywords: Medical Expenditure Panel Survey (MEPS), Spine Expenditures, Back Pain, Neck Pain
From the FULL TEXT Article:
Introduction
Back and neck conditions are associated with considerable costs to the US economy both due to direct expenditures on their management and to indirect costs from losses in productivity. Between 49% and 70% of all adults will experience a back pain episode during their lifetime, and, at any given point in time, 12% to 30% of adults have an active back problem. [1] Back pain is the second most common reason adults consult a primary care provider, following upper respiratory infections. [2, 3] In recent years the prevalence and expenditures on spinal conditions in the US has increased significantly despite little change in the health status among people who suffer from these conditions. [4, 5] Estimates of the total expenditures on care vary, but the general consensus is that approximately $90 billion is spent on the diagnosis and management of low back pain, and an additional $10 to $20 billion is attributed to economic losses in productivity each year. [4, 6, 7] However, little is known about the pattern of expenditures for different health services that manage this population.
It is generally accepted that medical care per unit (i.e. either per procedure or per episode) has gotten more expensive. Less is known about the cost of other non-medical services, such as chiropractic care and physical therapy, that manage a large percentage of back and neck cases in the US. [8] Examining expenditures on the various ambulatory health services for back and neck conditions, particularly over time, is essential for health policy makers. Such information offers insight into the effects of health policy decisions and informs future strategies in regards to cost-containment efforts. As future health policy decisions will entail consideration of the overall cost and effectiveness of spinal interventions to improve population health, it is important to have a better understanding of spending patterns on health services.
Therefore we used the Medical Expenditure Panel Survey (MEPS) to examine US expenditures on common ambulatory health services for the management of back and neck conditions (spine conditions). We specifically examined expenditures on medical care, chiropractic care, and physical therapy—three of the most common ambulatory health services utilized by individuals with spine conditions.
Materials and Methods
The MEPS is a nationally representative survey of the non-institutionalized US population that is conducted annually by the Agency for Healthcare Research and Quality (AHRQ). [9] Information is gathered on healthcare utilization, expenditures, and health status. The MEPS utilizes an overlapping panel design consisting of a household component, medical provider component, and insurance provider component. For each year, personal and family level data obtained from the household, medical provider, and insurance provider are collected and aggregated. We used data from the MEPS consolidated annual files and the office-based and outpatient event files to gather information of ambulatory health services. Because our study used de-identified and publically available data it was granted an exemption from institutional board review by XX’s Committee for the Protection of Human Subjects.
Study Sample
We analyzed data from all adult (≥ 18 years) respondents to the MEPS survey from 1999 to 2008. The MEPS utilizes a sample frame of the previous year’s National Health Interview Survey to identify respondents. Sample sizes for the MEPS from these years ranged from a low of 23,565 individuals in 1999 to a high of 37,418 in 2002; response rates ranged from 56.9% in 2007 to 66.3% in 2001.
Respondents to the MEPS survey were asked if they had seen a healthcare provider in the past 6 months and, if so, what type of provider they visited, how many visits were made, and how much was spent on the service. Among the different healthcare provider types in the MEPS were “medical doctor,” “chiropractor,” or “physical therapist.” Starting in 2002, the MEPS recorded information on the specialty of the medical physician, allowing us to compare expenditures on primary care versus medical specialty services from 2002 to 2008. We operationally defined primary care as medical physicians identified as “family physicians,” “internal medicine,” or “general practice.”
For all visits, the MEPS reports the “best category for visit;” we used this variable to identify only visits made for “diagnosis and management” for this study.
If the individual reported having seen a healthcare provider, the MEPS proceeded to contact the individual’s provider and healthcare insurance to verify information regarding utilization (i.e. visit dates and details of office-based or outpatient visits) and expenditures. Our analysis used adult MEPS respondents who reported having seen any provider for an ambulatory health service for a primary diagnosis of spine condition, which ranged from 941 in 1999 to 1,607 in 2002.
Measures
Expenditures and Ambulatory Visits for Spine Conditions The MEPS separates ambulatory visits to healthcare providers into either office-based or outpatient “events.” An outpatient event is defined as an ambulatory visit to an outpatient facility within a hospital; an office-based event, as a visit to healthcare provider’s office. We combined office-based and outpatient events to acquire information on the total number of annual ambulatory visits and expenditures on health services for spine conditions. For each respondent who reported an ambulatory visit for spine condition we aggregated their total expenditures and determined the mean total annual expenditures and expenditure per visit according to the health service.
The MEPS inquires about the health conditions and use of health services to address them. These self-reported conditions are then mapped to ICD-9-CM codes by trained MEPS coders. To identify ambulatory visits for spine conditions we used a combination of ICD-9-CM codes that have been demonstrated to capture the majority of such conditions (Appendix Table 1). [7, 10] To ensure respondent confidentiality, the MEPS limits ICD-9-CM codes to 3 digits; therefore, the level of detail of spine condition diagnoses was somewhat limited. To ensure that the codes were similar across the health services we examined, we calculated the unweighted percent of ICD-9-CM codes by user type for 2008—which was comparable (Appendix Table 1). We did not include ICD-9-CM procedure codes because these were limited to 2 digits, rendering them unable to be attributed to spine conditions.
The MEPS reports up to 4 ICD-9-CM codes for each ambulatory visit. While previous reports that aimed to represent total utilization and expenditure related to spine conditions have used all 4 ICD-9-CM codes to identify visits, [4, 5] we used only the primary diagnosis ICD-9-CM code (the first ICD-9-CM code reported). Because our study aimed to compare expenditures on common ambulatory services for the management of spine conditions (rather than estimate all use or expenditures), including only those visits made for a primary diagnosis of spine conditions provides a more direct comparison across the health services we examined.
Sociodemographic and Health Status Data We examined sociodemographic data for individuals who had reported an ambulatory visit to a US provider for a primary diagnosis of a spine condition in 1999 and 2008 including: age, gender, race/ethnicity, healthcare insurance type, and education. To determine whether the health status of respondents who reported use of ambulatory health services changed over the 10-year time period, we examined self-reported health status measures. Since self-reported health status has been shown to be a strong predictor of health and mortality, [11] we used this as our primary measure of respondent health status and collapsed this variable into “excellent,” “very good, or good” and “fair or poor.” We also determined the percentage of respondents with “any functional limitation” which is based on a combination of both physical and cognitive limitations collected by the MEPS.
Beginning in 2000 the MEPS collected information on body mass index (BMI), smoking status, and SF-12 scores. We determined the percentage of respondents who were obese (BMI ≥ 30 kg/m2) and who smoked, and we calculated the mean Physical and Mental Composite Summary [12] from 2000 to 2008 (Appendix Table 2). To make data comparable across the study time period, we converted Physical and Mental Composite Summary scores for MEPS calendar years 2000 and 2001, during which time the MEPS used version 1, to version 2 scores, using standard methods. [13]
For measures that were acquired multiple times per year, we used the last measurement of the corresponding calendar year.
Analyses
To estimate expenditures on ambulatory visits for spine conditions, we converted all healthcare expenditure data to 2008 dollars using the Consumer Price Index (CPI) for professional medical services provided by the US Bureau of Labor Statistics. [14] To determine whether the type of adults visiting providers changed over the ten-year study period, we performed univariate analyses comparing characteristics of respondents with spine conditions from 1999 to 2008 using a t-test for mean comparisons and a χ2 test for comparisons of proportions. To examine potential trends in mean annual expenditure per user from 1999 to 2008, we used linear regression adjusted for age, gender, healthcare insurance coverage, and other covariates. Specifically, we examined the statistical significance for the coefficient for year (as a categorical variable) in our linear regression models to test for trend.
We used complex survey design methods to generate all descriptive analyses (including national estimates, standard errors, and 95% confidence intervals) of the datasets using STATA version 11.1 statistical software (College Station, Texas), which account for a respondent’s probability of selection and sampling methodology.
Results

Table 1 According to our estimates, in 1999, 11.9 million adults had an ambulatory visit for a primary diagnosis of a spine condition (Table 1). This number increased approximately 15% over the study period to 13.6 million in 2008; however, with population growth, the proportion of all US adults reporting a visit for a primary diagnosis of a spine condition remained constant at approximately 6%. The amount of overlap use of healthcare services among adults with spine conditions was remarkably stable over the ten year time period (84-86% used only one service, 13-14% used two different services, and 1-2% used all three of the ambulatory services we examined).
Ambulatory Visits
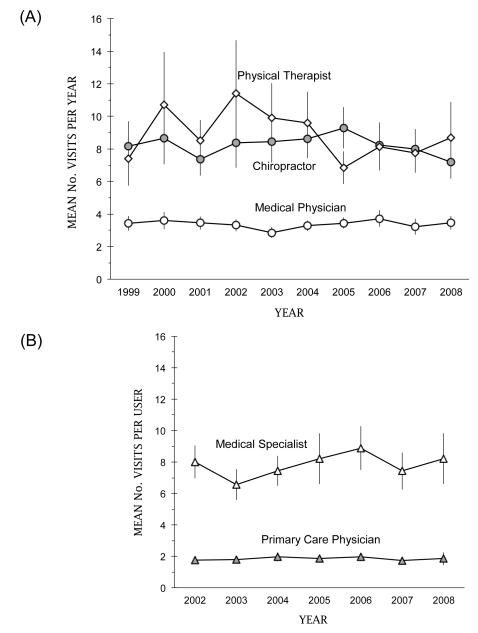
Figure 1 The mean number of ambulatory visits to medical physicians for a primary diagnosis of a spine condition fluctuated between approximately 2.9 and 3.7 visits per year from 1999 to 2008 (Figure 1A). The mean number of visits for chiropractic fluctuated between 7.2 and 9.3 visits per year. We found the most variability in service use among adult users of physical therapy, with the mean number of visits per year ranging between a high of 11.4 in 2002 to a low of 6.8 in 2005; nevertheless, the differences we saw were not statistically significant.
The mean number of annual visits per user of primary care was stable while the mean annual number of visits to specialists varied but increased from 6.6 in 2003 to 8.9 in 2006 (Figure 1B).
Annual Expenditures on Ambulatory Health Services
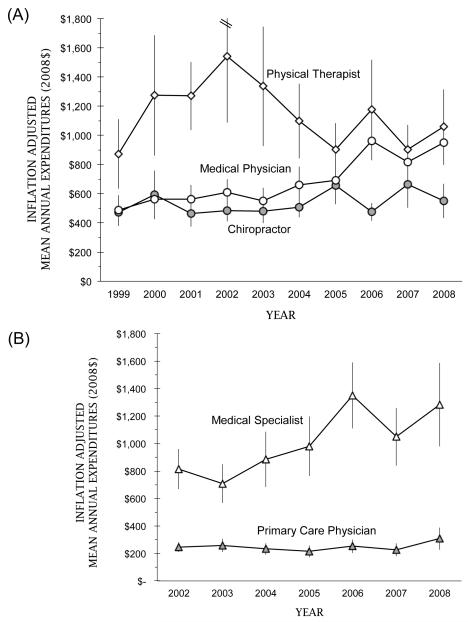
Figure 2 We found inconsistent trends in expenditures per user across the health services we examined. The most consistent trend was observed for expenditure on medical care (Figure 2A). Among adults who reported any expenditure on medical care for a primary diagnosis of a spine condition, the mean inflation-adjusted expenditure increased by 95% (from $487 in 1999 to $950 in 2008). We found a contraction in expenditures on medical care in 2007 and 2008, possibly due to the coinciding economic recession. [15] For chiropractic care, the mean expenditure varied much less, fluctuating between a low of $473 in 1999 and a high of $662 in 2007. The annual inflation-adjusted mean expenditure per user on physical therapy peaked in 2002 at $1,543 and apparently contracted thereafter; however, the confidence intervals for physical therapy were large, implying considerable variation in expenditures among physical therapy users.
We found significant increases in expenditures on specialty care with little change in inflation-adjusted expenditures on services provided by primary care physicians (Figure 2B).
Table 2 In our linear regression models, time was predictive in explaining inflation-adjusted expenditures on medical care and chiropractic care when adjusted for sociodemographic and health status covariates (the coefficient for year in our model was 1.04 (95% CI 1.02, 1.05) for medical care and 1.02 (95% CI 1.00, 1.04) for chiropractic care for predicting an incremental increase in $100 2008 dollars) (Table 2). Across all health services we examined, having “any limitation” was strongly predictive of health spending. In particular, poorer health status (both “fair” or “poor” health status and reporting “any limitation”) was most predictive of medical care expenditures. However, interaction terms between time and health status measures were insignificant suggesting differences in patients’ health status over time do not explain expenditure trends on medical care. Being privately insured and living in an MSA was predictive of higher healthcare spending among adult users of medical and chiropractic care.
Discussion
We used the MEPS to examine expenditures on common ambulatory health services for the management of spine conditions between 1999 and 2008. According to our estimates, the total annual expenditures on medical care for the management of spine conditions has grown significantly in recent years while expenditures on chiropractic care and physical therapy have not experienced the same growth. Our study suggests that this growth in medical care is due primarily to increases in expenditures on specialty care services (expenditures on primary care physician services were remarkably stable over the ten years we examined). Consistent with previous reports, [4, 5] we also found that the health status of adults with a primary diagnosis of a spine condition has not improved despite increasing costs over time.
The information provided by our study is particularly important for examining the effects of health policy decisions that aim to control cost. The effects of health policy decisions pertaining to reimbursement of health services for spine condition management have observable effects over time. For example, our analyses on the per user level suggest stability in expenditures on health services such as chiropractic care. [8] From 2005 to 2007 the Centers for Medicare and Medicaid Services’ (CMS) Office of Research Development and Information conducted a study to examine the economic impacts of expansion of reimbursable services (i.e. coverage of diagnostic and examination) treatment of neuromuscular conditions by chiropractors and concluded that such expansion would result in higher costs. [16] The stability in expenditures on chiropractic care is likely due to health policy decisions to limit chiropractors’ reimbursable practices whereas medical specialists rely more heavily on reimbursable advanced technologies (which are more subject to increased expenditures).
There are important decisions on the horizon regarding the US healthcare system pertaining to cost and cost-effectiveness of health services. Our findings imply that medical care, specifically specialty care, rather than primary care, chiropractic care, or physical therapy, is responsible for rising ambulatory care costs for spine conditions. Increases in expenditures on specialty care are likely influenced by collaborative markets such as producers of medical supplies as well as the growth in technological dependence overall, while physical therapy and chiropractic care are less influenced by technologically-based innovations. [18] In addition, resistance to shrinking reimbursement from third party sources among larger groups with more leverage such as medical specialists may partially explain the trends we observed. [17] While our study did not explicitly consider the relative effectiveness of different health services (which is likely dependent on the specific spine condition), our findings do imply that strategies aimed at reducing dependency on specialty care would mitigate national spending on spine conditions. In light of some evidence that specialists provide services that could be performed in a primary care setting, [19, 20] national efforts to substitute primary care for management by specialists may have cost-containment benefits for this population.
To inform overall value and future health policy decisions, it will be critical to determine the relative effectiveness of these different health services as our analyses clearly demonstrate differences in expenditures.Study Limitations
Our study has several limitations that must be acknowledged. First, we investigated only treatment patterns, utilization, and expenditures for common health services among non-institutionalized US adult (≥ 18 years) citizens. Including inpatient services and expenditures on pharmaceuticals would significantly increase our estimates on medical care, and findings for children or institutionalized adults may differ. Second, the MEPS data on healthcare utilization and expenditures are self-reported by patients, potentially causing inaccuracies; however, the MEPS attempts to correct self-reported errors by verifying response data with the respondent’s healthcare providers and healthcare insurance providers. Finally, our analyses did not separate expenditures on diagnostic procedures from expenditures on consultations—differences in the location where services were provided (i.e. office-based versus outpatient) among health services could have affected our results. We did perform all analyses excluding ambulatory visits that included a diagnostic procedure and while the overall expenditures dropped slightly, trends in expenditures among specific ambulatory services were unaffected.
Despite the inherent limitations of our study, our findings offer important information regarding expenditures on health services for spine conditions. Therefore our findings will help inform future studies that examine the relative cost-effectiveness these services. Health policy makers should consider these finding when developing national strategies to manage the large population of Americans with spine conditions.
Key Points
It is well known that national expenditures on spine conditions have increased in recent years in the absence in improvement in the health status of the spine condition population.
Among the most common ambulatory health services that manage spine conditions, expenditures on medical care has increased mostly due to expenditures related to providing specialty care.
Non-technologically based ambulatory health services that manage spine conditions such as chiropractic care and physical therapy have not experienced the same increases in expenditures per user.
Future health policy decisions must be informed by the relative cost-effectiveness of ambulatory health services that manage the spine condition population.
References
Koes BW, van Tulder MW, Ostelo R, Kim Burton A, Waddell G.
Clinical Guidelines for the Management of Low Back Pain
in Primary Care: An International Comparison
Spine (Phila Pa 1976) 2001 (Nov 15); 26 (22): 2504–2513Andersson GB.
Epidemiological features of chronic low-back pain.
Lancet. 1999;354(9178):581–585Hart LG, Deyo RA, Cherkin DC.
Physician office visits for low back pain. Frequency, clinical evaluation, and treatment patterns from a U.S. national survey.
Spine (Phila Pa 1976) 1995;20(1):11–19Martin BI, Deyo RA, Mirza SK, Turner JA, Comstock BA, Hollingworth W, et al.
Expenditures and Health Status Among Adults With Back and Neck Problems
JAMA 2008 (Feb 13); 299 (6): 656–664Martin BI, Turner JA, Mirza SK, Lee MJ, Comstock BA, Deyo RA.
Trends in Health Care Expenditures, Utilization, and Health Status
Among US Adults With Spine Problems, 1997-2006
Spine (Phila Pa 1976). 2009 (Sep 1); 34 (19): 2077–2084Dagenais S, Caro J, Haldeman S.
A Systematic Review of Low Back Pain Cost of Illness Studies
in the United States and Internationally
Spine J 2008 (Jan); 8 (1): 8–20Cherkin DC, Deyo RA, Volinn E, Loeser JD.
Use of the International Classification of Diseases (ICD-9-CM) to identify hospitalizations for mechanical low back problems in administrative databases.
Spine (Phila Pa 1976) 1992;17(7):817–825Davis, MA, Sirovich, BE, and Weeks, WB.
Utilization and Expenditures on Chiropractic Care
in the United States from 1997 to 2006
Health Serv Res. 2010 (Jun); 45 (3): 748-761Medical Expenditure Panel Survey
[Accessed March 5, 2011];
Agency for Health Care Policy and Research,
Household Component Full Year Files. 2008
http://www.meps.ahrq.gov/mepsweb/data_stats/download_data_files.jspLuo X, Pietrobon R, Sun SX, Liu GG, Hey L.
Estimates and Patterns of Direct Health Care Expenditures Among Individuals
With Back Pain in the United States
Spine (Phila Pa 1976) 2004 (Jan 1); 29 (1): 79–86DeSalvo KB, Bloser N, Reynolds K, He J, Muntner P.
Mortality prediction with a single general self-rated health question. A meta-analysis.
J Gen Intern Med. 2006;21(3):267–275Ware J, Jr., Kosinski M, Keller SD.
A 12-Item Short-Form Health Survey: construction of scales and preliminary tests of reliability and validity.
Med Care. 1996;34(3):220–233Ware JE, Kosinksi M, Turner-Bowker DM, Gandek B.
How to Score Version 2 of the SF-12 (r) Health Survey.
Quality Metrics Inc.; Lincon, RI: 2002United States Bureau of Labor Statistics
[Accessed September 5, 2011];
Consumer Price Index.
http://www.bls.gov/cpiMartin A, Lassman D, Whittle L, Catlin A.
Recession contributes to slowest annual rate of increase in health spending in five decades.
Health Aff (Millwood) 2011;30(1):11–22Statson WB, Shepard DS, Ritter G, Tompkins C.
Analysis of buget neutrality of the demonstration of coverage of chiropractic services under Medicare. 2009Robinson JC.
Hospital market concentration, pricing, and profitability in orthopedic surgery and interventional cardiology.
Am J Manag Care. 2011;17(6 Spec No.):e241–248Meeker, W., & Haldeman, S. (2002).
Chiropractic: A Profession at the Crossroads of Mainstream and Alternative Medicine
Annals of Internal Medicine 2002 (Feb 5); 136 (3): 216–227Starfield B, Chang HY, Lemke KW, Weiner JP.
Ambulatory specialist use by nonhospitalized patients in us health plans: correlates and consequences.
J Ambul Care Manage. 2009;32(3):216–225Valderas JM, Starfield B, Forrest CB, Sibbald B, Roland M.
Ambulatory care provided by office-based specialists in the United States.
Ann Fam Med. 2009;7(2):104–111
Return to LOW BACK PAIN
Since 11-04-2015
| Home Page | Visit Our Sponsors | Become a Sponsor |
Please read our DISCLAIMER |