

Medicare's Demonstration of Expanded Coverage for
Chiropractic Services: Limitations of the
Demonstration and an Alternative
Direct Cost Estimate
This section is compiled by Frank M. Painter, D.C.
Send all comments or additions to: Frankp@chiro.org


FROM: J Manipulative Physiol Ther 2013 (Oct); 36 (8): 468–481
OPEN ACCESS William B. Weeks, MD, MBA • James M. Whedon, DC, MS
Andrew Toler, MS • Christine M. Goertz, DC, PhDd
Geisel School of Medicine,
The Dartmouth Institute for Health Policy and Clinical Research,
Lebanon, NH.

Objective: The purposes of this study were to examine the direct costs associated with Medicare's 2005-2007 "Demonstration of Expanded Coverage of Chiropractic Services" (Demonstration) and their drivers, to explore practice pattern variation during the Demonstration, and to describe scenarios of cost implications had provider behavior and benefit coverage been different.
Methods: Using Medicare Part B data from April 1, 2005, and March 31, 2007, and 2004 Rural Urban Continuum Codes, we conducted a retrospective analysis of traditionally reimbursed and expanded chiropractic services provided to patients aged 65 to 99 years who had a neuromusculoskeletal condition. We compared chiropractic care costs, supply, and utilization patterns for the 2-year periods before, during, and after the Demonstration for 5 Chicago area counties that participated in the Demonstration to those for 6 other county aggregations-urban or rural counties that participated in the Demonstration; were designated comparison counties during the Demonstration; or were neither participating nor comparison counties during the Demonstration.
Results: When compared with other groups, doctors of chiropractic in 1 region (Chicago area counties) billed more aggressively for expanded services and were reimbursed significantly more for traditionally reimbursed chiropractic services provided before, during, and after the Demonstration. Costs would have been substantially lower had doctors of chiropractic in this 1 region had responded similarly to those in other demonstration counties.
Conclusion: We found widespread geographic variation in practice behavior and patterns. Our findings suggest that Medicare might reduce the risk of accelerated costs associated with the introduction of a new benefit by applying appropriate limits to the frequency of use and overall costs of those benefits, particularly in highly competitive markets.
Keywords: Chiropractic; Costs and Cost Analysis; Health Care Economics and Organizations; Insurance Coverage; Legislation as Topic; Medicare; Physician's Practice Patterns.
From the FULL TEXT Article:
Background
Spinal pain is increasingly frequent in older US adults, and its treatment is costly. A recent study of Medicare beneficiaries found an “epidemic” rise in the frequency of the most common type of low back pain (nonspecific low back pain) accompanied by dramatic increases in health care charges. [1] Up to 96% of complaints of chronic low back pain in older adults can be managed nonsurgically. [2] Hence, there is a pressing need to identify and use appropriate, cost-effective, and conservative treatments wherever feasible. [1]
Chiropractic physicians are licensed health professionals who typically provide treatment for conditions that cause spinal pain. [3] Randomized controlled clinical trials have demonstrated that spinal manipulation, as performed by doctors of chiropractic (DCs), is an effective, conservative treatment option for certain types of low back and neck pain and for some headaches. [4-6]
Several clinical trials also support the effectiveness of combined chiropractic therapies (spinal manipulation plus other chiropractic treatments). [7, 8] The American College of Physicians and the American Pain Society [9] as well as the Task Force of Neck Pain and its Associated Disorders [10] recommend spinal manipulation for the treatment of certain spinal pain conditions, and the American Geriatric Society has found chiropractic care to be an appropriate method for managing chronic back pain in older adults. [11]
Finally, several reports suggest that patients who used chiropractic for back and neck problems have lower annual per-capita spine specific and total health care costs. [12-14]
Chiropractic Under Medicare and the Demonstration Project
In 1972, Congress mandated chiropractic care coverage as a Medicare benefit but limited that coverage to “treatment by means of manual manipulation of the spine,” [15] a limitation that remains in place today. However, all states allow a broader scope of chiropractic practice, and many mandate coverage for a spectrum of chiropractic services. These include evaluation and management (E&M); physical medicine; and rehabilitation modalities and procedures, imaging, and some laboratory services. [16] Thus, DCs provide a number of services beyond spinal manipulation. [17] Medicare-reimbursed chiropractic care has increased considerably over the last 2 decades, although it slowed with the recent recession. [18, 19] That chiropractic care users concurrently seek traditional medical care for treatment of back pain [20] suggests that a new coordinating role for DCs might achieve overall efficiencies in health services utilization. [2]
Efforts by the chiropractic profession led Congress to fund a demonstration project designed to examine the cost impact of expanding Medicare funding of chiropractic services. The Demonstration of Expanded Coverage of Chiropractic Services Project (Demonstration) was conducted between April 1, 2005, and March 31, 2007. Using a before-after design, Medicare expenditures in counties in 4 demonstration areas were each compared with 2 matched comparison counties for the year before the Demonstration and the 2-year period of the Demonstration itself. The analysis was based on an assumption that expansion of services would be “budget neutral” and that increased chiropractic costs associated with expanded services might be offset with reduced overall medical care services. However, although the Demonstration revealed high levels of patient satisfaction with the expanded services, it showed an increase in costs to Medicare compared with chosen comparison sites: the report estimated that expanded coverage of chiropractic services was associated with a $34.8 million direct increase in the costs of chiropractic services and a $15.2 indirect increase in Medicare costs among chiropractic users in the demonstration counties when compared with comparison counties. The investigators projected that a similar nationwide expansion of chiropractic services would cost Medicare between $582 million and $1.15 billion annually. [23]
There are 2 reasons to reassess these findings. First, Demonstration counties in Chicago and its suburbs accounted for $49 million of the $50 million total increase in Medicare Part B expenditures; [23] therefore, we wanted to explore geographic variation in chiropractic practice patterns during the Demonstration period.
Second, the Demonstration expanded reimbursement for a very broad range of services provided by DCs. Because policymakers might reasonably limit Medicare coverage to a narrower range of services, we wanted to examine the effects of limiting coverage options on total cost increases.
Therefore, the purposes of this study were to examine the direct costs associated with Medicare's 2005-2007 Demonstration Project and their drivers, to explore practice pattern variation during the Demonstration, and to describe counterfactual scenarios of cost implications had provider behavior and benefit coverage been different.
Methods
We used serial cross-sectional analyses of Medicare administrative data that were acquired and analyzed under a data use agreement with the Centers for Medicare and Medicaid Services (DUA 22653). We restricted our analysis to Medicare beneficiaries who were 65 to 99 years old on January 1 of each study year and who were eligible to obtain chiropractic services by virtue of being enrolled in Medicare Part B for at least 1 month during each study year. Because chiropractic services are reimbursed through Medicare Part B, we limited our analysis of direct costs to Medicare Part B expenditures.
To develop an aggregated analytic file containing information on beneficiary and provider demographics and Medicare Part B claims, we merged data from multiple files using unique beneficiary and provider identifiers. We examined only claims originating in the 50 US states and the District of Columbia, and we excluded un-allowed and duplicate claims. We aggregated Medicare claims data into 3 periods: a pre-demo period that included the 2 years before the Demonstration (and encompassed April 1, 2003, to March 31, 2005), a demo period that included the 2 years during the Demonstration (April 1, 2005, to March 31, 2007), and a post-demo period that included the 2 years after the Demonstration (April 1, 2007 to March 31, 2009).
During the demo period, for chiropractic services (defined as Medicare bills that had a provider code of 35), we examined Medicare's 100% sample of claims in demonstration and matched comparison sites. For all other claims in the demo period and for all claims in the pre-demo and post-demo periods, we analyzed a 20% representative sample of claims. To generate 100% estimates from the representative sample, we multiplied results by 5. We considered DCs who billed at least $1 for any Medicare reimbursed chiropractic service to be “Medicare-active.”
Because the Demonstration limited expanded reimbursement to care for patients with a neuromusculoskeletal (NMS) condition, we restricted the study population to Medicare beneficiaries with at least 1 primary diagnosis for an NMS condition (see Appendix I for a list of diagnoses that constitute those conditions—these represent conditions for which expanded services billing were allowed, and do not represent the full complement of NMS conditions). We defined “chiropractic users” as patients who generated more than $1 in reimbursed Medicare bills in a given study year that were provided by a DC. We used 2004 Rural-Urban Continuum Codes (RUCCs) [24] to determine county level urban or rural status. Similar to the methods used in the Demonstration, we categorized all RUCCs of 1 or 2 (counties in a metro area of >250,000 people) as urban and all others (counties in metro areas of <250,000 people or counties in non-metro areas) as rural.
We calculated Medicare Part B expenditures per capita in the county for traditionally reimbursed chiropractic services and chiropractic services that were expanded under the Demonstration. To calculate the supply of DCs who were active in Medicare in a geographic area, we summed the number of unique provider identification numbers who were reimbursed for a chiropractic claim during each period; we divided that by the number of chiropractic users to calculate the supply of DCs per chiropractic user. Finally, we aggregated Current Procedural Terminology codes for expanded chiropractic services to the following categories: extraspinal manipulation, evaluation and management, passive non-manipulative therapies, active non-manipulative therapies, x-rays, and testing (see Appendix II).
For analytic purposes, we grouped patients into 7 groups by US counties:
Patients who obtained chiropractic services in Chicago area demonstration counties (Chicago area demonstration counties), consisting of Cook, DuPage, Kane, Lake, and Will counties. These 5 counties are the same that were described as Chicago area counties in the final report of the Demonstration. [23] All Chicago area counties were in urban RUCCs.
Patients who obtained chiropractic services in urban demonstration counties outside the Chicago area demonstration counties (urban non-Chicago demonstration counties).
Patients who obtained chiropractic services in rural demonstration counties outside the Chicago area demonstration counties (rural non-Chicago demonstration counties).
Patients who obtained chiropractic services in urban matched comparison counties (urban comparison counties).
Patients who obtained chiropractic services in rural matched comparison counties (rural comparison counties).
Patients who obtained chiropractic services in urban US counties that were neither demonstration nor matched comparison counties.
Patients who obtained chiropractic services in rural US counties that were neither demonstration nor matched comparison counties.
We used small area analysis techniques [25] to generate descriptive statistics by county type and demonstration period. To compare results for Chicago area demonstration counties to those of other county groups, we used analysis of variance and independent t test analysis, weighted by the population of chiropractic care users during the relevant time frame and using robust SEs. Finally, we generated counterfactual estimates of what costs of expanded coverage might have been under different scenarios. We obtained permission from Dartmouth's Institutional Review Board (CPHS no. 23113) to conduct the study, and we used SAS (SAS Institute, Inc, Cary, NC) to perform the analyses.
Results
Variations in Patient Population Sizes, Number and Density of DCs,
and Annual Medicare Part B Expenditures per Beneficiary for Both
Traditionally Reimbursed and Expanded Chiropractic Services

Table 1 During the Demonstration, Chicago area demonstration counties accounted for 38% of all beneficiaries in demonstration counties who had an NMS condition and who generated at least $1 in reimbursed Medicare bills for chiropractic care (Table 1). Chicago area counties contained 49% of DCs in all demonstration counties who were reimbursed by Medicare for traditionally reimbursed chiropractic services.
The supply of Medicare-active DCs per 1,000 patients with NMS diagnoses in Chicago area counties was approximately 29% higher than in non-Chicago area urban demonstration counties, approximately 16% higher than in urban comparison counties, and approximately 8% higher than in urban counties that were not involved in the demonstration project.
Concentrations of DCs in rural counties were approximately one-half that in Chicago area demonstration counties. In Chicago area counties, mean annual traditionally reimbursed chiropractic services per patient during the demo period were 21%, 18%, and 24% higher than in urban non-Chicago area demonstration counties, comparison counties, and other US counties, respectively; they were 40%, 37%, and 53% higher than those for rural so-designated counties, respectively (P < .001 for all).
In Chicago area counties, mean annual expenditures for expanded chiropractic services per patient were approximately three and one-half times that in other urban or rural demonstration counties (P < .001).
Variations in Per-Beneficiary Medicare Reimbursements for
Traditionally Reimbursed and Expanded Chiropractic Services
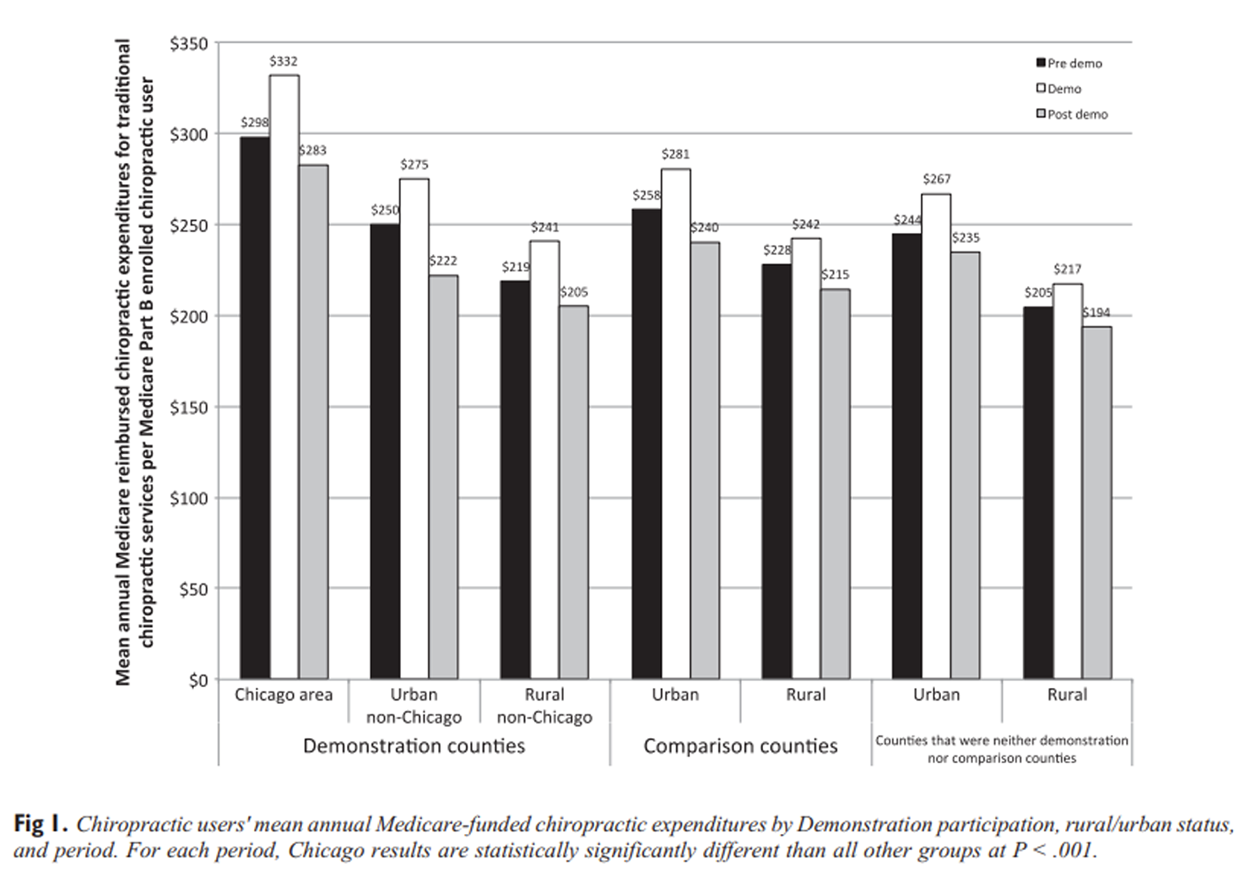
Figure 1 Mean annual expenditures for traditionally reimbursed chiropractic services for patients with a specified NMS diagnosis, who were Medicare Part B enrollees, and who used at least $1 of Medicare Part B reimbursed chiropractic services before, during, and after the Demonstration varied substantially across time and geography (Figure 1). Chicago area demonstration counties had substantially higher pre-demo annual mean chiropractic user costs ($298) than all comparison groups ($250 for urban non-Chicago area demonstration counties, $219 for rural non-Chicago area demonstration counties, $258 for urban comparison counties, $228 for rural comparison counties, and $244 and $205 for urban and rural counties that were neither demonstration nor comparison counties, respectively) (P < .001).
All groups showed substantial increases in expenditures for traditionally reimbursed chiropractic services when comparing the demo to the pre-demo period, ranging from 6.2% for rural comparison counties and rural counties not involved in the demonstration project to 11.3% in Chicago area counties. During the demo period, Medicare spending on chiropractic users for traditional chiropractic services increased for all county types, and after the demo period, that spending fell to below pre-demo levels; nonetheless, in every period, Chicago area Demonstration counties had statistically significantly higher per chiropractic user reimbursement (P < .001).
Table 2 Table 2 shows substantial variation in types, patterns, and costs of expanded services used and related total and per person expenditures in Chicago area vs all non-Chicago area demonstration counties (including both rural and urban non-Chicago area demonstration counties).
In Chicago area counties, a much larger proportion of chiropractic expenditures were for active therapies than in non-Chicago area counties (37% vs 16%). Although expenditures per patient were higher in Chicago area counties for most types of expanded services, differences were particularly great for passive therapies ($267 vs $76 per patient) and active therapies ($230 vs $28 per patient).
Similarly, we found differences in billing practices within a category; for instance, Chicago area DCs were about twice as likely to bill for longer length E&M codes (99204–05 and 99214–15) than those outside the Chicago area (relative risk ratio for new patient E&M codes, 1.81 [95% confidence interval, 1.70-1.92], and relative risk ratio for established patient E&M codes, 1.83 [95% confidence interval, 1.74-1.93]).
Alternative Direct Cost Estimates for Expanded Coverage Scenarios
We generated counterfactual estimates of the direct costs of expanded coverage for chiropractic services under different scenarios. First, we excluded the Chicago effect by estimating incremental Medicare Part B costs of expanded coverage had the rates and types of utilization of expanded services been similar to those observed in non-Chicago demonstration counties. Then, we examined the sequential and additive financial impacts had expanded chiropractic services not included extraspinal manipulation, passive therapies, and active therapies. Finally, we estimated costs should all of those conditions been in place, and reimbursement for only evaluation and management codes had been allowed.
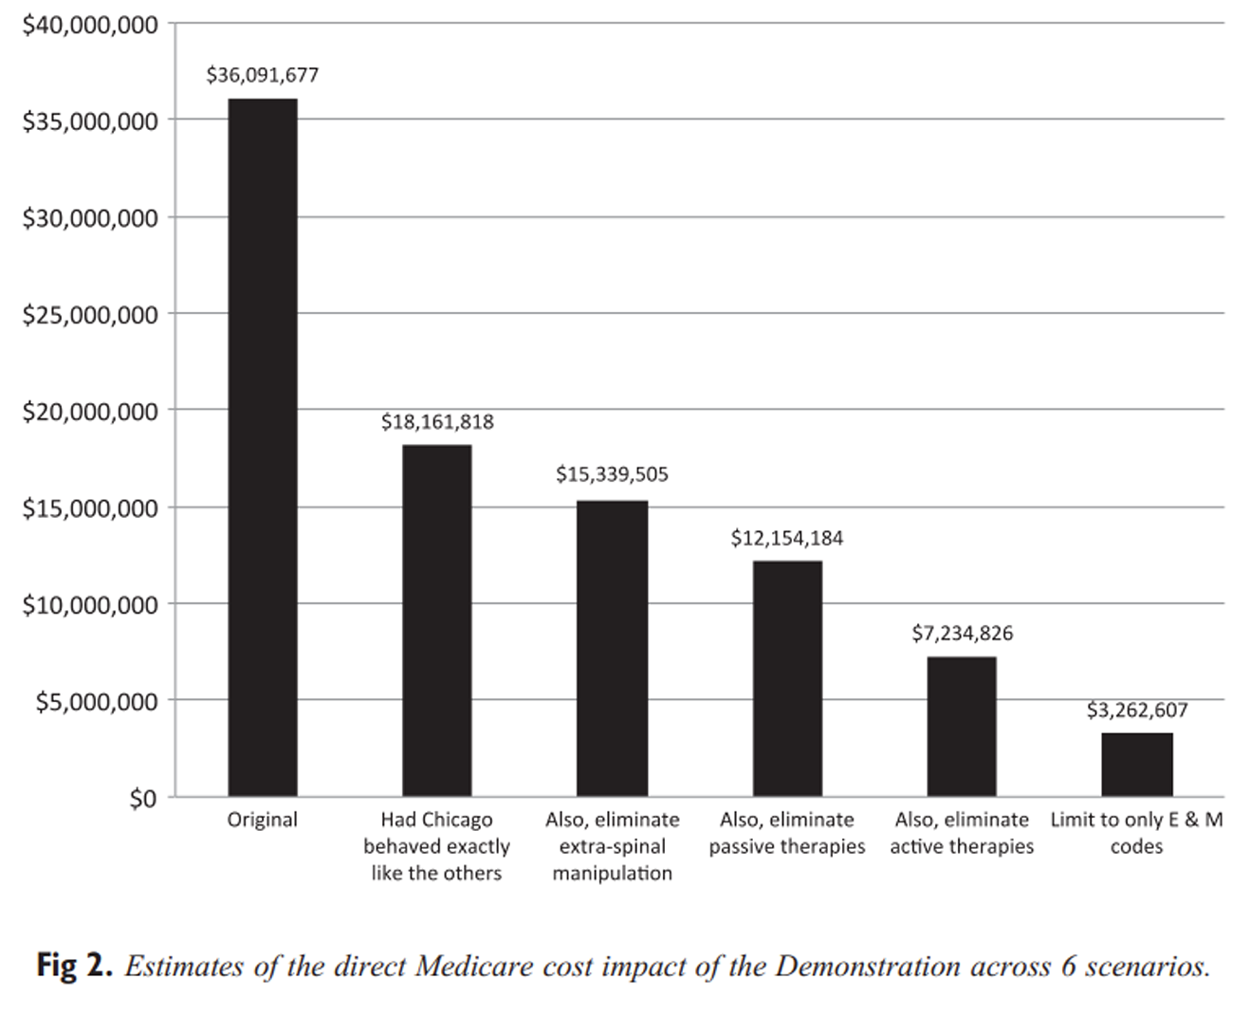
Figure 2 Had rates of utilization and costs of expanded services in Chicago area demonstration counties been similar to those observed in non-Chicago demonstration counties, overall expenditures for expanded coverage during the Demonstration would have been reduced by 50%, from $36.1 million to $18.1 million (Figure 2). Had extraspinal manipulation not been included in the Medicare benefit, cumulative direct costs would have been lowered by an additional $2.8 million (an 8% reduction from the original $36.1 million estimate); had passive therapies also not been included, cumulative direct costs would have been lowered an additional $3.2 million (a 9% reduction); and had active therapies also not been included, cumulative direct costs would have been lowered an additional $4.9 million (a 14% reduction).
In addition, had only E&M codes been allowed, cumulative direct costs would have been $3.9 million (11%) less. The combined effect of eliminating the Chicago area DCs' relatively aggressive billing practices and limiting reimbursement to only evaluation and management codes would have reduced the total direct costs of the demonstration from $36.1 million to $3.3 million, a 90% reduction.
Discussion
We examined the response from DCs to an expanded Medicare benefit and found widespread geographic variation in practice behavior and patterns. In particular, DCs in Chicago area demonstration counties had much more aggressive underlying Medicare billing practices than those in other rural or urban demonstration and non-demonstration counties before, during, and after the Demonstration; furthermore, they responded to the Demonstration by billing more aggressively than did those in other demonstration counties. Had the Chicago area's rate of use of expanded services approximated that of the other demonstration counties, direct Medicare Part B costs of the Demonstration might have been substantially lower. In addition, restricting the expansion to fewer reimbursable therapeutic or evaluative codes might have further reduced the direct impact of the Demonstration.
In light of what appears to be a relatively mature market for complementary and alternative medicine during the period examined, [18] our findings suggest that Chicago's rapid uptake of expanded services billing, coupled with a high underlying rate of chiropractic care billing among Medicare enrollees and a relatively high density of Medicare-billing DCs, all converged to make Chicago area chiropractic care atypical of that for the country during the Demonstration, and although DCs in Chicago area counties showed the same decline in billing during the post-demo period, the declines were not as proportionally dramatic as those seen in other urban demonstration and comparison counties.
Furthermore, in the post-demo period, Chicago area DCs continued to be reimbursed at least 17% more per patient by Medicare than DCs in other urban counties.
Our study findings are directly relevant to issues raised in the 2014 Medicare Physician Payment Schedule Proposed Rule published in the Federal Register (July 8, 2013) regarding a potential policy change that would allow the Centers for Medicare and Medicaid Services to reimburse DCs for E&M services. [26] Specifically, the Department of Health and Human Services seeks guidance regarding the appropriateness and logistical issues surrounding such a policy change. Our counterfactual analysis suggests such a change should generate relatively modest increases in Medicare costs and that appropriate limits placed on the use of existing E&M codes may help to ensure proper billing and use of services, particularly in competitive areas. [27] More generally, this analysis suggests that regulating the relative use of particular benefits, capitating the overall per user reimbursement, or constraining the benefit to a smaller number of services are likely to reduce Medicare's exposure to costs associated with introducing a new benefit.
Limitations
Our analysis has several limitations. First, we were unable to copy exactly the methods used in the original analysis of the Demonstration. That evaluation was able to use direct bills submitted to Medicare by DCs who participated in the Demonstration. Because these data were not available to us, we used the closest possible approximation by identifying bills for expanded services and provider type from Medicare's billing data.
As a result, our estimate of the total direct Medicare Part B costs of the Demonstration was approximately 3.7% higher than that of the original study. Nonetheless, our results are internally consistent and replicable.
Second, our counterfactual analysis uses estimates of behavior changes following identified policy constraints. It is possible, if not likely, that DCs might substitute other services had the ones we identified for elimination not been reimbursed.
Third, we concentrated our analysis on the direct effects of expanded coverage under the Demonstration. A recent study suggested a possible cost-offset associated with use of chiropractic for back and neck problems. [14] More study is required to determine whether a cost-offset effect might be associated with use of chiropractic care for particular conditions.
Despite these limitations, our findings suggest that restriction of expanded coverage to a reduced range of services would have reduced direct cost impacts. For example, limiting expansion to reimbursement for E&M services might have reduced the direct cost impact by 90%. Policymakers might consider implementing a narrower expansion of chiropractic services than those examined under the Demonstration.
Conclusion
We found widespread geographic variation in practice behavior and patterns. Chicago area DCs billed more aggressively for expanded services during the Medicare Demonstration Project. Costs would have been substantially lower had DCs in Chicago area counties responded similarly to those in other demonstration counties. These findings suggest that local environmental factors, such as existing practice and billing patterns, competitiveness, and supply of providers will impact total costs. These local factors will make generating national estimates difficult. Our findings also suggest that Medicare might reduce the risk of accelerated costs associated with the introduction of a new benefit by applying appropriate limits to the frequency of use and overall costs of those benefits, particularly in highly competitive markets.
Practical Applications
Between 2005 and 2007, Medicare conducted a demonstration project that expanded coverage for chiropractic services in certain US counties; analysis of the project found that $35 million in direct costs was attributed to that expansion and those costs were used to project estimates of national expansion of services.
Our examination of Medicare data revealed that Chicago area counties accounted for the large majority of the increased costs. When compared with those in other counties, DCs in Chicago area counties billed Medicare for both traditionally reimbursed and expanded chiropractic services much more aggressively.
The behavior from 1 area (Chicago) distorted findings from the demonstration project; therefore, policymakers should be cautious about using those findings to make national policy.
Supplementary Material
Appensix 1 Codes
Medicare Designated Neuromusculoskeletal Diagnosis (see page 9)
Appensix 2 Codes
Services Currently Covered Under Medicare (see page 13)Contributorship Information
Concept development (provided idea for the research): WBW, CMG, JMW.
Design (planned the methods to generate the results): WBW, CMG, JMW, AT.
Supervision (provided oversight, responsible for organization and implementation, writing of the manuscript): WBW.
Data collection/processing (responsible for experiments, patient management, organization, or reporting data): WBW, JMW, AT.
Analysis/interpretation (responsible for statistical analysis, evaluation, and presentation of the results): WBW, JMW, CMG.
Literature search (performed the literature search): WBW, JMW.
Writing (responsible for writing a substantive part of the manuscript): WBW, JMW, CMG, AT.
Critical review (revised manuscript for intellectual content, this does not relate to spelling and grammar checking): WBW, JMW, CMG, AT.
References:
Weiner, DK, Kim, YS, Bonino, P
Low back pain in older adults:
are we utilizing healthcare resources wisely?
Pain Med. 2006; 7:143-150Weiner, DK, Sakamoto, S, Perera, S
Chronic low back pain in older adults: prevalence, reliability,
and validity of physical examination findings
J Am Geriatr Soc. 2006; 54:11-20Lawrence, DJ, Meeker, W
Chiropractic and CAM Utilization: A Descriptive Review
Chiropractic & Osteopathy 2007 (Jan 22); 15: 2Bronfort, G, Nilsson, N, Haas, M
Non-invasive Physical Treatments for Chronic/Recurrent Headache
Cochrane Database Syst Review 2004; (3): CD001878Gross, A, Miller, J, D'Sylva, J
Manipulation or Mobilisation For Neck Pain: A Cochrane Review
Manual Therapy 2010 (Aug); 15 (4): 315–333Rubinstein, SM, van Middelkoop, M, Assendelft, WJ
Spinal manipulative therapy for chronic low-back pain
Cochrane Database Syst Rev. 2011; 2Bronfort, G, Goldsmith, CH, Nelson, CF
Trunk Exercise Combined with Spinal Manipulative or NSAID Therapy
for Chronic Low Back Pain: A Randomized, Observer-blinded Clinical Trial
J Manipulative Physiol Ther. 1996 (Nov); 19 (9): 570–582Haas, M, Groupp, E, Aickin, M
Dose Response for Chiropractic Care of Chronic Cervicogenic Headache
and Associated Neck Pain: A Randomized Pilot Study
J Manipulative Physiol Ther 2004 (Nov); 27 (9): 547—553Chou, R, Qaseem, A, Snow, V
Diagnosis and Treatment of Low Back Pain: A Joint Clinical
Practice Guideline from the American College of Physicians
and the American Pain Society
Annals of Internal Medicine 2007 (Oct 2); 147 (7): 478–491Guzman, J, Haldeman, S, Carroll, LJ
Clinical Practice Implications of the Bone and Joint Decade 2000-2010
Task Force on Neck Pain and Its Associated Disorders:
From Concepts and Findings to Recommendations
Spine (Phila Pa 1976). 2008 (Feb 15); 33 (4 Suppl): S199–S212American Geriatrics Society
The management of chronic pain in older persons:
AGS Panel on Chronic Pain in Older Persons
J Am Geriatr Soc. 1998; 46:635-651Legorreta, AP, Metz, RD, Nelson, CF
Comparative analysis of individuals with and without chiropractic coverage:
patient characteristics, utilization, and costs
Arch Intern Med. 2004; 164:1985-1992Liliedahl, RL, Finch, MD, Axene, DV
Cost of Care for Common Back Pain Conditions Initiated with Chiropractic
Doctor vs Medical Doctor/Doctor of Osteopathy as First Physician:
Experience of One Tennessee-Based General Health Insurer
J Manipulative Physiol Ther 2010 (Nov); 33 (9): 640–643Martin, BI, Gerkovich, MM, Deyo, RA
The Association of Complementary and Alternative Medicine Use
and Health Care Expenditures for Back and Neck Problems
Medical Care 2012 (Dec); 50 (12): 1029–1036United States Congress
H.R. 1: Social Security Amendments for 1972
US Government Printing Office, Washington, DC, 1972Meeker, WC, Haldeman, S
Chiropractic: A Profession at the Crossroads
of Mainstream and Alternative Medicine
Annals of Internal Medicine 2002 (Feb 5); 136 (3): 216–227Sherman, KJ, Cherkin, DC, Deyo, RA
The diagnosis and treatment of chronic back pain by acupuncturists,
chiropractors, and massage therapists
Clin J Pain. 2006; 22:227-234Davis, MA, Martin, BI, Coulter, ID
US Spending on Complementary and Alternative Medicine During
2002-08 Plateaued, Suggesting Role in Reformed Health System
Health Affairs 2013 (Jan); 32 (1): 45–52Whedon, JM, Davis, MA
Medicare part B claims for chiropractic spinal manipulation,
1998 to 2004
J Manipulative Physiol Ther. 2010; 33:558-561Weigel, PA, Hockenberry, JM, Bentler, SE
Chiropractic Episodes and the Co-occurrence of
Chiropractic and Health Services Use Among
Older Medicare Beneficiaries
J Manipulative Physiol Ther 2012 (Mar); 35 (3): 168-175Davis, MA, Mackenzie, TA, Coulter, ID
The United States Chiropractic Workforce:
An Alternative or Complement to Primary Care?
Chiropractic & Manual Therapies 2012 (Nov 21); 20: 35Davis, MA, Whedon, JM, Weeks, WB
Complementary and alternative medicine practitioners and
Accountable Care Organizations:
the train is leaving the station
J Altern Complement Med. 2011; 17:669-674Stason, WB, Ritter, G, Shepard, DS
Final Report Evaluation of the Demonstration of Expanded
Coverage of Chiropractic Services under Medicare
Brandeis University, Waltham, MA, 2010Rural–urban Continuum Codes (updated 7/29/2004).
2004. (Accessed April 4, 2013, at
http://www.ers.usda.gov/data-products/rural-urban-
continuum-codes.aspx-.UVymDatAShQ).Paul-Shaheen, P, Williams, D, Clark, J
Small area analysis: a review and analysis of the North American literature
J Health Polit Policy Law. 1987; 12:741-809Department of Health and Human Services
Medicare Program; revisions to payment policies under the
Physician Fee Schedule, Clinical Laboratory Fee Schedule
& Other Revisions to Part B for CY 2014
Department of Health and Human Services (Editor) Centers for Medicare and Medicaid Services,
Baltimore, MD, 2013; 220-223
http://www.gpo.gov/fdsys/pkg/FR-2013-07-19/pdf/2013-16547.pdfWhedon, JM, Song, Y, Davis, MA
Use of Chiropractic Spinal Manipulation in Older Adults
is Strongly Correlated with Supply
Spine (Phila Pa 1976). 2012 (Sep 15); 37 (20): 1771–1777
Return to MEDICARE
Since 9-22-2025


| Home Page | Visit Our Sponsors | Become a Sponsor |
Please read our DISCLAIMER |