What is Thermography?
Thermography is a means of measuring the heat (thermo) coming from a body. The science of Thermography is the application of these heat readings to locate abnormal pathology or function in the body.
It is reputed that Socrates used to put wet mud on his clients and looked to see where it dried first, to look for inflammation in the body. Early in the history of Chiropractic, doctors would use the back of their hands to locate “hot boxes”, or for locations of decreased heat along the spine.
In the 1930's, a chiropractic patient named Dossa Evans, who was an electrical engineer, asked his chiropractor if he'd be interested in a device to measure the temperature changes along the spine. His first instrument was named the Neurocalometer or the NCM.
This device was used to compare the temperature on
both sides of the spine. If one side were colder than the other was, the needle would jump towards that side. Later, a graphing mechanism was attached to record those readings.
This lead to the documentation of those heat assymetries, and a system called “pattern analysis”. The doctor can take a series of “graphs” on the first visit. I take one before I examine a new patient, a second one after the exam, and occasionally a third one, just before the patient receives their first adjustment.
We expect a “normal graph” to look different each time, since it is only a momentary “snapshot” of skin temperature. When a cold spot(s) remains at the same spinal level through a series of graphs, we define that as an abnormal “pattern”...suggesting that the body's thermostat is stuck...and this is one indication of spinal subluxation.
Today there are more sophisticated, computer assisted instruments which take those readings, by
measuring the infrared heat that radiates from our skin. Clinically, we know that your head should be about one degree warmer than your low back region. So a normal graph should slowly warm as you move from the tailbone to the back of the head.
We also compare the temperature from one side of the body to the other. We know that you have
essentially the same blood supply to identical body parts (such as your right and left
thumb), so the temperature should be virtually identical on both sides. A variance of more than 0.3° (three-tenths of one degree) is clinically significant [ 1 ]. (Uematsu 1988)
The brain controls all body functions, either through “hard wiring” (our nerves) or indirectly through release of hormones and neuro-transmitters. When there is interference in
the nervous system from what we call a subluxation, the brain changes the way the
body operates.
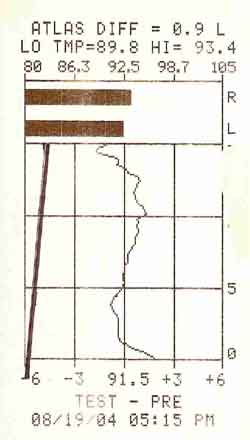
I use an infrared measuring device, called the "Derma-Thermograph (aka the DT-25) to help
me with chiropractic analysis. A graph is taken at the beginning of each visit.
|