

Exercise and Nutrition Effects on Body Composition
and Blood Measures in Overweight Adults
and Blood Measures in Overweight Adults
Send all comments or additions to: Frankp@chiro.org


FROM: Journal of Exercise Physiologyonline 2017 (Feb); 20 (1): 200–220 ~ FULL TEXT
Wayne Westcott, Amanda Colligan, Kim Puhala, Kelly Lannutti,
Rita La Rosa Loud, Samantha Vallier
Department of Natural and Health Sciences,
Quincy College,
Quincy, MA
Why was this study done?
Most people think that losing weight can be accomplished through reduction of calories. This approach to weight loss is common, but typically fails to result in successful weight loss. Much of the reason for this failure is the loss of lean body mass that occurs with calorie restriction.
This study was undertaken using a structured meal plan along with exercise to discover what effects such a plan has on body composition and other measurements of health.
What This Study Found
In the longest and largest study of its kind, this study discovered that a combination of exercise and a specific structured meal program was more effective than exercise alone at producing positive effects on body composition (reduction of fat mass, maintenance of lean body mass). Those who participated in an exercise plus meal program achieved clinically meaningful weight and fat loss – while not losing lean body mass.
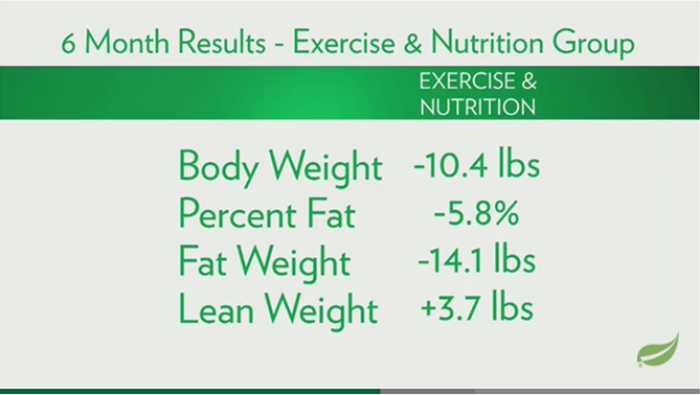
Participants of the exercise program who did not receive the added nutritional support (the control group) typically lost 3.5 pounds of lean body muscle mass during the trial period. The active participants in this study (exercise plus a structured meal plan) gained 3.7 pounds of lean body mass, and experienced significant improvements in blood pressure and hemoglobin A1c during the same trial period.
This study compared the effects of an exercise only (EO) program with an exercise and nutrition (EN) program on body composition, body contour, and blood measures in overweight adults. The exercise program included 20 min each of resistance and aerobic training. The nutrition program required 1,200 to 1,800 kcal and 2 daily protein-rich meal replacement shakes or bars. Group 1 (n=38) did EO wks 1-12 and EN wks 13-24. Group 2 (n=37) did EN wks 1-24. [NOTE: n= means “number of participants”] During wks 1-12 Group 2 EN attained greater reductions in body weight, BMI, percent fat, fat weight, waist circumference, and hip circumference than Group 1 EO. During wks 13-24, Group 1 (EN condition) attained greater reductions in body weight, BMI, percent fat, fat weight, waist circumference, and hip circumference than during wks 1-12 (EO condition). During wks 13- 24, Group 2 EN experienced similar improvements as during wks 1- 12 in most assessments. After 24 wks, both groups improved in body weight, BMI, percent fat, fat weight, lean weight, waist circumference, hip circumference waist/hip ratio, systolic blood pressure, diastolic blood pressure, and HbA1c, but Group 2 attained greater reductions in percent fat and fat weight. The findings indicate that EN was more effective than EO for improving body weight, body composition, and body contours, with concurrent fat weight loss and lean weight gain.
Key Words: Weight Loss, Fat Loss, Diet, Exercise
From the FULL TEXT Article:
INTRODUCTION
Approximately 70% of Americans are classified as overweight or obese [13], and approximately 70% of Americans are attempting to lower their body weight by means of reduced calorie diet plans [39]. Excessive body weight is a serious medical condition that is associated with health risk factors such as elevated plasma cholesterol, plasma glucose, and resting blood pressure, which are contributing factors to type 2 diabetes and cardiovascular disease [45]. Unfortunately, dieting has been shown to be essentially ineffective for maintaining long-term weight management [29]. After an extensive review of the weight loss and diet research, Mann and colleagues [29] concluded that dieting does not typically lead to sustained improvements in body weight or health, and that dieters who maintain their weight loss are rare exceptions.
In fact, recent research indicates that physical activity has a stronger association with desirable weight status than diet quality [34]. Several studies [14, 25, 40, 43] have shown that exercise is an effective means for attaining and maintaining a lower body weight. However, a well-designed study of physical activity in the United States found that less than 4% of adults and 3% of older adults exercise at the recommended criteria for intensity (3 Mets), duration (30 min), and frequency (5 d·wk-1) [44].
Aerobic activity is generally recommended for weight reduction due to the relatively high energy expenditure associated with endurance exercise. However, resistance exercise may be at least as effective as aerobic activity for weight loss due to the 5% to 9% increase in daily resting energy expenditure that results from regular strength training [7, 15, 18, 36, 45]. Additionally, muscular fitness appears to be inversely related to excessive body fat [20], and has been shown to reduce metabolic/cardiovascular risk profiles in overweight individuals [38].
Another reason for adults with undesirable body mass index (BMI) to perform resistance exercise is the progressive muscle loss that accompanies inactive aging. On average, sedentary adults lose muscle mass at the rate of 5% per decade before age 50 [12], and up to 10% per decade after age 50 [30, 32]. Muscle loss is associated with resting metabolic rate reduction, which facilitates fat gain [24, 50]. Dieting exacerbates this problem because approximately 25% of the weight loss with typical diet plans is lean tissue, which further reduces resting energy expenditure and increases the likelihood of weight regain [5]. In one study [31], just 2 wks of dieting (60% of normal calorie intake) resulted in a 1.6 kg reduction in lean body mass. Research has demonstrated that resistance training is effective for increasing lean weight and resting metabolic rate, as well as for decreasing fat weight [7, 19, 36, 49]. To increase the likelihood of concurrent fat weight loss and lean weight gain, weight reduction programs should include resistance exercise.
Research indicates that muscle gain and fat loss associated with resistance exercise may be enhanced by increased daily protein intake [8, 9, 35, 46], as well as by consuming protein in close time proximity to strength training sessions [3, 10, 16, 22, 48]. In a recent study by Jakeman et al., [21], subjects who substituted a protein supplement for breakfast and lunch (~22 gm of protein for a 68 kg individual) significantly increased lean weight; whereas, control subjects actually decreased lean weight. Therefore, it would seem advisable for sustainable weight management programs to feature diet plans that have higher protein content (especially leucine) and provide 20 or more gm of protein for breakfast, lunch, and pre/post workout snacks [21].
Our previous short-term exercise and nutrition study incorporated moderate calorie restrictions (1,200 to 1,500 kcal·d-1 for women and 1,500 to 1,800 kcal·d-1 for men), which were well-received by the subjects in the study [46]. These calorie ranges, in conjunction with resistance exercise and higher protein intake, were effective for significantly reducing the subjects’ body weight, BMI, percent fat, fat weight, waist circumference (WC), systolic blood pressure (SBP), and diastolic blood pressure (DBP) while maintaining lean weight.
The findings from a meta-analysis of selected weight loss studies led Mann and colleagues [29] to recommend that future obesity research focus on exercise rather than diets. However, we decided to conduct a longer-term and more comprehensive study of combined exercise and nutrition effects on body composition and blood measures. As in our prior shortterm study, this research program required the subjects to perform strength and endurance training, reduce daily calorie consumption, and increase daily protein intake. The purpose of this study was to compare between-group and within-group effects of an Exercise-Only (EO) condition with an Exercise-Nutrition (EN) condition on body composition, body contours, and blood measures in overweight and obese adults. We hypothesized that the EN condition would elicit significantly greater improvements than the EO condition in body weight, %fat, fat weight, body contours, and blood measures, and that both treatments would produce similar increases in lean weight.
METHODS
Subjects
The present study was approved by the Quincy College Institutional Review Board (IRB) and was conducted in complete compliance with the IRB guidelines. The original plan for the study consisted of 100 otherwise healthy overweight or obese men and women who met the following inclusion criteria: ages between 18 and 75 yrs, BMI between 27 to 40, total blood cholesterol (TBC), less than 240 mg·dL -1, SBP less than 140 mmHg, DBP less than 90 mmHg, and physically capable of performing standard strength and endurance exercise. The exclusion criteria encompassed hypertension, cardiovascular disease, cancer, asthma, glaucoma, thyroid, kidney, liver, and pancreatic disease, statin medications, weight loss medications, smoking more than one pack of cigarettes a day, consuming more than 1 (women) or 2 (men) alcoholic drinks per day, as well as being pregnant or breastfeeding.
In response to two regional newspaper articles, 185 overweight/obese adults attended the study orientation meeting. Ninety-five of the potential subjects were eliminated based on the study exclusion criteria. The 90 remaining men and women were randomized by BMI into two treatment groups. During the first 12-wk training period, Group 1 followed the EO program and Group 2 followed the EN program in parallel design. During the second 12-wk period Group 1 crossed over from the EO condition to the EN condition; whereas, Group 2 continued the EN condition. During the course of the study, 15 subjects (6 from Group 1 and 9 from Group 2) discontinued the program for the following reasons: medical issue not related to the study - 6; work schedule change - 5; marriage - 1; personal - 1; did not complete required exercise sessions - 1; did not substitute required meal replacements - 1.

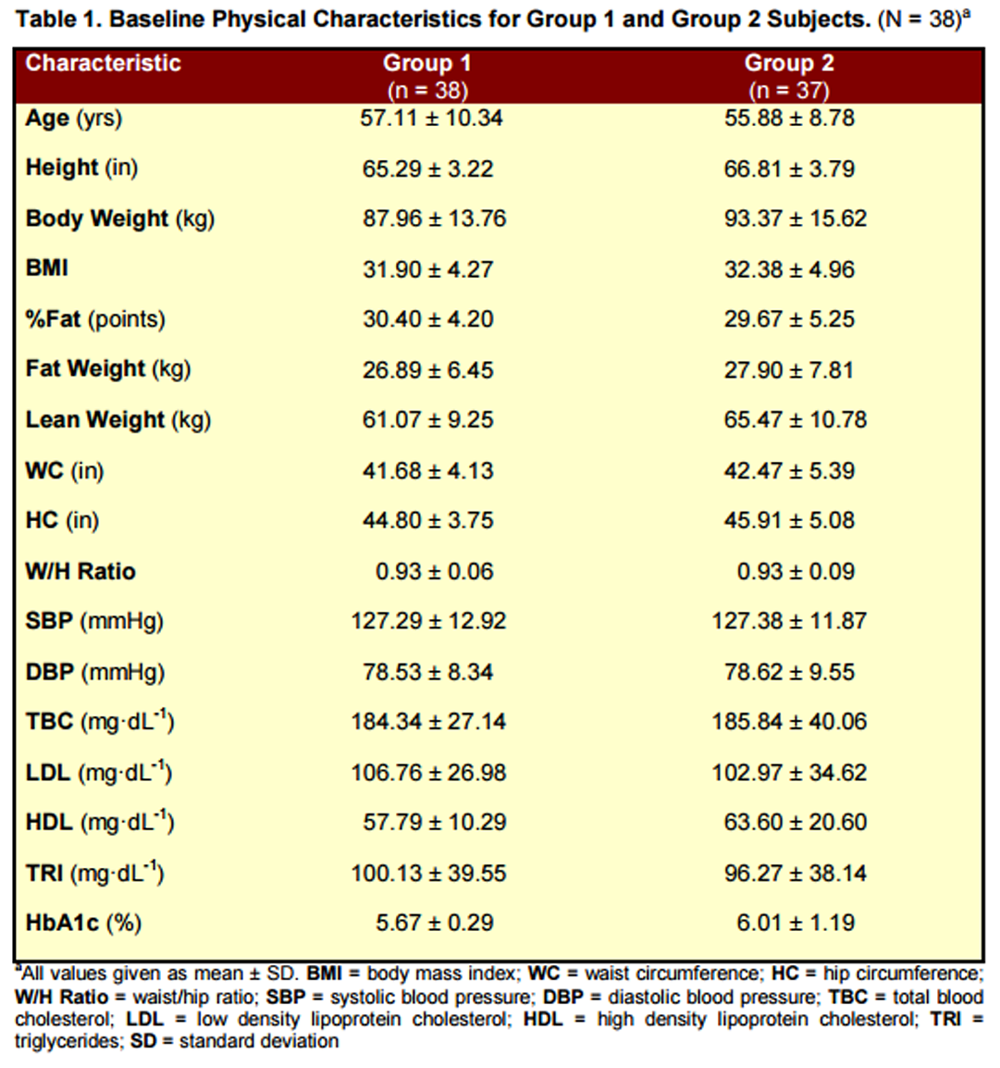
Table 1 Seventy-five men and women between the ages of 23 and 73 yrs completed the 24-wk study and met all of their respective program requirements for exercise (85% of 48 scheduled training sessions), nutrition (reduced calorie diet plan with 2 daily protein-rich meal replacements), and assessments (initial, 12-wk, and 24-wk assessments of body weight, body composition, body contours, resting blood pressure, blood lipids, and HbA1c). Group 1 completers were 34 women and 4 men, 57.1 + 10.3 yrs of age with a mean BMI of 31.9 + 4.3. Group 2 completers were 26 women and 11 men, 55.9 + 8.8 yrs of age, with a mean BMI of 32.4 + 5.0. Initial physical characteristics for both groups are presented in Table 1.
Procedures
All subjects were instructed and closely supervised in the physical activity classes at the college fitness research facility, where they performed strength and endurance exercise in accordance with the American College of Sports Medicine (ACSM) and the American Heart Association (AHA) recommended protocols [17]. Each exercise class consisted of 6 to 8 subjects instructed by two nationally certified fitness professionals. Subjects in the EN condition received personalized monthly supplies of protein-rich meal replacements (shakes, meal bars, and snack bars), and had the option to join periodic conference calls regarding the nutrition program. The EN subjects reported that they consistently substituted the commercial meal replacements for 2 daily meals (typically breakfast and lunch).
Exercise Program
Table 2 The exercise program included ~20 min of resistance machine training and ~20 min of aerobic activity on Monday and Wednesday or Tuesday and Thursday, with make-up days on Friday and Saturday. As presented in Table 2, the subjects performed 1 set of 3 successive leg exercises (leg extension, leg curl, and leg press) followed by 6 to 7 min of aerobic activity (treadmill, cycle, or rower). Then, they would do 1 set of 3 successive upper body exercises (chest press, lat pull down, and shoulder press) followed by 6 to 7 min of aerobic activity (treadmill, cycle, or rower), and then 1 set of 3 successive core exercises (abdominal curl, low-back extension, and torso rotation) followed by 6 to 7 min of aerobic activity (treadmill, cycle, or rower). Each set of resistance exercise was performed with a weight load that could be lifted between 8 to 12 repetitions in a controlled manner (about 3 sec for concentric muscle actions and 3 sec for eccentric muscle actions). Whenever 12 repetitions could be completed with correct technique, the weight load was increased by approximately 5%. Each 6 to 7 min session of aerobic activity was performed in an interval training protocol with 20- sec higher-effort segments alternated with 20-sec lower-effort segments.
Nutrition Program
The nutrition program was based on a reduced-calorie recommendation of 1,200 to 1,800 kcal·d -1 (female subjects typically consumed 1,200 to 1,500 kcal·d-1 while the male subjects typically consumed 1,500 to 1,800 kcal·d-1). In order to attain the recommended calorie consumption with a relatively high protein intake, the subjects substituted 2 protein-rich meal replacements daily (typically breakfast and lunch). The meal replacement shakes contained 260 kcal, 24 gm protein, 36 gm carbohydrate, 3 gm fat, and 6 gm dietary fiber. The meal replacement bars contained 260 kcal, 20 gm protein, 32 gm carbohydrate, 6 gm fat, and 6 gm dietary fiber. The subjects also received a supply of snack bars, (140 kcal, 9 gm protein, 18 gm carbohydrate, 4 gm fat, and 3 gm dietary fiber) and tea options in case they felt hungry between meal times. The nutritional resources were personalized for protein type (whey, soy, or non-soy plant-based blend) and flavor preferences.
Assessments
All subjects were assessed for body weight, BMI, percent fat, fat weight, lean weight, WC, hip circumference (HC), waist/hip ratio (W/H ratio), SBP, DBP, TBC, LDL cholesterol (LDL), HDL cholesterol (HDL), triglycerides (TRI), and HbA1c at the beginning of the study, after 12 wks of training, and after 24 wks of training. The following assessments were taken in a separate fitness testing office by the same experienced and nationally-certified fitness professional: body weight to the nearest 0.2 pound on an electronic scale (Tanita); body composition (percent fat, fat weight, and lean weight) by means of computerized ultrasound technology (Soma-Tech); waist and hip circumference to the nearest 1/16th in; and resting blood pressure by means of a calibrated sphygmomanometer and stethoscope. All of the blood samples were drawn at a local medical facility and assessed for lipid profiles and HbA1c at a local laboratory.
Statistical Analyses
Table 3
Table 4
Table 5
Table 6 All data are presented as means (m) ± standard deviation (SD). Independent samples t-tests were applied to determine statistically significant differences in means between Group 1 and Group 2 in each of the assessment areas. Dependent samples t-tests were performed to compare the 1-12 wk and 13-24 wk within-group changes in each of the assessment areas for both Group 1 and Group 2. The alpha level for statistically significant differences was set as P≤0.05. All data analyses were performed using IBM SPSS Statistics 23 software. Data from the 4 group comparisons were analysed for changes in the following parameters: body weight, BMI, percent fat, fat weight, lean weight, WC, HC, W/H ratio, SBP, DBP, TBC, LDL, HDL, TRI, and HbA1c.
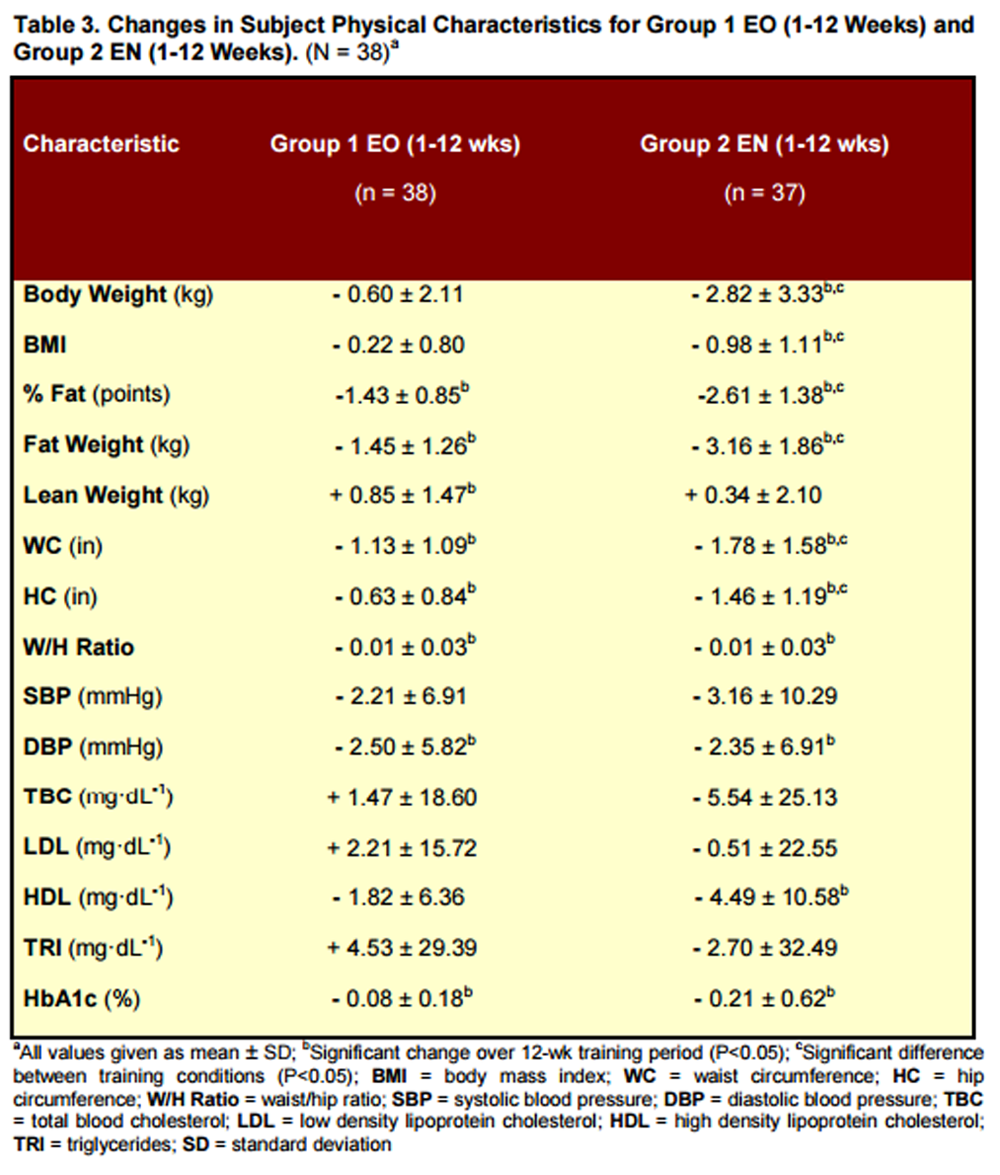
Results for between-group changes for Group 1 EO (1-12 wks) vs. Group 2 EN (1-12 wks) are presented in Table 3.
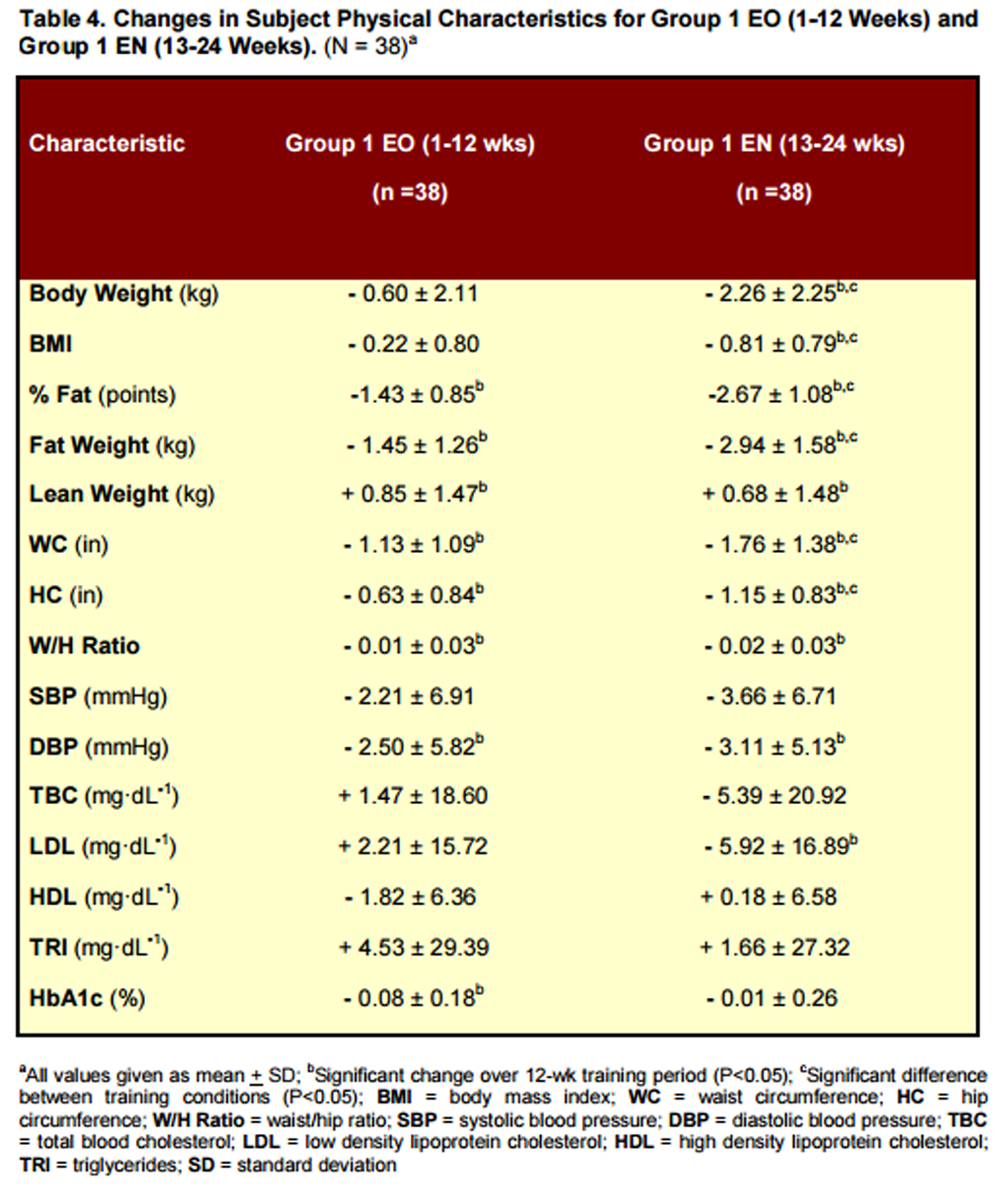
Results for within-group changes for Group 1 EO (1-12 wks) vs. Group 1 EN (13-24 wks) are presented in Table 4.
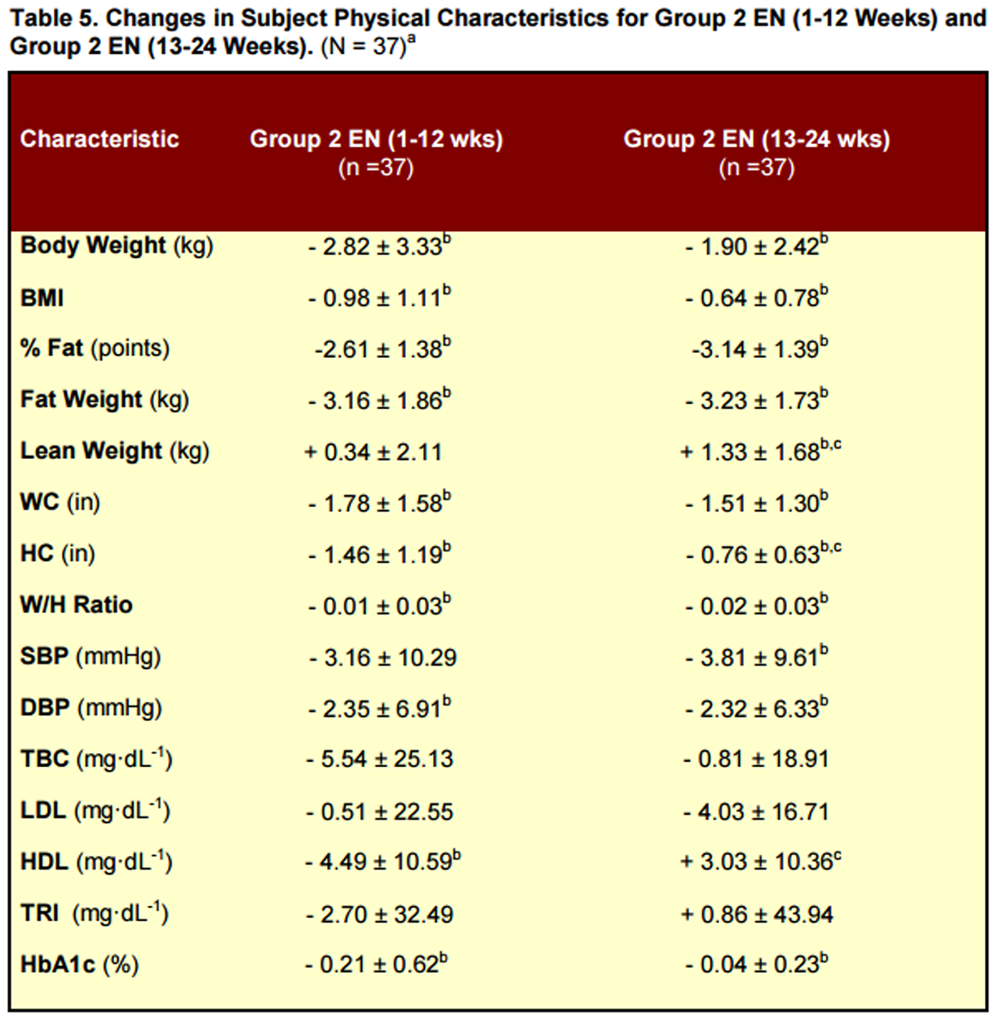
Results for withingroup changes for Group 2 EN (1-12 wks) vs. Group 2 EN (13-24 wks) are presented in Table 5.
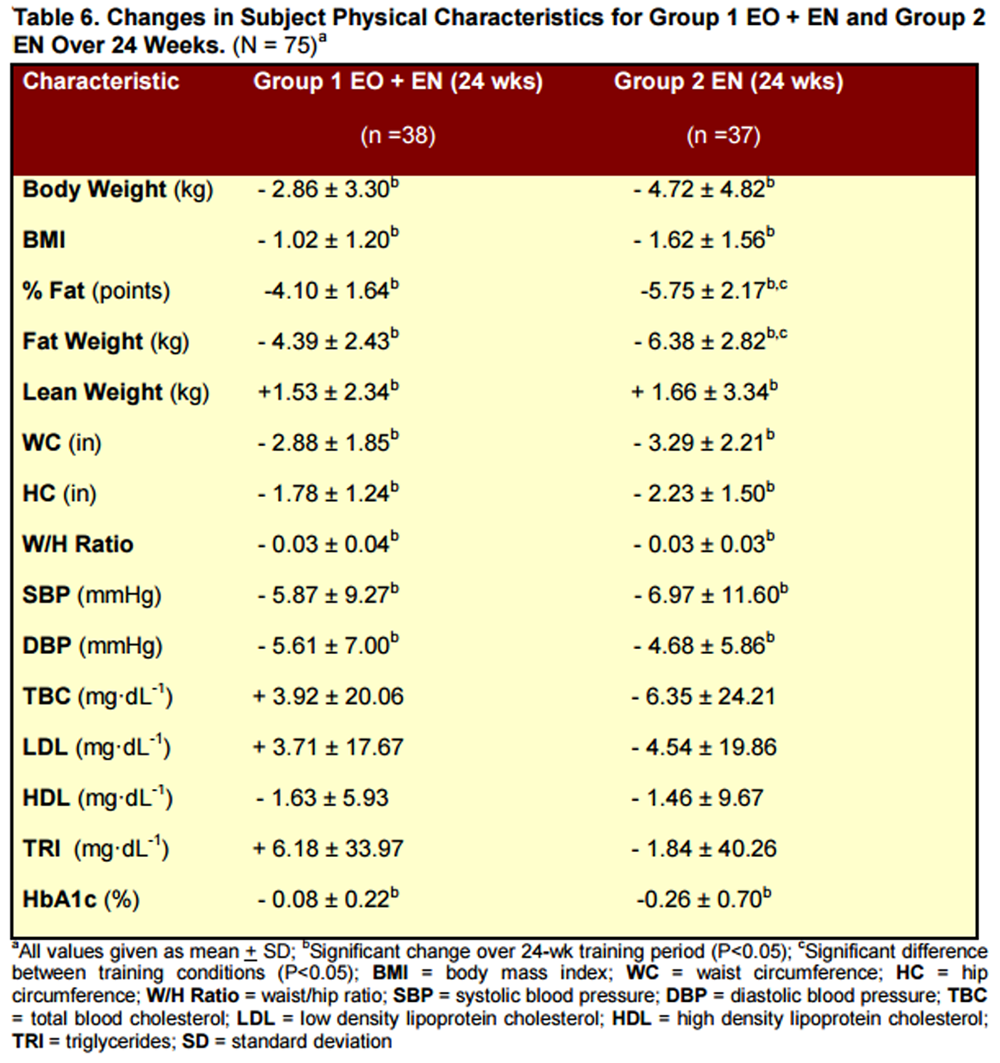
Results for between group changes for Group 1 EO/EN (1-24 wks) vs. Group 2 EN/EN (1-24 wks) are presented in Table 6.
RESULTS
Changes in body weight, BMI, percent fat, fat weight, lean weight, WC, HC, W/H ratio, SBP, DBP, TBC, LDL, HDL, TRI, and HbA1c for the 4 group analyses are presented below and in Tables 3-6.
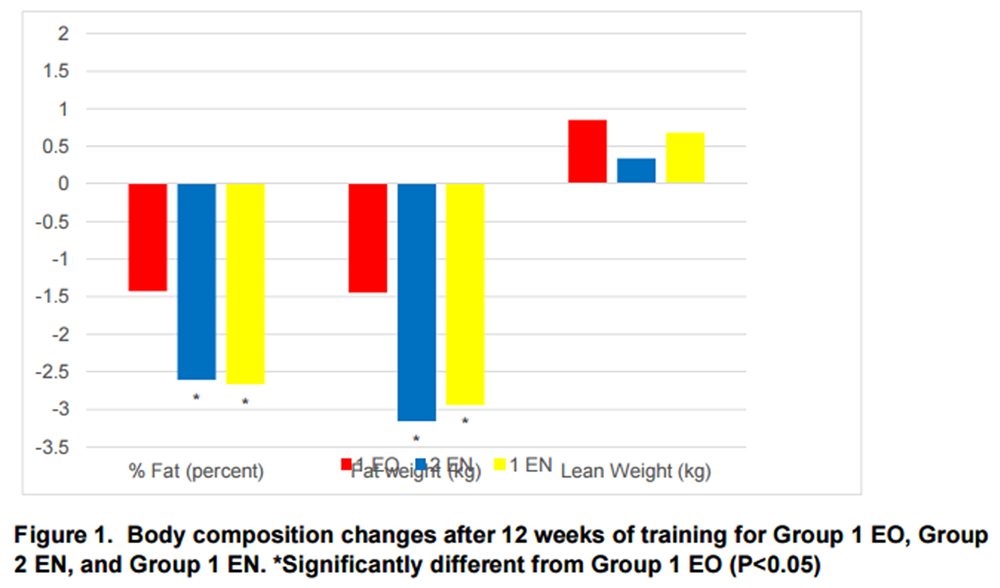
Figure 1 The following results were attained for Group 1 EO and Group 2 EN during the 1-12 wk training period Table 3. Group 2 EN experienced significantly greater changes than Group 1 EO in body weight (- 2.82 kg vs. - 0.60 kg, P = 0.001), BMI (- 0.98 vs. - 0.22, P = 0.001), percent fat (- 2.61 pts vs. - 1.43 pts, P = 0.000), fat weight (- 3.16 kg vs. - 1.45 kg, P = 0.000), WC (-1.78 in vs. -1.13 in, P = 0.041), and HC (- 1.46 in vs. - 0.63 in, P = 0.002). There were no significant differences between Group 1 EO and Group 2 EN in lean weight, W/H ratio, SBP, DPB, TBC, LDL, HDL, TRI, or HbA1c (see Table 3). Body composition changes are illustrated in Figure 1.
The following results were attained for Group 1 EO during the 1-12 wk training period and Group 1 EN during the 13-24 wk training period. Group 1 EN experienced significantly greater changes than Group 1 EO in body weight (- 2.26 kg vs. -0.60 kg, P = 0.001), BMI (- 0.81 vs. - 0.22, P = 0.001), percent fat (- 2.67 pts vs. - 1.43 pts, P = 0.000), fat weight (- 2.94 kg vs. - 1.45 kg, P = 0.000), WC (- 1.76 in vs. - 1.13 in, P = 0.024), and HC (- 1.15 in vs. - 0.63 in, P = 0.007). There were no significant differences between Group 1 EN and Group 1 EO in lean weight, W/H ratio, SBP, DBP, TBC, LDL, HDL, TRI, or HbA1c (see Table 4). Body composition changes are illustrated in Figure 1.
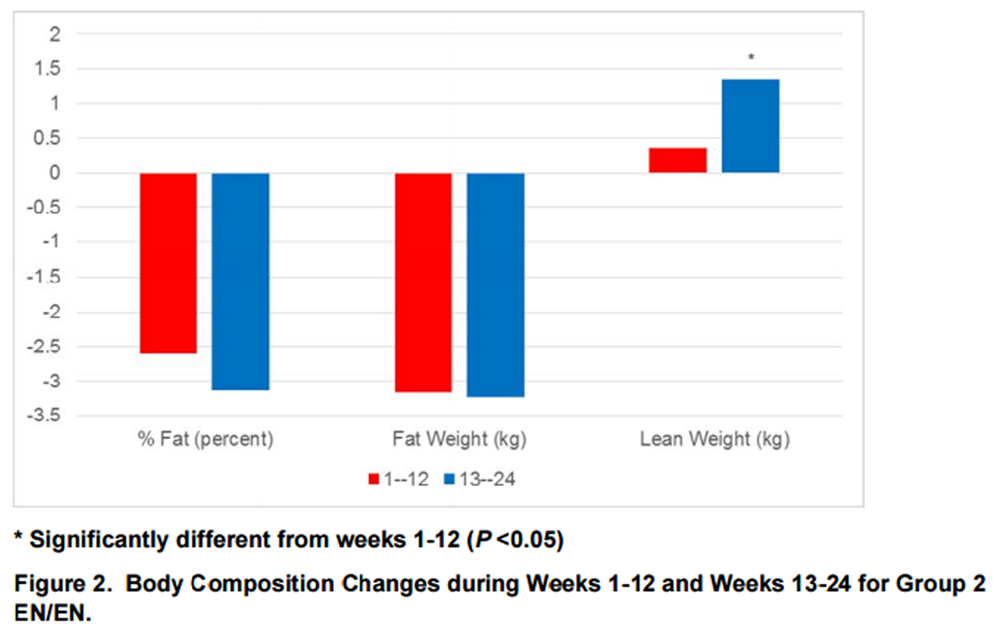
Figure 2 The following results were attained for Group 2 EN during the 1-12-wk training period and Group 2 EN during the 13-24 wk training period. The Group 2 subjects experienced similar changes during the first and second 12-wk training periods in body weight, BMI, percent fat, fat weight, WC, W/H ratio, SBP, DBP, TBC, LDL, TRI, and HbA1c (see Table 5). During the second 12-wk training period Group 2 subjects experienced significantly greater changes than during the first 12-wk training period in lean weight (+ 1.33 kg vs. + 0.34 kg, P = 0.002), and HDL (+ 3.03 mg·dL-1 vs. -4.49 mg·dL-1, P = 0.019), as well as significantly less change in HC (- 0.76 in vs. - 1.46 in, P = 0.001). Body composition changes are illustrated in Figure 2.
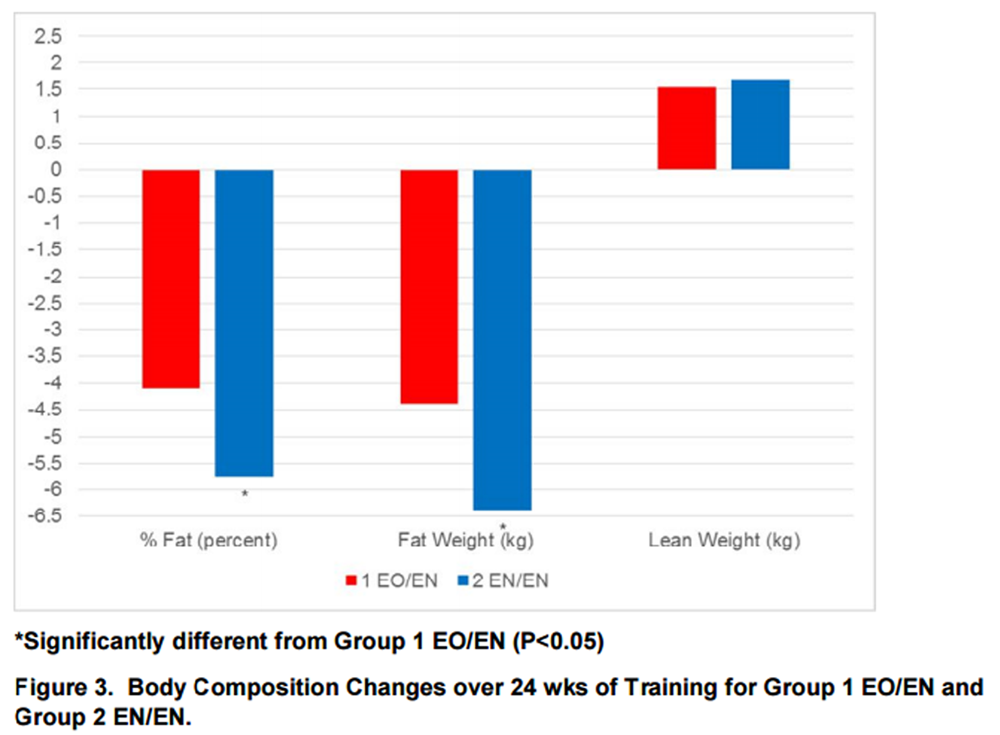
Figure 3 The following results were attained for Group 1 EO/EN and Group 2 EN/EN over the 24-wk training period. As presented in Table 6, both groups experienced significant changes in body weight, BMI, percent fat, fat weight, lean weight, WC, HC, W/H ratio, SBP, DBP, and HbA1c, and non-significant changes in TBC, LDL, HDL and TRI. Group 2 EN/EN experienced significantly greater improvements than Group 1 EO/EN in percent body fat (- 5.75 pts vs. - 4.10 pts, P = 0.000) and fat weight (- 6.38 kg vs. - 4.39 kg, P = 0.002). Body composition changes are illustrated in Figure 3.
DISCUSSION
Our between-group and within-group analyses demonstrated that the 12-wk EN program was more effective than the 12-wk EO program for improving body composition and body contours in overweight/obese adults. These results were consistent with the findings of our previous 10-wk study [46], in which the EN condition elicited significantly greater reductions in body weight, BMI, percent fat, fat weight, and WC than the EO condition. The results of our 10-wk and 12-wk studies also revealed that lean weight gains were statistically similar for both the EN and EO conditions, indicating that weight loss and fat loss may be attained without a concomitant reduction in lean weight.
Our third analysis demonstrated that in all assessment areas, except for HC, the rates of improvement during the first 12 wks of the EN condition were maintained or increased during the second 12 wks of the EN condition. This finding indicates that the results attained in our previous 10-wk study [46] were not limited to a short-term program of diet and exercise. The previous study subjects experienced a mean weekly fat weight loss of 0.32 kg and a mean weekly lean weight gain of 0.08 kg over a 10-wk training period. The present study subjects experienced a mean weekly fat weight loss of 0.27 kg and a mean weekly lean weight gain of 0.07 kg over a 24-wk training period.
Our fourth analysis showed that both Group 1 (12 wks EO and 12 wks EN) and Group 2 (24 wks EN) achieved similar and significant improvements in body weight, BMI, percent fat, fat weight, lean weight, WC, HC, WC/HC ratio, SBP, DBP, and HbA1c. However, Group 2 attained significantly greater reductions in percent fat and fat weight than Group 1, indicating that the full-term combination of exercise and nutrition was more effective for improving these important health factors in overweight/obese adults.
A major finding from our study was the Group 2 subjects’ relatively large improvement in percent body fat (29.51% to 23.75%), which was attained through concurrent fat weight loss (-6.38 kg) and lean weight gain (+1.66 kg). Although consistent with our previous 10-wk study [46], the significant increase in lean weight is atypical for most weight loss programs. Even brief periods of caloric restriction have been shown to significantly reduce lean weight [31]. The concurrent fat weight decrease and lean weight increase observed during this calorierestricted weight loss program was most likely due to resistance training and higher daily protein intake. As in our study, Longland et al. [28] found significant fat weight decrease and lean weight increase with a hypo-energetic diet combined with resistance exercise and higher daily protein intake. Although endurance exercise has been shown to attenuate lean weight loss during dieting [1], it appears that strength training and increased protein intake are key factors for increasing muscle mass under conditions of calorie restriction [26, 37].
Our study included both resistance exercise and aerobic activity, performed in a 40-min circuit-training protocol. According to the American College of Sports Medicine’s position paper on weight loss and regain [2], combined resistance and aerobic training is superior to either exercise modality alone with respect to concurrent fat weight loss and lean weight gain [4, 33]. Based on our subjects’ significant improvements in body composition, the combined training approach appears to be an effective intervention for overweight/obese adults. It is noted that only 1 subject was eliminated from our study for failure to complete the required training sessions.
Several studies have shown that higher protein intake enhances the effects of diet and exercise for reducing fat weight and increasing lean weight [4, 11, 28, 33, 46]. Some studies have demonstrated these effects with post-exercise protein supplementation [10, 11, 16, 22, 47], while other research has shown similar effects with higher non-specific daily protein intake [27, 28, 46]. In our study, subjects substituted relatively high-protein shakes (24 gm protein) and meal bars (20 gm protein) for breakfast and lunch, thereby spreading their protein intake more evenly throughout the day. Research indicates that more equal protein consumption at breakfast, lunch, and dinner may enhance lean weight gain [21].
Our present 24-wk study employed the same recommendation for reduced daily caloric intake as our previous 10-wk study, approximately 1,200-1,500 kcal·d-1 for women, and 1,500-1,800 kcal·d-1 for men. As noted above, the mean weekly fat weight loss and lean weight gain were comparable in both studies. This finding indicates that these dietary guidelines may be effectively maintained by overweight/obese adults over the course of a 6- month exercise and nutrition program, as only 1 subject was eliminated from the study for failure to maintain dietary compliance.
Group 2 subjects performed the EN protocol for the full 24-wk training period. Their mean fat weight loss was similar during the first 12-wk session (-3.16 kg) and the second 12-wk session (-3.23 kg). However, they gained significantly more lean weight during wks 13-24 (+1.33 kg) than during wks 1-12 (+0.34 kg). A possible explanation for the smaller lean weight gain over wks 1-12 may be that this group of overweight/obese adults needed more time for optimal physiological adaption to concurrent lifestyle changes of reduced calorie intake and regular strength/endurance exercise.
Both Group 1 and Group 2 experienced significant reductions in SBP and DBP over the 24- wk training period, and these findings were consistent with those in our previous exercise and nutrition studies [46, 48]. With respect to blood lipids, neither group had significant changes in TBC, LDL, HDL, or TRI levels between wks 1 and 24. These findings are in agreement with those reported in a 2016 study that examined the effects of resistance training on metabolic syndrome [41]. However, our results differed from a research review by Kelley and Kelley that found resistance exercise was associated with modest improvements in blood lipids, except for HDL [23]. A possible explanation for our non-significant blood lipid changes may be that both training groups began the study with excellent blood lipid profiles.
One of the most serious medical issues associated with obesity is type 2 diabetes, which is predicted to affect 1 in 3 adults by 2050 [6]. Although our subjects were randomized by BMI, immediately following the initial blood analyses 2 subjects with high HbA1c readings were moved from Group 1 to Group 2 at the request of the study medical doctor and with approval from their personal physicians. Both training groups experienced significant reductions in HbA1c. HbA1c decreased from 5.67% to 5.59% in Group 1, with almost all of the change occurring during wks 1-12. HbA1c decreased from 6.01% to 5.75% in Group 2, with almost all of the change occurring during wks 1-12. These findings were consistent with a 2009 metaanalysis conclusion that resistance exercise reduces HbA1c in people with abnormal glucose metabolism [42]. Our data suggest that the majority of HbA1c improvement related to exercise and nutrition interventions may occur during the first several wks of the training program. A future study that examines HbA1c response in pre-diabetic or type 2 populations may be warranted.
A possible limitation of our study may have been the preponderance of female participants (60 women and 15 men). This 4:1 female/male ratio was between the gender ratios in our previous weight loss study (about 5:1) [46] and our previous body composition study (about 3:1) [49], in which the male subjects experienced significantly greater increases in lean weight and significantly greater decreases in fat weight than the female subjects. Therefore, it would seem unlikely for a more even gender distribution of the subjects to result in less body composition improvement.
Another possible limitation of the present study may have been the relatively high mean age of the subjects. The mean age of the subjects was 56.5 yrs, which was between the mean age in our previous weight loss study (59.7 yrs) [46] and our previous body composition study (53.8 yrs) [49]. Our research has found no significant differences in lean weight gains among younger, middle-aged, and older adult categories between 20 and 80 yrs of age [49]. However, we have not examined fat weight loss across age ranges, and it is possible that younger adults may respond differently than older adults.
An additional limitation may have been the inclusion of overweight as well as obese study subjects, which placed the mean baseline BMI at the low end of the obese range. Although this may affect generalizability of our results, individuals who begin an exercise and nutrition program with a higher BMI, more fat weight, and less lean weight would typically be expected to make more body composition improvement than those with a lower BMI, less fat weight, and more lean weight.
CONCLUSIONS
A 12-wk program of strength and endurance exercise was effective for improving percent fat, fat weight, lean weight, WC, HC, W/H ratio, DBP, and HbA1c in overweight/obese adults. However, the addition of a lower calorie and higher protein nutrition plan resulted in significantly greater reductions in body weight, BMI, percent fat, fat weight, WC, and HC over the same training period.
Significant changes in body weight, BMI, percent fat, fat weight, WC, W/H ratio, DBP, and HbA1c attained during the first 12 wks of the EN condition improved at similar rates during the second 12 wks of the EN condition, indicating that the EN program may be applied for at least 24 wks without reduced training effects.
A 24-wk program of strength and endurance exercise that included 12 wks of lower calorie and higher protein nutrition elicited significant improvements in body weight, BMI, percent fat, fat weight, lean weight, WC, HC, W/H ratio, SBP, DBP, and HbA1c. However, 24 wks of EN was more effective than 12 wks of EO and 12 wks of EN for reducing percent fat and fat weight, which are important program outcomes for overweight/obese individuals. A reduced calorie diet plan in conjunction with resistance exercise and higher protein intake can concurrently decrease fat weight and increase lean weight. Unlike most weight loss studies that show a decrease in lean weight, our program participants experienced both significant fat weight loss and lean weight gain.
Significant improvements in HbA1c were attained during the first 12 wks of all the EO and EN programs. This was particularly impressive in the Group 2 EN subjects who reduced their mean HbA1c reading from 6.01% to 5.79% during their initial training period.
Based on the results of this study, medically approved overweight/obese adults who perform a 12 to 24-wk program of strength and endurance exercise, eat approximately 1,200 to 1,500 kcal·d-1 for women or 1,500 to 1,800 kcal·d-1 for men, and substitute protein-rich shakes and bars for breakfast and lunch should attain significant improvements in body weight, body composition, body contours, blood pressure, and HbA1c. Therefore, it is suggested that overweight/obese patients and clients may experience more successful and sustainable weight management by following a moderate calorie diet plan that includes high protein meal replacements, and by performing a basic exercise program that includes resistance and aerobic training.
Bonus Tables. From a video by Dr. Wayne Wescott discussing the progress at 3- and at 6-months.
Want to know about the exercise program they used?
Figure At 3 months
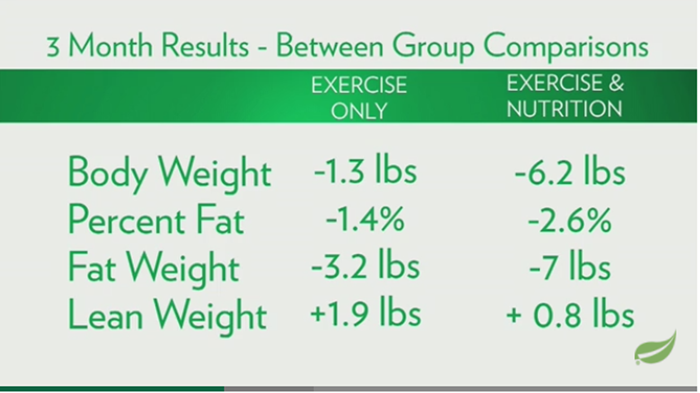
Figure At 6 months
ACKNOWLEDGMENTS
The authors express appreciation to Jamie McManus, MD, Bruce Daggy, PhD, Francis Lau, PhD, and Shaklee Corporation for providing financial support and nutritional product donation. The authors thank our Exercise Science faculty members, Robert Cobbett, Amy Cochlin, Joanne D’Andrea, Robert Godfrey, Pamela Hurley, and Scott Whitehead, for instructing and supervising the study subjects’ exercise sessions.
Address for correspondence:
Wayne L. Westcott, PhD,
Chair of Exercise Science,
Quincy College,
Room 006 Presidents Place,
1250 Hancock Street,
Quincy, MA 02169
Tel: 617-984-1716
wwestcott@quincycollege.edu
References:
Amati F, Dube JJ, Shay C, Goodpaster BH.
Separate and combined effects of exercise training and weight loss on exercise
efficiency and substrate oxidation.
J Appl Physiol. 2008;105(3):825-831.American College of Sports Medicine.
Position Stand: Appropriate physical activity intervention strategies for
weight loss and prevention of weight regain for adults.
Med Sci Sports Exerc. 2009;DOI:10.1249/MSS.0b013e3181949333.Anderson L, Tufekovic G, Zebis M.
The effects of resistance training combined with timed ingestion of protein
on muscle fiber size and muscle strength.
Metabol. 2005; 54:151-156.Arciero PJ, Gentile CL, Martin-Pressman R, et al.
Increased dietary protein and combined high intensity aerobic and resistance
exercise improves body fat distribution and cardiovascular risk factors.
Int J Sport Nutr Exerc Metab. 2006;16:373-392.Ballor D, Poehlman E.
Exercise training enhances fat-free mass preservation during diet-induced weight loss: A meta analytic finding.
Inter J Obes. 1994;18:35-40.Boyle JP.
Projection of the year 2050 burden of diabetes in the US adult population: dynamic modeling of incidence, mortality, and prediabetes prevalence.
Popul Health Metr. 2010;8:29.Campbell WW, Crim MC, Young VR, Evans WJ.
Increased energy requirements and changes in body composition with resistance training in older adults.
Am J Clin Nutr. 1994;60:167-175.Campbell W, Trappe T, Jozsi A, et al.
Dietary protein adequacy and lower body versus whole body resistive training in older humans.
J Physiol. 2002;542:631-642.Campbell W, Trappe T, Wolfe R, Evans W.
The recommended dietary allowance for protein may not be adequate for older people to maintain skeletal muscle.
J Gerontol A Biol Sci Med Sci. 2001;56:M373-M380.Cribb P, Hayes A.
Effect of supplement timing on skeletal muscle hypertrophy.
Med Sci Sports Exerc. 2006;38(11):1918-9125.Doi T, Matsuo T, Sugawara M, et al.
New approach for weight reduction by a combination of diet, light resistance exercise, and the timing of ingesting a protein supplement.
Asia Pac J Clin Nutr. 2001;10:226-232.Flack KD, Davy KP, Huber MAW, et al.
Aging, resistance training, and diabetes prevention.
J Aging Res. 2011;201:127315.Flegal KM, Carroll MD, Ogden CL, Curtin LR.
Prevalence and trends in obesity among US adults, 1999-2008.
JAMA. 2010;303(3):235-241.Fogelholm M, Kukkomen-Harjula K.
Does physical activity prevent weight gain – a systematic review.
Obes Reviews. 2000;1:95-111.Hackney KJ, Engels HJ, Gretebeck RJ.
Resting energy expenditure and delayed-onset muscle soreness after full-body resistance training with an eccentric concentration.
J Strength Cond Res 2008; 22:1602-1609.Hartman JW, Tang, JE, Wilkinson SB, et al.
Consumption of fat-free fluid milk after resistance exercise promotes greater lean mass accretion than does consumption of soy or carbohydrate in young, novice, male weight-lifters.
Am J Clin Nutr. 2007;86(2): 373-381.Haskell W, Lee I, Pate R, et al.
Physical activity and public health: Updated recommendations for adults from the American College of Sports Medicine and the American Heart Association.
Med Sci Sports Exerc. 2007;39:1423-1434.Heden T, Lox C, Rose P, et al.
One-set resistance training elevates energy expenditure for 72 hours similar to three sets.
Eur J App Physiol. 2011;111:477-484.Hunter GR, Wetzstein CJ, Fields DA, et al. R
esistance training increases total energy expenditure and free-living physical activity in older adults.
J Appl Physiol. 2000;89: 977-984.Jackson AW, Lee DC, Sui X, et al.
Muscular strength is inversely related to prevalence and incidence of obesity in adult men.
Obesity. 2010;18(10):1988-1995.Jakeman P.
Protein supplementation at breakfast and lunch for 24-weeks beyond habitual intakes increases whole-body lean tissue mass in healthy older adults.
J Nutri. 2016;146:65-69.Josse A, Tang J, Tarnopolsky M, Phillips S.
Body composition and strength changes in women with milk and resistance exercise.
Med Sci Sports Exerc. 2010;42(6):1122-1130.Kelley G, Kelley K.
Impact of progressive resistance training on lipids and lipoproteins in adults: a meta-analysis of randomized controlled trials.
Prev Med. 2009;48:9-19.Keys A, Taylor HL, Grande F.
Basal metabolism and age of adult man.
Metabolism. 1973;22:579-587.Klem ML, Wing RR, McGuire M, et al.
A descriptive study of individuals successful at long-term maintenance of substantial weight loss.
Am J Clin Nutri. 1997;66:239-246.Kraemer WJ, Volek JS, Clark KL, et al.
Influence of exercise training on physiological and performance changes with weight loss in men.
Med Sci Sports Exerc. 1999; 31(9):1320-1329.Layman DK, Evans E, Baum JL, et al.
Dietary protein and exercise have additive effects on body composition during weight loss in adult women.
J Nutri. 2005;135: 1903-1910.Longland TM, Oikawa SY, Mitchell CJ, et al.
Higher compared with lower dietary protein during an energy deficit combined with intense exercise promotes greater lean mass gain and fat mass loss: a randomized trial.
Am J Clin Nutr. 2016;103:738-746.Mann T, Tomiyama J, Westling E, et al.
Medicare’s search for effective obesity treatments - diets are not the answer.
Am Psych. 2007;62(3):220-233.Marcell TJ.
Sarcopenia: Causes, consequences, and preventions.
J Gerontol A Biol Sci Med Sci. 2003;58:M911-M916.Mettler S, Mitchell N, Tipton KD.
Increased protein intake reduces lean body mass loss during weight loss in athletes.
Med Sci Sports Exerc. 2010;42(2):326-337.Nelson ME, Fiatarone M, Morganti C, et al.
Effects of high-intensity strength training on multiple risk factors for osteoporosis fractures.
JAMA. 1994;272:1909-1914.Park SK, Park JH, Kwon YC, et al.
The effect of combined aerobic and resistance exercise training on abdominal fat in obese middle-aged women.
J Physiol Anthropol Appl Human Sci. 2003;22:129-135.Pate RR, Taverno Ross SE, Liese AD, Dowda M.
Associations among physical activity, diet quality, and weight status in US adults.
Med Sci Sports Exerc. 2015;47 (4):743-750.Phillips S, Hartman J, Wilkinson S.
Dietary protein to support anabolism with resistance exercise in young men.
J Am Coll Nutr. 2005;24(2):1345-1359.Pratley R, Nicklas B, Rubin M, et al.
Strength training increases resting metabolic rate and norepinephrine levels in healthy 50-to-65 year-old men.
J Appl Physiol. 1994;76: 133-137.Rice B, Janssen I, Hudson R, Ross R.
Effects of aerobic or resistance exercise and/or diet on glucose tolerance and plasma insulin levels in obese men.
Diabetes Care. 1999;22:684-691.Roberts CK, Lee MM, Katiraie M, et al.
Strength fitness and body weight status on markers of cardiometabolic health.
Med Sci Sports Exerc. 2015;47(6):1211-1218.Serdula MK, Mokdad AH, Williamson DF, et al.
Prevalence of attempting weight loss and strategies for controlling weight.
JAMA. 1999;282(14):1353-1358.Skender ML, Goodrick GK, Del Junco DJ, et al.
Comparison of 2-year weight loss trends in behavioral treatments of obesity: Diet, exercise, and combination interventions.
J Am Dietetic Assoc. 1996;96:342-346.South MA, Layne AS, Stuart CA, et al.
Effects of short-term free-weight and semiblock periodization resistance training on metabolic syndrome.
J Strength Cond Res. 2016; 30(10):2682-2696.Strasser B, Siebert U, Schobersberger W.
Resistance training in the treatment of metabolic syndrome.
Sports Med. 2010;40:397-415.Svetkey LP, Stevens VJ, Brantley PJ, et al.
Comparison of strategies for sustaining weight loss.
JAMA. 2008;299:1139-48.Troiano RP, Berriga D, Dodd KW, Masse LC, Tilert T, McDowell M.
Physical activity in the United States measured by accelerometer.
Med Sci Sports Exerc. 2008;40(1): 181-188.Westcott WL.
Resistance training is medicine: Effects of strength training on health.
ACSM Current Sportsmed Reports. 2012;11(4):209-212.Westcott WL, Apovian CM, Puhala K, et al.
Nutrition programs enhance exercise effects on body composition and resting blood pressure.
Phys Sportsmed. 2013; 41(3):85-91.Westcott W, Martin W, La Rosa Loud R, Stoddard S.
Protein and Body Composition
Fitness Manage. 2008; 24 (5): 50-53Westcott Varghese J, DiNubile N, et al.
Exercise and nutrition more effective than exercise alone for increasing lean weight and reducing resting blood pressure.
J Exerc Physiol online. 2011;14(4):120-133.Westcott WL, Winett RA, Annesi JJ, et al.
Prescribing physical activity: applying the ACSM protocols for exercise type, intensity, and duration across 3 training frequencies.
Phys Sportsmed. 2009;2:51-58.Wolfe I.
The unappreciated role of muscle in health and disease.
Am J Clin Nutr. 2006;84:475-482
Return to LEUCINE
Return to SHAKLEE STUDIES
Since 3–19–2017

| Home Page | Visit Our Sponsors | Become a Sponsor |
Please read our DISCLAIMER |