

Expenditures and Health Status Among
Adults With Back and Neck ProblemsThis section was compiled by Frank M. Painter, D.C.
Send all comments or additions to: Frankp@chiro.org


FROM: JAMA 2008 (Feb 13); 299 (6): 656–664 ~ FULL TEXT
OPEN ACCESS Brook I. Martin, MPH; Richard A. Deyo, MD, MPH;
Sohail K. Mirza, MD, MPH; Judith A. Turner, PhD;
Bryan A. Comstock, MS; William Hollingworth, PhD; Sean D. Sullivan, PhD
Department of Orthopaedics and Sports Medicine,
University of Washington,
Seattle, WA 98104, USA.
bim@u.washington.edu
Editorial Commentary:
This balanced article in the Feb 13, 2008 issue of JAMA revealed that between 1997 and 2005, the costs for “standard medical management” of spinal pain syndromes (both neck and back) increased by an inflation-adjusted 63%, while measured outcomes for physical functioning, work or school limitations, and social limitations among adults actually declined. During this same period, there was also an overall increase in the number of individuals who experienced neck or back pain (from 20.7% to 24.7%).
During this same time period, the inclusion of a chiropractic benefit within a large managed care program (observed over a 4-year period) resulted in significant savings, as well as a reduction in the rates of surgery, and unnecessary use of advanced imaging, inpatient care, and plain-film radiographs.
These 2 studies, along with many similar findings, make it apparent that chiropractic should be the FIRST choice of management for those with musculoskeletal complaints. You may want to refer to the Cost-Effectiveness Page or the Patient Satisfaction Page for more supportive information on this topic.
CONTEXT: Back and neck problems are among the symptoms most commonly encountered in clinical practice. However, few studies have examined national trends in expenditures for back and neck problems or related these trends to health status measures.
OBJECTIVES: To estimate inpatient, outpatient, emergency department, and pharmacy expenditures related to back and neck problems in the United States from 1997 through 2005 and to examine associated trends in health status.
DESIGN AND SETTING: Age- and sex-adjusted analysis of the nationally representative Medical Expenditure Panel Survey (MEPS) from 1997 to 2005 using complex survey regression methods. The MEPS is a household survey of medical expenditures weighted to represent national estimates. Respondents were US adults (> 17 years) who self-reported back and neck problems (referred to as "spine problems" based on MEPS descriptions and International Classification of Diseases, Ninth Revision, Clinical Modification definitions).
MAIN OUTCOME MEASURES: Spine-related expenditures for health services (inflation-adjusted); annual surveys of self-reported health status.
RESULTS: National estimates were based on annual samples of survey respondents with and without self-reported spine problems from 1997 through 2005. A total of 23,045 respondents were sampled in 1997, including 3139 who reported spine problems. In 2005, the sample included 22,258 respondents, including 3187 who reported spine problems. In 1997, the mean age- and sex-adjusted medical costs for respondents with spine problems was $4695 (95% confidence interval [CI], $4181–$5209), compared with $2731 (95% CI, $2557–$2904) among those without spine problems (inflation-adjusted to 2005 dollars). In 2005, the mean age- and sex- adjusted medical expenditure among respondents with spine problems was $6096 (95% CI, $5670–$6522), compared with $3516 (95% CI, $3266–$3765) among those without spine problems. Total estimated expenditures among respondents with spine problems increased 65% (adjusted for inflation) from 1997 to 2005, more rapidly than overall health expenditures. The estimated proportion of persons with back or neck problems who self-reported physical functioning limitations increased from 20.7% (95% CI, 19.9%–21.4%) to 24.7% (95% CI, 23.7%–25.6%) from 1997 to 2005. Age- and sex-adjusted self-reported measures of mental health, physical functioning, work or school limitations, and social limitations among adults with spine problems were worse in 2005 than in 1997.
CONCLUSION: In this survey population, self-reported back and neck problems accounted for a large proportion of health care expenditures. These spine-related expenditures have increased substantially from 1997 to 2005, without evidence of corresponding improvement in self-assessed health status.
From the FULL TEXT Article:
Introduction
Back and neck problems are among the symptoms most commonly encountered in clinical practice. In a 2002 survey of US adults, 26% reported low back pain and 14% reported neck pain in the previous 3 months. [1] Low back pain alone accounted for approximately 2% of all physician office visits; only routine examinations, hypertension, and diabetes resulted in more office visits. Rates of imaging, injections, opiate use, and surgery for spine problems have increased substantially over the past decade. [2–5] Such increases would likely result in increased health care expenditures, but it is uncertain how much expenditures have increased or how national expenditures for spine care compare with those for other problems.
It is also unclear if these increases in rates of imaging and therapy are associated with improvements in health status among individuals with back or neck pain. If clinical services are having a major impact on the health of individuals with spine-related problems and the use of such services is increasing, improvements over time in health status among individuals who report such problems might be anticipated.
Several scenarios related to expenditure and health status are plausible. In the most desirable situation, newer technology and treatment strategies prevent or reduce health problems sufficiently to offset their expenses. This may lead to flat or decreasing care expenditures, with equal or improving health status. If overall medical expenses increase but health status concurrently improves, it might be beneficial to examine the value for money or the gain in quality-adjusted life-years per dollar spent. In this situation, reductions in nonmedical or indirect expenditures, such as work disability, might even offset increasing direct medical expenditures. An increase in expenditures without improvement in health status, however, would raise questions of medical waste.
We sought to examine recent changes in expenditures related to back and neck problems (referred to herein as “spine problems,” based on Medical Expenditure Panel Survey [MEPS] descriptions and International Classification of Diseases, Ninth Revision, Clinical Modification (ICD-9-CM) definitions) to evaluate whether these changes were associated with a concurrent change in health status. The MEPS, sponsored by the Agency for Healthcare Research and Quality and the National Center for Health Statistics, is a comprehensive source of data for estimates of US health service use and expenditures. [6, 7]
We used these data to examine trends in health care expenditures and health states among individuals with back and neck problems from 1997 to 2005.
Our specific research questions were(1) What are the overall age- and sex-adjusted health care expenditures for back and neck problems, and are they increasing?
(2) What fraction of all medical care expenditures may be accounted for by back and neck problems?
(3) Which components of medical expenditures (inpatient, outpatient, emergency department, or prescription medications) contribute most to any changes observed?
(4) At the population level, is the health status of adults with back and neck problems improving?
Methods:
Sample
We analyzed data from all respondents to the MEPS Household Component surveys from 1997 through 2005 who were older than 17 years. The Household Component surveys families and individuals regarding demographic characteristics, medical conditions, and health services use and costs.7,8 The MEPS sample is drawn from respondents in the previous year's National Health Interview Survey, a nationally representative sample (with oversampling for Hispanics and blacks) of the US civilian noninstitutionalized population. The survey uses an overlapping panel design involving 5 rounds of interviews over a 2˝–year period. A new panel is selected annually. Telephone interviews and record abstractions from physicians, hospitals, and home health caregivers and from pharmacies provide additional utilization and expenditure data. Race was determined through respondent self-report using MEPS-defined categories; an “other” category was available for categories not on the predefined list. Respondents could select more than 1 category, in which case they were coded as “multiple.” For analysis, categories were aggregated into “white,” “black,” and “other/multiple.” An exemption of institutional review was obtained from the University of Washington Human Subjects Division because this study involves precollected and deidentified data.
Spine Condition Diagnosis Data

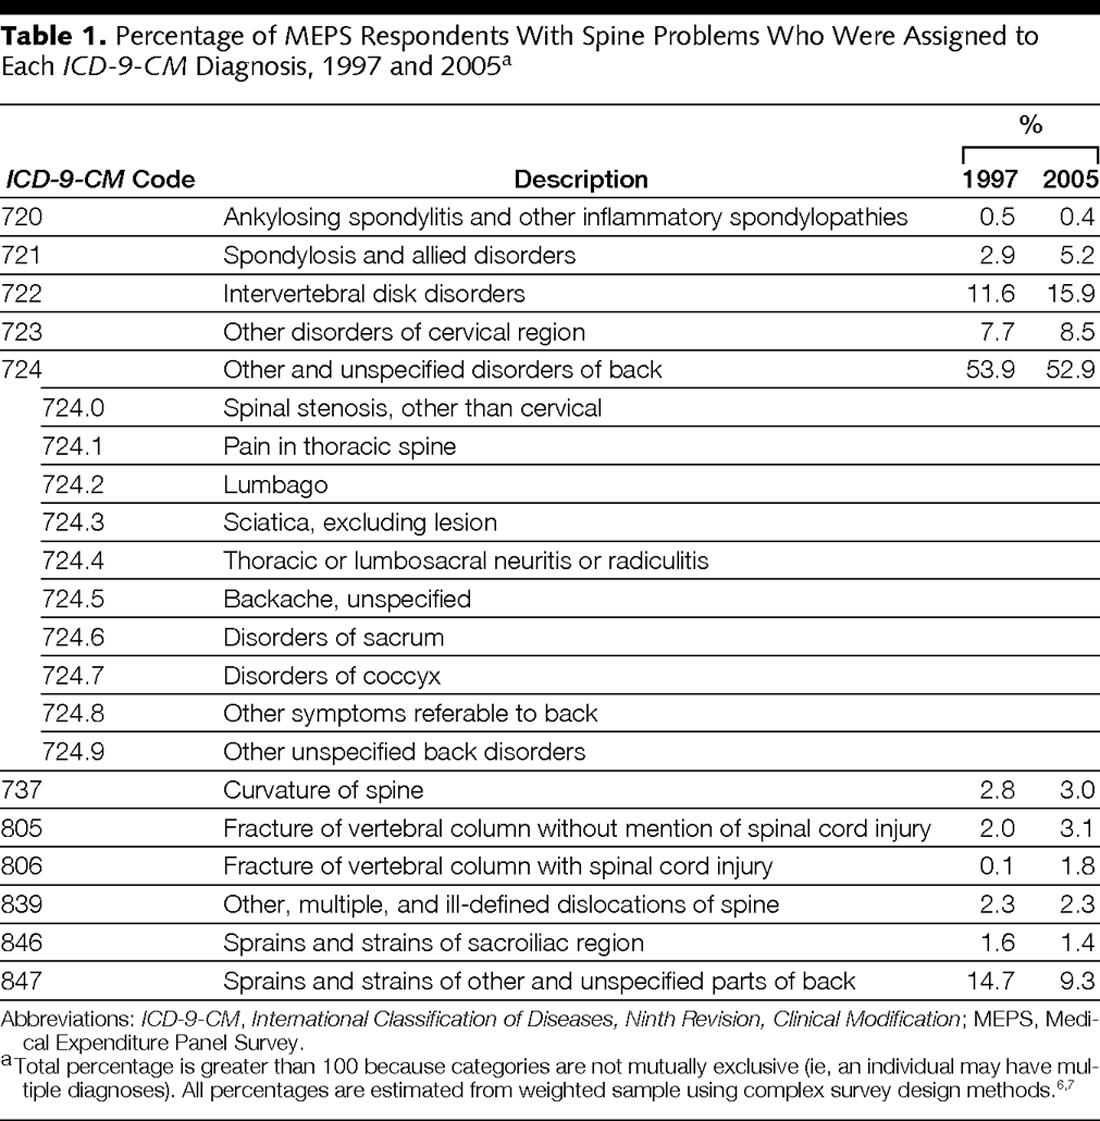
Table 1 The Household Component survey asks participants to report all health problems, including “physical conditions, accidents, or injuries that affect any part of the body as well as mental or emotional health conditions, such as feeling sad, blue, or anxious about something.” [9] These self-reported conditions are then mapped to ICD-9-CM diagnosis codes by MEPS researchers. We defined patients with spine problems as those with ICD-9-CM codes commonly used for back or neck problems, disk disorders, and back injuries (Table 1). [10, 11] We could not distinguish among cervical, thoracic, and lumbar spine problems, because ICD-9-CM codes in the MEPS public use files are limited to major categories (3–digit codes) to prevent patient identification. For the same reason, some potentially spine-related diagnoses were not included in our definition because they cannot be distinguished from nonspine-related diagnoses. For example, “pathologic fracture of vertebrae” (ICD-9-CM 733.13) cannot be distinguished from some other fractures on the basis of 3–digit ICD-9-CM codes. Other diagnoses (eg, “mechanical complication of internal orthopedic device, implant, and graft”; “stiffness”; and “arthralgia”) were not included because they are not specifically defined as involving the spine. We did not include ICD-9-CM procedure codes, as opposed to diagnosis codes, because the public-use MEPS files limit them to 2 digits, which are insufficient to distinguish spine from nonspine procedures.
Health Care Expenditures
Expenditure data are derived from the Household, Medical Provider, and Pharmacy Component surveys. Expenditures refer to amounts paid for health care services, whether out-of-pocket, from private insurance companies, from Medicare and Medicaid, or from other sources. Payments for over-the-counter drugs are not included. An imputation is performed by the Agency for Healthcare Research and Quality using available charge and payment data in either the Household Component or the Medical Provider Component to replace missing expenditure data.
The total expenditures are calculated as the mean expenditure for the sample multiplied by the population size. Despite the skewed distribution of expenditure data (due to outliers with very high expenditures), we focused primarily on mean total expenditures, which are useful for estimating the total cost of care.12,13 For respondents with spine problems, we calculated mean expenditures for particular services (inpatient, outpatient, emergency department, and prescription medications). We combined hospital outpatient and office-based visit expenditures into a single outpatient service category. We did not separately examine the dental, home health, or “other” medical service visit categories, because combined these accounted for only 10% of expenditures among persons with spine problems in 2005. However, we did include these categories in the total expenditure summary variable.
To compare expenditures from 1997 through 2005 for individuals with vs without spine problems, we report the difference in mean age- and sex-adjusted overall expenditures (the sum of all expenditure categories). This method, referred to as the “incremental” method, has been used in previous analyses of spine-related expenditures.11 It captures spine-related expenses that would otherwise be missed due to nonspecific coding (eg, device-related complications after spinal surgery) as well as expenditures resulting from related comorbid conditions (eg, psychological distress due to back pain).14 Conditions unrelated to the spine should theoretically be equally prevalent in the population with nonspine disorders, so nonspine-related expenditures should be comparable in the 2 populations.
In addition to the incremental method, we estimated the costs of services specifically for spine problems by summing the expenditures for visits or prescriptions that were identified as spine-related within each service category. This “direct method” is likely to underestimate expenditures because of limitations in the ICD-9-CM codes. For example, expenditures for a relevant hospitalization coded as “mechanical complication of device” would not be included, because the ICD-9-CM code does not identify a back or neck problem as the cause. Also, some persons have comorbid conditions related to their back or neck problems that are not recorded with spine-related ICD-9-CM codes (eg, mental health conditions). Thus, the direct method may provide a low-end estimate of spine-related costs, while the incremental method provides a high-end estimate. The direct method also was used to examine expenditure trends for 5 specific drug categories: nonnarcotic analgesics, nonsteroidal anti-inflammatory medications, narcotic analgesics, muscle relaxants, and cyclooxygenase 2 inhibitors. Individual drugs are assigned to these categories by the Multum Lexicon definitions available in the MEPS pharmacy events files.
We separately examined overall expenditures with a 2–part model commonly used for expenditure data. The first part of this model represents the probability of incurring any expenditure and is determined using a logistic regression analysis adjusting for age, sex, and presence of a spine problem. The second part of the model uses a generalized linear regression analysis with a γ distribution and a log-link function to predict the amount of expenditures conditional on having any expenditure. The estimated expenditure for each individual is then obtained by multiplying predictions from each part of the model.
Health Status
We linked the expenditure files to self-reported health-status measures, demographic characteristics, and employment status. We calculated the percentage of respondents who reported any limitations in activities of daily living, defined as need for personal assistance with bathing, dressing, eating, transferring, walking, or using a toilet) [15, 16]; physical functioning (eg, walking, climbing stairs, lifting, bending, standing); social functioning; and work, school, or home activities. We also examined 12–Item Short Form Health Survey Physical Component Summary and Mental Component Summary scores from 2000 to 2005. [17] We converted 2000–2002 version 1 scores to the version 2 equivalents, because version 2 was administered after 2002. [18] Respondents could be surveyed more than once a year for some measures; we used data from the last survey in each year.
Demographic Data
We analyzed data related to sex, race, education, type of insurance coverage (“any private insurance,” “public only coverage,” or “uninsured”), poverty category, and US Census geographic region. We recoded the 6 self-reported categories for race collected by MEPS into 3 groups (“white,” “black,” and “other/multiple”). Poverty status was based on family income relative to the federal poverty index and categorized as “negative or poor income” (<100% of the poverty line), “near poor” (100% to <125%), “low income” (125% to <200%), “middle income” (200% to <400%), and “high income” (≥400%).
Analysis
To adjust for inflation, expenditures from 1997 through 2004 were inflated to match the 2005 equivalents using the Consumer Price Index for Medical Services provided by the US Bureau of Labor Statistics.19 Expenditure estimates were age- and sex-adjusted and weighted to represent national estimates. We used variables included with MEPS to account for the complex sampling method, oversampling, and nonresponse. Response rates for MEPS during the study years ranged from 63.1% to 70.7%. Expenditure estimates with 95% confidence intervals (CIs) were calculated using Stata release 9.0 survey regression procedures.20,21
To examine whether expenditures were increasing more rapidly among adults with spine problems than among those without, we performed linear regression analysis of expenditure as a function of time (year), presence of spine condition, and an interaction term for these 2 variables. To examine trends over time in health status among adults with spine problems, we conducted logistic regression analyses of each health status outcome as a function of time (year), adjusting for age and sex. All analyses were performed using Stata release 9.0 (StataCorp, College Station, Texas); α level was set at .05.
Results:
Prevalence of Spine Problems
In 2005, there were 22,258 adult respondents in MEPS, representing, when weighted, a national estimate of approximately 219 million adults. This is similar to the estimated US adult population of 223 million in 2005 (US Census projection22). Among these sampled adults, 3187 reported spine problems in 2005. The most common ICD-9-CM diagnoses were other and unspecified disorders of the back (52.9%), followed by intervertebral disk disorders (15.9%) and sprains or strains of the back (9.3%) (Table 1).
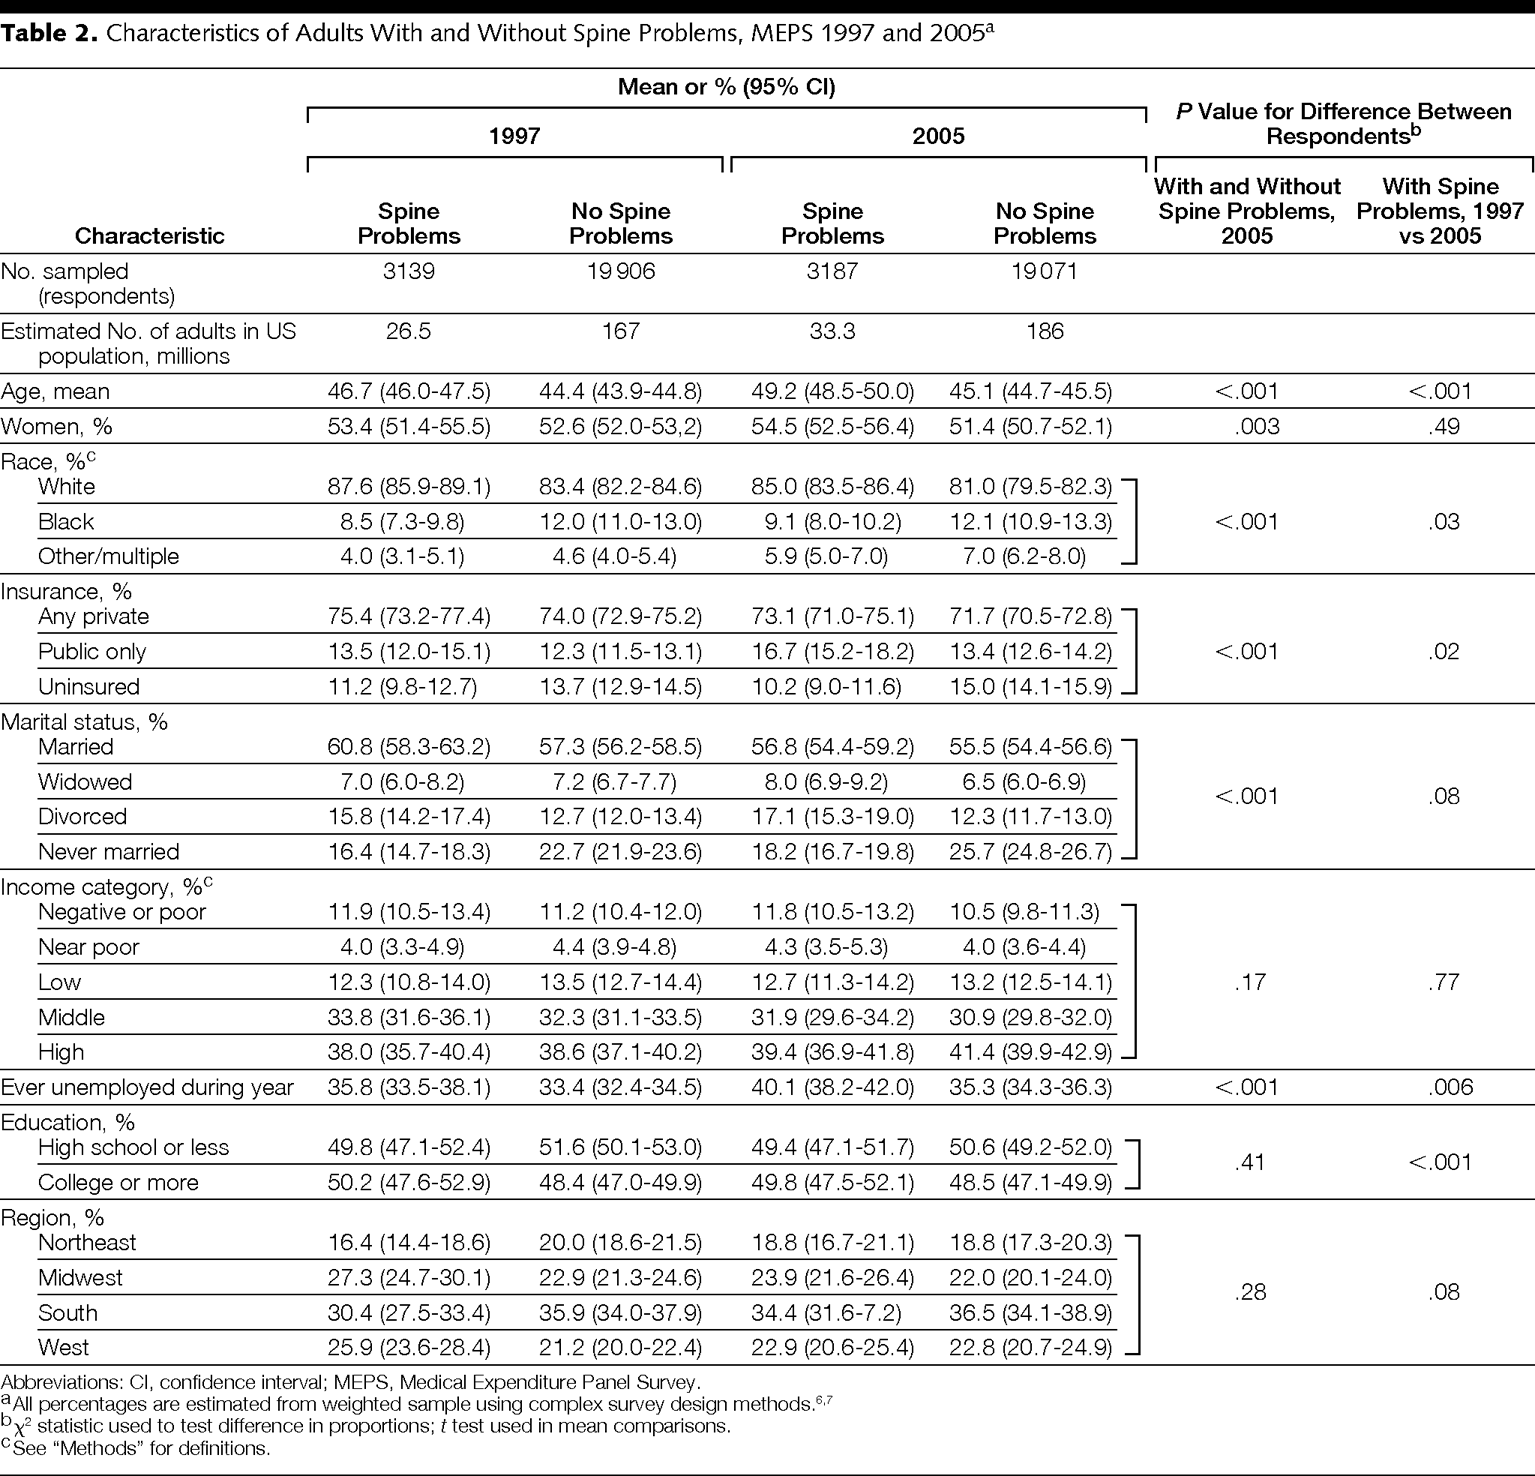
Table 2 We compared characteristics of MEPS respondents with spine problems in 2005 vs 1997 to identify factors that might be associated with changes in expenditures over this period. Compared with 1997, adults with spine problems in 2005 were on average 2.5 years older, slightly less likely to be white, more likely to receive public health insurance, and more likely to be unemployed (Table 2).
Table 2 also compares respondents with and without spine problems in 2005 to identify factors that might explain differences in expenditures between the 2 groups. The group with spine problems had a higher proportion who were women, white, covered by public insurance, and unemployed at any time during the year. Those with spine problems were also older on average and less likely to have never married.
Expenditures Related to Spine Problems
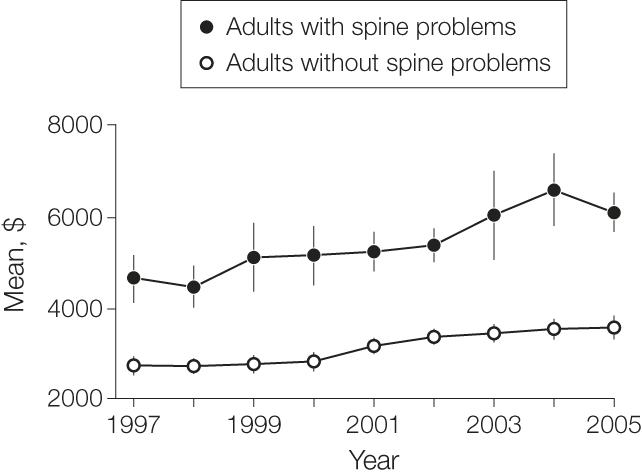
Figure 1
Table 3 Age- and sex-adjusted expenditures were higher in each year for those with spine problems than for those without (Figure 1). Adults with spine problems showed a steeper increase in expenditures from 2002 to 2004 than did those without, although the difference in the increase between groups over all study years was not statistically significant (P = .07). In 1997, the mean age- and sex-adjusted medical costs for respondents with spine problems was $4695 (95% CI, $4,181 to $5,209), compared with $2,731 (95% CI, $2,557 to $2,904) among those without spine problems (inflation adjusted to 2005 dollars). In 2005, the mean age- and sex-adjusted medical expenditure among respondents with spine problems was $6,096 (95% CI, $5670 to $6522), compared with $3,516 (95% CI, $3,266 to $3,765) among those without spine problems. Therefore, in 2005, the incremental increase in expenditures attributed to spine problems was $2,580 (95% CI, $2,404 to $2,757) per person with spine problems. From 1997 to 2005, these trends resulted in an estimated 65% inflation-adjusted increase in the total national expenditure of adults with spine problems (Table 3). These trends were nearly identical to the estimates produced using the 2–part modeling method.
Most of the difference we observed in inflation-adjusted expenditures between those with and without spine problems in 2005 was accounted for by outpatient services (36%) and inpatient services (28%). Smaller proportions were accounted for by prescription medications (23%); emergency department visits (3%); and home health, dental, and other expenses (10%). Absolute expenditures increased substantially in all categories (Table 3).
From 1997 to 2005, the mean annual chiropractor expenses among respondents with spine problems increased from $94 (95% CI, $68 to $120) to $157 (95% CI, $127 to $187) and among those without spine problems from $6 (95% CI, $4 to $10) to $11 (95% CI, $7 to $14). These means include many respondents who used no chiropractic services; they do not represent mean costs by users of the services. Based on the prevalence of spine problems, these trends represent an estimated 111% increase in total national spine-related expenditures for chiropractor visits. Similarly, national expenditures for spine-related physical therapy increased by an estimated 78%. From 1997 to 2005, the mean annual physical therapy expenditures among respondents with spine problems increased from $115 (95% CI, $71 to $160) to $129 (95% CI, $105 to $154). Among respondents without spine problems, physical therapy expenditures decreased from $45 (95% CI, $29 to $61) in 1997 to $33 (95% CI, $25 to $40) in 2005.
From 1997 to 2005, the mean annual expenditure among patients with spine problems receiving workers' compensation decreased from $157 (95% CI, $104 to $210) to $119 (95% CI, $70 to $169) and among those without spine problems from $51 (95% CI, $30 to $73) to $25 (95% CI, $15 to $36). Again, these means include many persons who were not receiving compensation benefits and do not represent the mean among beneficiaries alone. This decrease in mean incremental costs per person attributed to spine problems was offset by an increase in the number with spine conditions, resulting in an estimated 12% net increase in workers' compensation expenditures for spine problems from 1997 to 2005.
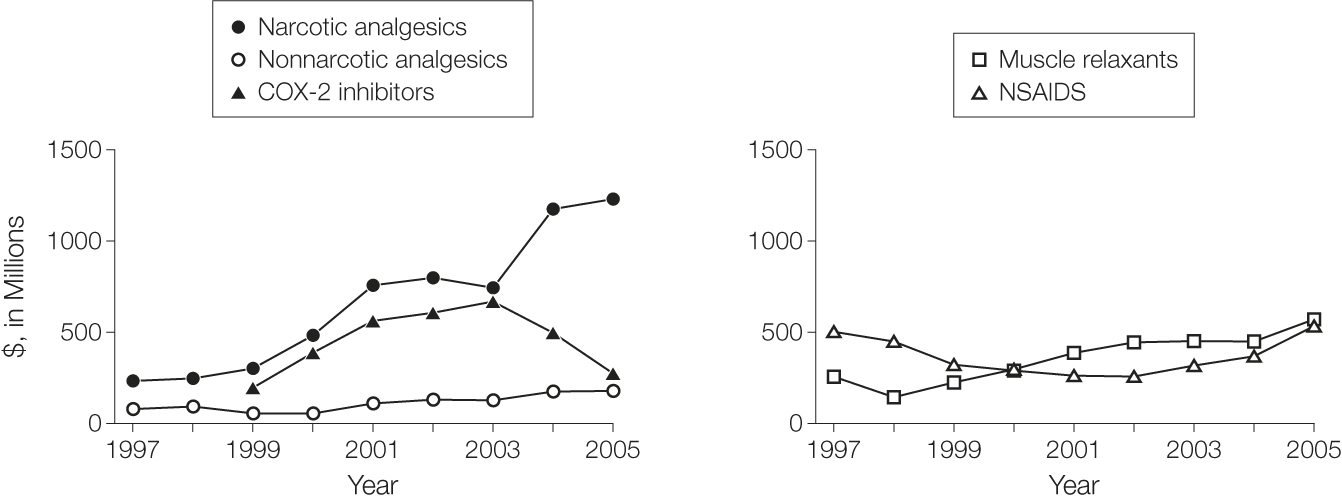
Figure 2 We also calculated expenditures explicitly linked to spine problems using the direct method (Table 3). As expected, this method resulted in substantially lower estimates. By this method, the total inflation-adjusted expenditure for spine problems increased 60% from 1997 to 2005. Expenditures for prescription medications directly attributed to spine problems increased 188%, again more than any other service category. Inpatient expenditures increased 87% by the direct method, outpatient expenditures increased 43%, and ED expenditures decreased 27%. An increase in expenditures for narcotic analgesics was particularly evident after 2003, when the use of cyclooxygenase 2 inhibitors declined (Figure 2). The mean, inflation-adjusted, spine-related expenditure for pharmacy events increased from $25 (95% CI, $19 to $31) in 1997 to $58 (95% CI, $46 to $69) in 2005. When combined with the increase in the number of pharmacy events among patients with spine problems, these differences account for an estimated 423% increase in the expenditure for spine-related narcotic analgesics from 1997 to 2004.
The mean number of nonspine conditions reported by respondents (comorbidity) could account for some of the differences observed in expenditures. Further analyses revealed that respondents with spine problems reported more comorbid conditions across all years (P < .001) and that comorbidity increased significantly more over the study years among respondents with spine problems than among those without spine problems (P = .003). Including comorbidity as a covariate in our expenditure models weakened the diverging trend in expenditures between respondents with spine problems compared with those without spine problems. However, while comorbidity modifies the estimated expenditures over time, it reflects the reality of population expenditures and, unlike age or sex, may be influenced by changes in practice style or patient self-perception. Therefore, we did not control for the number of reported conditions in our primary analysis.
Health Status
In 2005, compared with respondents without spine problems, those with spine problems were more likely to report physical functioning limitations (odds ratio [OR], 2.92; 95% CI, 2.59 to 3.30; P < .001); work or school limitations (OR, 2.68; 95% CI, 2.38 to 3.01; P < .001); and social limitations (OR, 2.53; 95% CI, 2.18 to 2.93; P < .001). Those with spine problems also had 5.4 points lower (worse) Physical Component Summary scores (95% CI, –5.9 to –4.9; P < .001) and 2.2 points lower (worse) Mental Component Summary scores (95% CI, –2.7 to –1.7; P < .001).
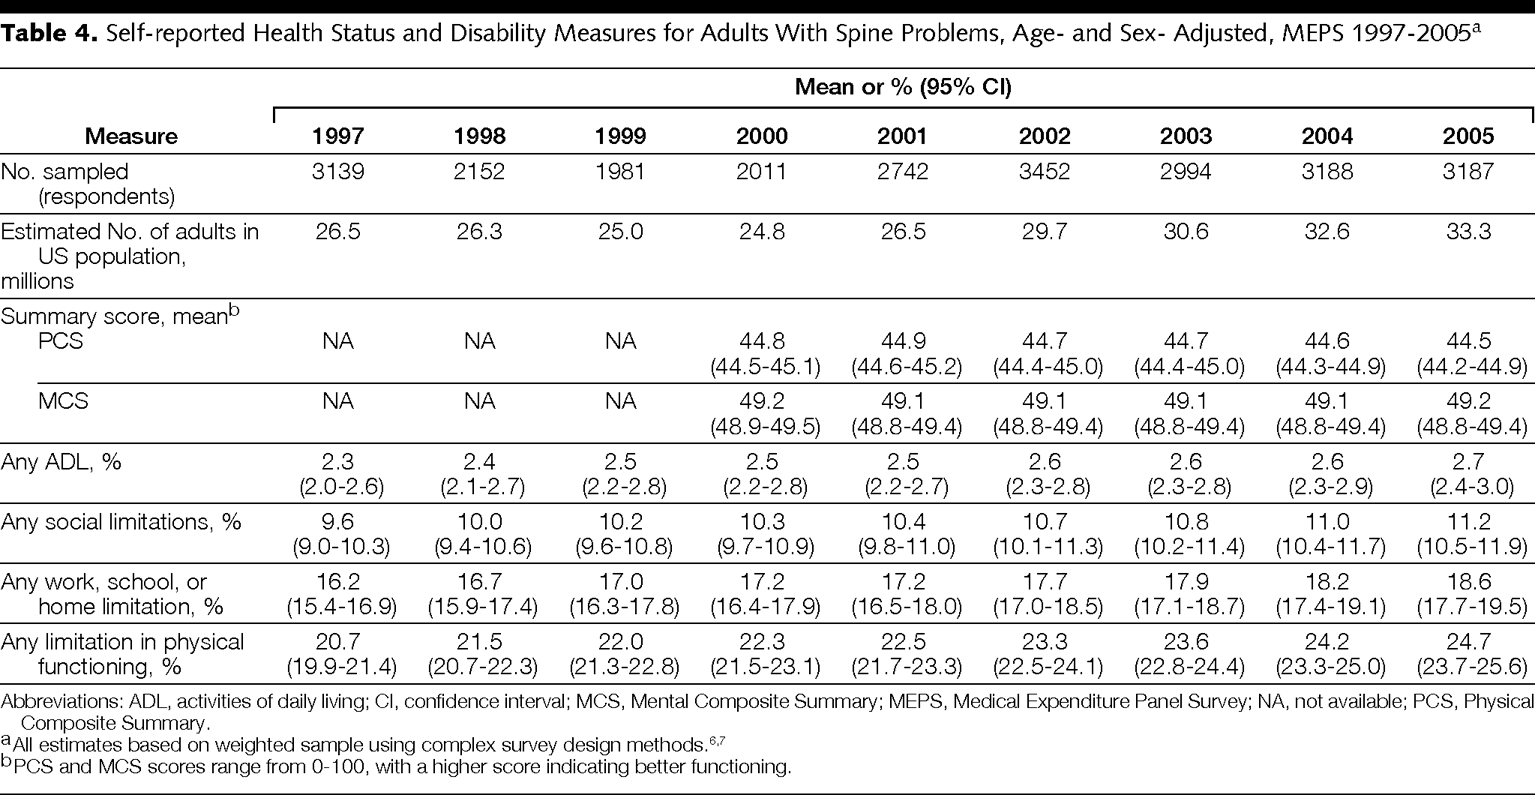
Table 4 Among respondents reporting spine problems from 2000 to 2005, the age- and sex-adjusted mean Physical Component Summary and Mental Component Summary scores did not change appreciably. From 1997 through 2005, however, age- and sex-adjusted limitations increased significantly in physical functioning (OR, 1.05; 95% CI, 1.03 to 1.07; P < .001), work or school activities (OR, 1.03; 95% CI, 1.01 to 1.05; P = .002), and social activities (OR, 1.03; 95% CI, 1.01 to 1.06; P = .003) (Table 4). Limitations in activities of daily living did not differ significantly between respondents with and without spine problems or change significantly over time.
Discussion:
Despite rapidly increasing medical expenditures from 1997 to 2005, there was no improvement over this period in self-assessed health status, functional disability, work limitations, or social functioning among respondents with spine problems. Age-, sex-, and inflation-adjusted health care expenditures related to spine problems increased 65% between 1997 and 2005. This occurred despite only a modest increase in the estimated numbers of US adults with spine problems, ranging from a low of 24.8 million (12% of the US adult population) in 2000 to a high of 33.3 million (15%) in 2005. Although expenditures for outpatient visits accounted for the largest proportion of total cost, the greatest relative increase among expenditure categories was observed for medications. Across all years, the average expenditure for respondents reporting spine problems was 73% greater than that of those without spine problems. Multiplying the mean incremental expenditures for spine problems in 2005 ($2580; 95% CI, $2404 to $2757) by the estimated number of persons with spine problems in 2005 yields a total of $85.9 billion (95% CI, $80.1 billion to $91.8 billion) in additional health expenditures among those with spine problems. This represents 9% of the total national expenditure estimated from MEPS.
The economic burden for other medical conditions has been reported using various methods. The total direct medical expenditure for spine problems ranks high relative to that for other medical conditions. In 2003, for example, MEPS data indicated that arthritis, the leading cause of disability in the United States, cost approximately $80.3 billion in medical expenditures. [23] The National Heart, Lung, and Blood Institute estimated the cost of cancer at $89.0 billion in 2007. [24] In 2002, the total direct expenditure attributed to diabetes was estimated at $98.1 billion. [25] Only expenditures for heart disease and stroke, estimated at $257.6 billion, were substantially higher than those for spine problems. [26] Previous studies estimated spine-related medical expenditures at $12.9 billion in 1984 and $33.6 billion in 1994. [27, 28] An analysis of 1997 MEPS data estimated the incremental health care expenditure attributed to spine problems to be $26.3 billion. [11]
Several factors may account for increasing medical expenditures associated with spine problems. The percentage of total expenditures related to prescription medication increased during the study period more rapidly than expenditures for other major services. Nationally estimated pharmacy expenditures related to spine problems increased from $7.3 billion (95% CI, $6.1 to $8.6 billion; 14% of total direct expenditures) to $19.8 billion (95% CI, $18.5 billion to $21.2 billion; 23% of total). Wider use of expensive new drugs during the study years, such as gabapentin, fentanyl, and time-release oxycodone, may account for some of this increase. [29–33] The greatest absolute dollar increase from 1997 to 2005 was for outpatient visits, accounting for $30.8 billion (36%) of total spine-related expenditures in 2005. Other increases may be related to medical imaging and diagnostic tests, [34] spinal injections, [4, 35] a lower threshold for providing treatment, higher patient expectations for care, and increasing use of spinal fusion surgery and instrumentation. [36–38] We also observed that increasing reports of comorbid conditions accounts for some of the observed trends in expenditures.
There are several limitations in using MEPS data. These include the possibility that changes in observed expenditures are attributable to sampling variation. However, we examined changes over a long interval, providing a more complete picture of underlying trends. Our study was underpowered to detect some differences. A post hoc calculation suggests that the statistical power was adequate (80%) to detect a $1160 difference in incremental expenditures for patients with spine problems relative to those without spine problems over the 8-year study period. We observed an incremental increase of $712 among patients with spine problems relative to those without spine problems in the weighted sample. Although there were no changes in the 3–digit ICD-9-CM codes for spine-related conditions during the study years, the observed prevalence of spine problems may be underestimated because we were limited to 3–digit codes. For example, surgical patients with device complications without an accompanying ICD-9-CM code specific to the spine would not have been counted by either our incremental or direct expenditure methods. Similarly, we were unable to distinguish between cervical, thoracic, and lumbar spine problems on the basis of 3–digit ICD-9-CM codes. Finally, MEPS data do not capture over-the-counter medications.
The health status results should be interpreted cautiously. These measures are not obtained at a consistent interval following treatment, but there is no reason to believe that the average interval from treatment to assessment differs by year. Health status is affected by all of an individual's medical and psychological conditions, not just spine problems; however, several of the measures used here are commonly used in research on back and neck pain and appear appropriate in this context.
These data suggest that spine problems are expensive, due both to large numbers of affected persons and to high costs per person. We did not observe improvements in health outcomes commensurate with the increasing costs over time. Spine problems may offer opportunities to reduce expenditures without associated worsening of clinical outcomes.
References:
Deyo RA, Mirza SK, Martin BI.
Back pain prevalence and visit rates: estimates from U.S. national surveys, 2002.
Spine. 2006;31(23):2724-2727Gray DT, Deyo RA, Kreuter W, et al.
Population-based trends in volumes and rates of ambulatory lumbar spine surgery.
Spine. 2006;31(17):1957-1963Kessler RC, Davis RB, Foster DF, et al.
Long-Term Trends in the Use of Complementary and Alternative Medical Therapies
in the United States
Annals of Internal Medicine 2001 (Aug 21); 135 (4): 262–268Carrino JA, Morrison WB, Parker L, et al.
Spinal injection procedures: volume, provider distribution, and reimbursement in the U.S. Medicare population from 1993 to 1999.
Radiology. 2002;225(3):723-729Luo X, Pietrobon R, Hey L.
Patterns and trends in opioid use among individuals with back pain in the United States.
Spine. 2004;29(8):884-890Cohen SB.
Design strategies and innovations in the Medical Expenditure Panel Survey.
Med Care. 2003;41(7):(suppl) iii5-III12Cohen JW, Monheit AC, Beauregard KM, et al.
The Medical Expenditure Panel Survey: a national health information resource.
Inquiry. 1996;33(4):373-389Medical Expenditure Panel Survey.
Agency for Healthcare Research and Quality
http://www.meps.ahrq.gov/mepsweb
Accessed May 18, 2007Medical Expenditure Panel Survey: survey questionnaires —
Household Component.
Agency for Healthcare Research and Quality Web site.
http://www.meps.ahrq.gov/mepsweb/survey_comp/survey.jsp
Accessibility verified January 17, 2008Cherkin DC, Deyo RA, Loeser JD.
Use of the International Classification of Diseases (ICD-9-CM) to identify hospitalizations for mechanical low back problems in administrative databases.
Spine. 1992;17(7):817-825Luo X, Pietrobon R, Sun SX, Liu GG, Hey L.
Estimates and Patterns of Direct Health Care Expenditures Among Individuals
With Back Pain in the United States
Spine (Phila Pa 1976) 2004 (Jan 1); 29 (1): 79–86Diehr P, Yanez D, Lin DY.
Methods for analyzing health care utilization and costs.
Annu Rev Public Health. 1999;20:125-144Barber JA, Thompson SG.
Analysis of cost data in randomized trials: an application of the non-parametric bootstrap.
Stat Med. 2000;19(23):3219-3236Strine TW, Hootman JM.
US National prevalence and correlates of low back and neck pain among adults.
Arthritis Rheum. 2007;57(4):656-665Katz S, Akpom CA.
Index of ADL.
Med Care. 1976;14(5):(suppl) 116-118Katz S.
Assessing self-maintenance: activities of daily living, mobility, and instrumental activities of daily living.
J Am Geriatr Soc. 1983;31(12):721-727Ware J Jr, Kosinski M, Keller SD.
A 12-Item Short-Form Health Survey: construction of scales and preliminary tests of reliability and validity.
Med Care. 1996;34(3):220-233Ware JE Jr, Kosinski M, Gandek B.
How to Score Version 2 of the SF-12® Health Survey.
Lincoln, RI: QualityMetric Inc; 2002Consumer Price Index calculator.
US Bureau of Labor Statistics Web site.
http://www.bls.gov/cpi/
Accessed December 7, 2007Chantala K.
Using Stata to Analyze Data From a Sample Survey.
Chapel Hill, NC: Carolina Population Center; 2001.
http://www.cpc.unc.edu/services/computer/presentations/
statatutorial/statasvy.pdf
October 1, 2001. Accessibility verified January 16, 2008StataCorp.
Stata Base Reference Manual, Release 9.
College Station, TX: Stata Press; 2005Population estimation tables.
U.S. Census Bureau Web site.
http://www.census.gov/popest/estimates.php
Accessed December 7, 2007Yelin E, Murphy L, Helmick CG.
Medical care expenditures and earnings losses of persons with arthritis
and other rheumatic conditions in 2003 with comparisons to 1997.
Arthritis Rheum. 2007;56(5):1397-1407NHLBI factbook: direct and indirect costs of illness
by major diagnosis, U.S. 2006.
National Heart, Lung and Blood Institute Web site
http://www.nhlbi.nih.gov/about/factbook/toc.htm
Accessed May 18, 2007Hogan P, Dall T, Nikolov P.
American Diabetes Association. Economic costs of diabetes in the US in 2002.
Diabetes Care. 2003;26(3):917-932American Heart Association.
Heart Disease and Stroke Statistics—2005 Update.
Dallas, TX: American Heart Association; 2005Grazier KL, Holbrook TL, Kelsey JL, Stauffer RN.
The Frequency of Occurrence, Impact, and Cost of Selected Musculoskeletal
Conditions in the United States.
Chicago, IL: American Academy of Orthopedic Surgeons; 1984:72-80Frymoyer JW, Durett CL.
The economic impact of spinal disorders.
In: Frymoyer JW, ed. The Adult Spine: Principles and Practice.
Vol 2. Philadelphia, PA: Lippincott-Raven; 1997Von Korff M, Deyo RA.
Potent opioids for chronic musculoskeletal pain: flying blind?
Pain. 2004;109(3):207-209Promoting pain relief and preventing abuse of pain medications:
a critical balancing act: a joint statement from 21 health organizations and the
Drug Enforcement Administration.
American Pain Society Web site.
http://www.ampainsoc.org/advocacy/promoting.htm
Accessed May 18, 2007The use of opioids for the treatment of chronic pain:
a consensus statement from American Academy of Pain Medicine and
American Pain Society.
American Pain Society Web site.
http://www.ampainsoc.org/advocacy/opioids.htm
Accessed May 18, 2007Savage SR, Joranson DE, Covington EC, Schnoll SH, Heit HA.
Definitions related to the medical use of opioids: evolution towards universal agreement.
J Pain Symptom Manage. 2003;26(1):655-667Zerzan JT, Morden NE, Soumerai S, et al.
Trends and geographic variation of opiate medication use in state Medicaid
fee-for-service programs, 1996 to 2002.
Med Care. 2006;44(11):1005-1010Weiner DK, Kim YS, Bonino P, Wang T.
Low back pain in older adults: are we utilizing healthcare resources wisely?
Pain Med. 2006;7(2):143-150Friedly J, Chan L, Deyo RA.
Increases in lumbosacral injections in the Medicare population, 1994 to 2001.
Spine. 2007;32(16):1754-1760Deyo RA, Gray DT, Kreuter W, Mirza SK, Martin BI.
United States trends in lumbar fusion surgery for degenerative conditions.
Spine. 2005;30(12):1441-1445Deyo RA, Mirza SK.
Trends and variations in the use of spine surgery.
Clin Orthop Relat Res. 2006;443:139-146Feuerstein M, Marcus SC, Huang GD.
National trends in nonoperative care for nonspecific back pain.
Spine J. 2004;4(1):56-63
Return to CHRONIC NECK PAIN
Since 3-21-2008

| Home Page | Visit Our Sponsors | Become a Sponsor |
Please read our DISCLAIMER |