

Visual Trajectory Pattern as
Prognostic Factors for Neck PainThis section is compiled by Frank M. Painter, D.C.
Send all comments or additions to: Frankp@chiro.org


FROM: European J Pain 2020 (Oct); 24 (9): 1752–1764 ~ FULL TEXT
OPEN ACCESS Birgitte Lawaetz Myhrvold • Pernille Irgens • Hilde Stendal Robinson
Kaia Engebretsen • Bĺrd Natvig • Alice Kongsted • Nina Křpke Vřllestad
Department of Interdisciplinary Health Sciences,
Institute of Health and Society,
University of Oslo,
Blindern, Oslo, Norway.
Background: A novel approach capturing both temporal variation and pain intensity of neck pain is by visual trajectory patterns. Recently, both previous and expected visual trajectory patterns were identified as stronger predictors of outcome than traditional measures of pain history and psychological distress. Our aim was to examine patient characteristics within the various previous and expected patterns, relationship between the two patterns and predictive value of a variable combining the previous and expected patterns.
Methods: Patients with neck pain (n = 932) consulting chiropractors were included. Baseline measures included pain intensity, disability, psychological variables and symptom history and expectations. Participants reported global perceived effect after 12 weeks. Analyses included descriptive statistics and logistic regression.
Results: Pain intensity, disability, psychological and worse outcome expectations increased from a single pain episode to severe ongoing pain of previous and expected patterns. Having a severe pain history was associated with poor prognosis, particularly if combined with negative expectations. The variable combining previous and expected patterns had a discriminative ability similar to that of other predictors AUC = 0.64 (95% CI = 0.60-0-67) versus AUC = 0.66 (95% CI = 0.62-0.70). The model with highest discriminative ability was achieved when adding the combined patterns to other predictors AUC = 0.70 (95% CI = 0.66-0.73).
Conclusion: The study indicates that pain expectations are formed by pain history. The patients' expectations were similar to or more optimistic compared with their pain history. The prognostic ability of the model including a simplified combination of previous and expected patterns, together with a few other predictors, suggests that the trajectory patterns might have potential for clinical use.
Significance: The dynamic nature of neck pain can be captured by visual illustrations of trajectory patterns. We report, that trajectory patterns of pain history and future expectations to some extent are related. The patterns also reflect a difference in severity assessed by higher degree of symptoms and distress. Moreover, the visual trajectory patterns predict outcome at 12-weeks. Since the patterns are easily applicable, they might have potential as a clinical tool.
From the FULL TEXT Article:
INTRODUCTION
Neck pain is a recurrent condition (Hogg-Johnson et al., 2008). People with neck pain have individual severity of disabilities causing physical and psychological challenges (DALYs & Collaborators, 2017; Hogg-Johnson et al., 2008; March et al., 2014). Identifying prognostic factors and prediction models is a way to provide a tool to assist more targeted clinical decision-making (Hemingway et al., 2013).
It is well documented that patients pain history and outcome expectations are strongly associated with prognosis for several musculoskeletal conditions (Burgess, Mansell, Bishop, Lewis, & Hill, 2020; Mallen et al., 2007; Mondloch et al., 2001; Myhrvold et al., 2019). In studies of musculoskeletal conditions, pain history is assessed traditionally as pain duration and/or number of previous episodes (Mallen et al., 2007). However, recent research shows that neck pain intensity vary over time (Ailliet, Rubinstein, Hoekstra, van Tulder, & de Vet, 2018; Irgens, 2020), an aspect that is not captured using traditional measures. An alternative is to use visual trajectories reflecting the temporal variation (recovering, episodic, fluctuating or ongoing) of the pain intensity (Kongsted et al., 2017). Thus, a more detailed picture of the pain history is captured.
Visual trajectories that illustrate patterns of pain are simple to use, both for capturing individual experience of the course of pain in the past, and for assessing individual expectations regarding the course of future pain (Dunn, Campbell, & Jordan, 2017). In a recent study, we updated a prediction model for neck pain patients by including patients’ self-reported visual trajectory pattern of neck pain the previous year and the expected pattern the following year (Myhrvold et al., 2019). These two variables had stronger association with outcome than traditional measures of pain history and psychological distress in a multivariable prediction model. However, the predictive probability of the model was most accurate in identifying people with a low chance of persistent pain (Myhrvold et al., 2019). To further improve the prediction model for neck pain, there is a need to understand the patient groups reporting the various patterns and how previous and expected pain patterns are related. Using traditional measures of pain history (e.g. pain duration and number of previous episodes), a previous paper found an association between pain history and expectations in patients with low back pain (Kongsted et al., 2014). Our recent finding of independent contributions of previous and expected pain patterns for outcome suggests that they complement each other with regard to prognosis. It is unknown whether there is an interaction between the visual trajectory pattern of previous and expected neck pain patterns.
Having observed that previous and expected visual trajectory patterns were strong predictors of neck pain, this study aimed to describe(1) baseline characteristics of patients reporting different previous and expected pain patterns,
(2) to examine how previous and expected pain patterns relate, and
(3) to investigate the prognostic ability of the combined previous and expected pain patterns when added to a set of previously identified predictors.
METHODS
Study design and setting
This study was part of a one-year observational cohort study on neck pain patients in chiropractic practice in Norway (Myhrvold et al., 2019). Patients can both be referred or self-referred to chiropractic treatment and qualify for partial refund from the Norwegian healthcare system.
Between September 2015 and May 2016, 71 Norwegian chiropractors were asked to consecutively invite all patients with neck pain to participate. The treatment strategy and follow-up time for each patient were the chiropractors’ decision and not part of this study. Regional Committee for Medical and Health Research Ethics approved the protocol (2015/89).
Patients with neck pain either as primary or secondary complaint, aged 18 or older, seeking care for the first time or already in a treatment course were invited. Patients should be able to read and write Norwegian, and to respond to short message service (SMS) on a mobile phone in the original observational study. We excluded patients with suspected inflammatory diseases, fractures or other systemic pathology, or with nerve root involvement requiring referral to surgery.
Data collection
All patients received oral and written information about the study from the chiropractor. Those who agreed to participate signed a written consent and were consecutively enrolled. The participants could choose between questionnaires on paper or electronically. If paper questionnaire was chosen the chiropractor provided this paper questionnaire at recruitment to the participants. The participants returned the paper questionnaires in a pre-paid envelope to the researchers. Participants choosing electronic questionnaires received an e-mail within two days with a link to the baseline questionnaire. Paper and electronic follow-up questionnaires were sent after 12 weeks. Non-responders had one written reminder within seven days followed by a phone call two weeks later.
Baseline data
Descriptive baseline characteristics included age, gender, education level (low = vocational school or lower secondary school, medium = University College or University under 4 years or upper secondary school/high school, high = University College or University lasting 4 years or more) and physical activity (yes [once or more a week], no [never or less than once a week]).
Characteristics of symptoms included duration of current episode (<1 month, 1–3 months, >3 months), previous episodes of neck pain (none first time, 1–3 times previously,> 3 times previously, I have more or less chronic neck pain), current pain intensity (NRS measured by a 0–10 numeric rating scale [0 = no pain; 10 = worst pain imagined]) (Von Korff et al., 2000), and functional status measured by the Neck disability index (NDI) (Vernon & Mior, 1991). NDI consists of 10 items about pain and function, each scored from 0 to 5, with a range of sum score 0–50 points where higher scores indicate higher degree of disability (Vernon & Mior, 1991). Pain that radiates into the shoulder and/or the elbow (yes/no).
Musculoskeletal comorbidity (number of MSK pain sites) was measured by the Nordic pain questionnaire (NPQ) counting musculoskeletal pain sites with a score from 0 to 10, where 0 = no pain sites and 10 = ten pain sites (Kuorinka et al., 1987). Psychological factors were measured by the Hopkins Symptom Checklist (HSCL-10), score ranging 1.00–4.00, where higher scores indicate higher levels of emotional stress (Derogatis, Lipman, Rickels, Uhlenhuth, & Covi, 1974; Strand et al., 2003) and kinesiophobia using one single question: “How much ‘fear’ do you have that these complaints would be increased by physical activity?” with a score from 0 = no fear, to 10 = very much fear, the response to this question relates well to the full Tampa score (Verwoerd et al., 2012).
Psychosocial risk factors were measured by the Örebro-screening questionnaire using a sum score ranging 0–100, where higher scores indicate higher risk of future work disabilities (Grotle, Vollestad, & Brox, 2006; Linton et al., 2011). Expectations were evaluated using one single question from the Örebro screening questionnaire: “In your view, how large is the risk that your current pain may become persistent?” With a score from 0 = no risk to 10 = very large risk (Grotle et al., 2006; Linton et al., 2011). General health status was measured by a 0–100 VAS scale, where 0 = worst health imagined and 100 = best health imagined (EuroQol, 1990).
Consultation type describes when in the course of neck pain patients were recruited. “First-time consultation” was used for patients recruited at the first visit for a new episode of neck pain, “follow-up consultation” was used for patients recruited during a clinical course of treatment, and “maintenance consultation” was used for patients visiting the chiropractor regularly according to an individual pre-planned schedule (Myburgh et al., 2013).
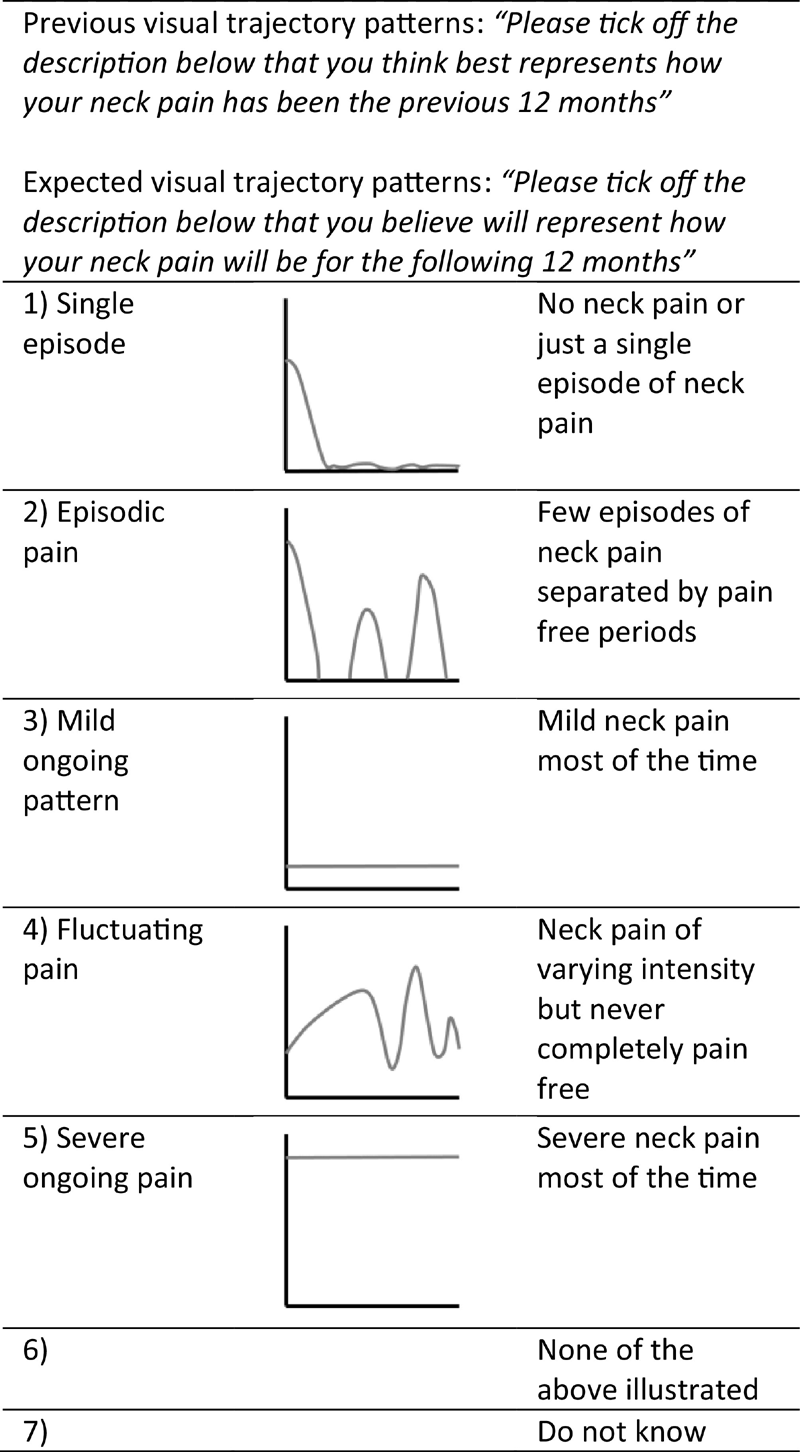
Figure 1 We asked patients to report their neck pain pattern the previous year and the pattern they expected for the following year. This was measured by the self-reported visual trajectory pattern questionnaire based on the existing literature of trajectory patterns (Kongsted et al., 2016). Specifically, the questionnaire had visual descriptions of five different neck pain patterns aiming to characterize patients’ neck pain the previous year (from now on called Previous pattern) and expected neck pain the following year (from now on called Expected pattern) (Figure 1). In addition, the questionnaire had the options of “None of the above” and “Do not know.”
Outcome
Follow-up at 12 weeks was chosen because improvement of symptoms seems to happen within the first weeks regardless of intervention or not (Kongsted et al., 2015; Nyiro et al., 2017; Vasseljen et al., 2013). Global Perceived Effect (GPE) was used as an outcome measure (Kamper et al., 2010). GPE is commonly used in clinical research as patient-reported outcome to determine the patient perspective of a successful outcome (Kamper et al., 2010). GPE was measured on a 7-point Likert scale (0 = recovered, 1 = much improved, 2 = slightly improved, 3 = no change, 4 = slightly worse, 5 = much worse and 6 = worse than ever).”Not sure” was added as an additional option. Scores were dichotomized into clinically important improvement (0–1) and non-improved (2–6), as these are considered clinically relevant (Dworkin et al., 2008). A priori, those answering “not sure” were categorized as non-improved as this was interpreted as neither better nor worse and therefore non-improved.
Data analyses
Baseline variables and GPE at 12 weeks are presented as frequencies and percentage or means with standard deviations (SD).
To check for potential impact of consultation types (being in ongoing care or not) descriptive analyses were stratified by consultation type.
Combining the Previous and Expected patterns into a subgroup variable
From the Previous and Expected patterns, we created a single variable (from now on called the subgroup variable) to use in regression analyses with GPE as outcome. The subgroup variable was constructed in two steps: first by dichotomizing the Previous and Expected pattern and second by combining these into the new subgroup variable of 4 categories.
Previous studies of trajectories of low back pain and neck pain have shown that reporting a history of Single episode, an Episodic or a Mild ongoing pain pattern is associated with less symptom severity, a better quality of life and a better outcome compared with the Fluctuating and Severe ongoing pattern (Ailliet et al., 2018; Dunn et al., 2017; Irgens, 2020; Kongsted et al., 2017; Pico-Espinosa et al., 2019). Hence, Previous patterns were dichotomized into Mild (Single episode, Episodic and Mild ongoing pain pattern) and Severe (Fluctuating and Severe ongoing pain pattern) pain history.
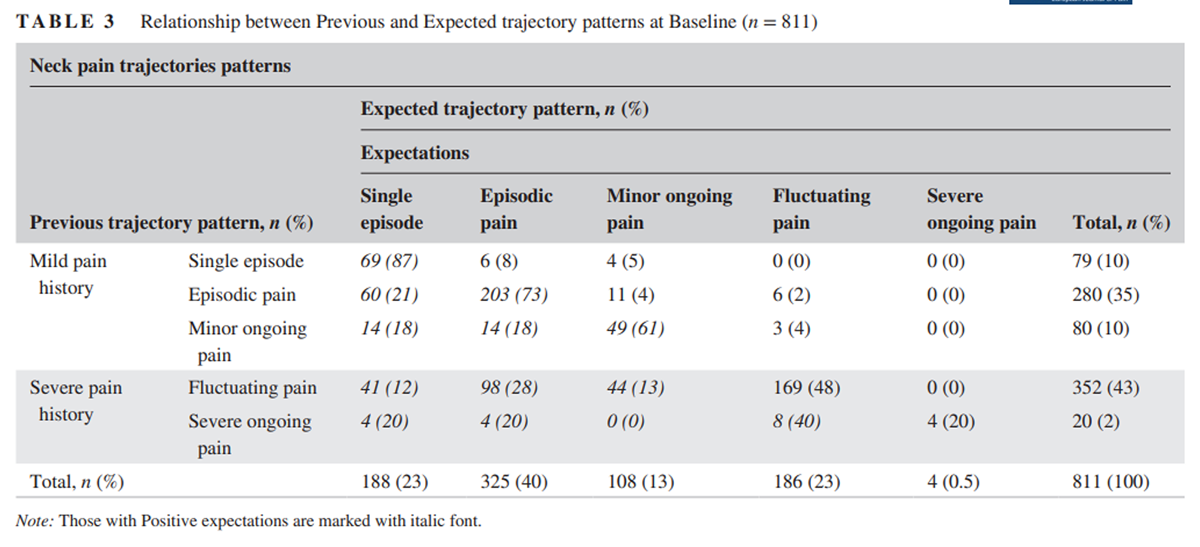
Expected patterns were classified as Positive, when a less severe pattern compared with the Previous pattern was reported. In addition, for those reporting a Mild pain history, expectations were Positive if the response was the same as for the Previous pattern. The Positive expectations are marked with italic font in Table 3. Expected patterns were classified as Negative, when a more severe pattern compared with the Previous pattern was reported. Furthermore, for those reporting a Severe pain history, expectations were Negative if the response was the same as the Previous pattern.
By combining the dichotomized Previous patterns (Mild or Severe) with Expected patterns (Positive or Negative), each participant was assigned one of four possible categories as follows: Mild-Positive, Mild-Negative, Severe-Positive and Severe-Negative.
Prognostic ability of the subgroup variable for outcome at 12 weeks
The association between the subgroup variable and GPE as outcome was tested by univariate logistic regression analysis and reported as odds ratios (OR) with 95% confidence interval (CI). Further, a multivariable logistic regression model was formed to test the association between GPE and a set of previously identified predictors consisting of: Radiating pain to shoulder/elbow, Education level, Consultation type, musculoskeletal comorbidity (number of MSK pain sites), Physical activity and the interaction term “number of MSK pain sites#Physical activity” (Myhrvold et al., 2019). The predictive capacity in terms of Area Under the ROC curve (AUC) of that model was compared to the AUC of the univariate model. Further, the additional predictive capacity of the subgroup variable when added to the known set of previously identified predictors was investigated by adding the subgroup variable to the set of previously identified predictors.
AUC tests the ability of the model to distinguish between improved or non-improved patients. An AUC = 0.5 indicates no predictive ability of the model, whereas an AUC = 1.0 indicates perfect discrimination (Moons et al., 2015; Steyerberg et al., 2010).
All analyses were carried out using Stata version 15.1 (StataCorp. Texas, USA).
RESULTS
Norwegian chiropractors recruited 1,476 patients with neck pain. In total 932 (71%) patients had completed both baseline and 12-week follow-up questionnaires and participated in the present study.
Baseline characteristics

Table 1
page 5
Table 2
page 8Our study sample consisted of 686 (74%) women and had a mean age of 45 (SD 13) years (Table 1). More than half of the patients were in maintenance care and almost two-thirds reported a duration of more than 3 months for the actual episode. Their pain intensity was 4.1 (SD 2.3) and the mean Örebro screening score was 39.9 (SD 15.0). No substantial differences were observed between the study sample and those lost to follow-up (Table 1).
Of the included patients, 97% and 88% were able to select a pattern describing their Previous or Expected pattern, respectively. The majority of patients characterized their Previous pattern as either Fluctuating (43%) or Episodic (33%) (Table 1). For the Expected pattern, the most frequent patterns were Episodic (35%), Fluctuating (22%) and Single episode (20%) (Table 2).
There was considerable variation in characteristics of patients within the different Previous and Expected patterns (Table 1 and 2). For both patterns, there was a tendency of higher education level in patients with Single episode and lower education level in those with Severe ongoing pain. There were also tendencies with increasing age and proportion of women in the Fluctuation and Severe ongoing patterns. Likewise, for both patterns a trend from low severity in patients with Single episode to higher severity of patients with Severe ongoing pain was observed in all symptom and health aspects. Patients with Fluctuating and Severe ongoing pain patterns reported higher pain intensity and they experienced a longer duration of their neck pain. They also reported more radiating pain to shoulder/elbow and several previous episodes or more or less chronic pain more often as compared to Single episode and Episodic patterns. In addition, a trend of higher baseline scores of NDI, HSCL-10, kinesiophobia, expectations and Örebro screening questionnaire across patterns from Single episode to Severe ongoing pain also indicated a difference in severity regarding psychological variables. Self-reported general health showed a decreasing trend from Single episode to Severe ongoing pain.
A high frequency of maintenance consultation was seen among all the patterns. The highest frequency of maintenance consultation was observed in those reporting Fluctuating and Severe ongoing pain of Expected patterns. Stratification by consultations type revealed no substantial differences of results and is not presented.
Relationship between Previous and Expected patterns
Table 3 Table 3 shows the frequencies of response to the individual patterns. Altogether, 494 (61%) reported the exact same Expected as Previous pattern. Of these, 321 reported mild condition in both Previous and Expected pattern and 173 reported severe condition in both Previous and Expected pattern.
The Single episode pattern showed the highest resembling of selecting the same Expected as Previous patterns (87% expecting the same pattern) while Severe ongoing pain showed the lowest resembling (20%). The majority of those with a mild Previous pattern chose a similar or more positive Expected pattern (n = 409), while only half (n = 181) of those with a severe Previous pattern chose a similar or more negative Expected pattern. Those with different responses in Expected compared to Previous pattern, most often reported a more positive Expected pattern (n = 279), whereas very few (n = 34) reported a more negative Expected pattern.
As the objectives of this study included exploring the relationship between identified patterns it was a priori decided to exclude those not able to report a Previous or Expected pattern (“Do not know” or “None of the above illustrated”). However, no substantial differences were observed between the excluded 130 participants and the study sample or those lost to follow-up.
The Mild-Positive category included 409 (50%) participants, whereas the Mild-Negative category included only 30 (4%). The Severe-Positive category included 199 (24%) participants, and the Severe-Negative category included 173 (21%). There was a trend towards higher severity in all symptom and health aspects across the Mild-Positive category to the Severe-Negative category (File S1).
Prognostic ability of subgroup categories for outcome at 12 weeks
At 12 weeks, 495 patients (47%) of the total study sample were non-improved with GPE as outcome. In total, 35% of the participants in the Mild-Positive and 27% in the Mild-Negative categories categorized themselves as non-improved. This was a smaller proportion as compared to the Severe-Positive and Severe-Negative categories where only 48% and 67% participants reported to be non-improved, respectively.
Table 4
page 9The Severe-Positive or Severe-Negative categories showed a statistically significant higher OR for non-improvement compared with the Mild-Positive category (AUC = 0.64, 95% CI = 0.60–0.67) (Table 4). When adding the subgroup variable to a set of previously identified predictors, the higher OR for non-improvement in Severe-Positive or Severe-Negative categories remained statistically significant (AUC = 0.70, 95% CI = 0.66–0.73).
The discriminative performance of the model that included only previously identified predictors was slightly higher than that of the subgroup variable alone with an AUC (95% CI) = 0.66 (0.62–0.70). The highest AUC was found by including both the subgroup variable and previously identified predictors, AUC (95% CI) = 0.70 (0.66–0.73).
DISCUSSION
The study showed that both the Previous and Expected visual trajectory patterns were associated with an increase in severity across the patterns, where the more severe patterns present with more psychological stress and higher symptom severity at baseline. In addition, patients’ expectations were largely related to pain history, indicating that expectations are, at least partly, formed by previous pain experience. Still, a substantial number of participants reported more positive expectations for the future than they reported for the previous year. The independently predictive effect of Previous and Expected patterns on outcome remained significant when combining the patterns into one subgroup variable. The combined patterns had predictive value, also when added to other previously identified predictors.
The patients reporting Fluctuating or Severe ongoing patterns had more pronounced symptom histories and psychological stress compared to those reporting a Single episode or Episodic pain patterns. Similar results were reported for patients with low back pain with a severity grade across patterns for the previous year (Dunn et al., 2017). Therefore, it seems that the various patterns are related to severity in symptoms, health conditions and psychosocial factors. Yet, within each pattern, there was a large variation.
Studies on neck and low back pain show that expectations regarding improvement is high (Bishop, Bialosky, & Cleland, 2011; Skatteboe et al., 2017b). By using visual measures, we found that the majority of patients expected a similar or improved condition in the coming year compared with the previous year.
To our knowledge, no studies have previously used visual trajectory patterns to assess expectations. However, our results are in line with a previous study on low back pain showing association between pain history (assessed by the duration of pain and number of previous episodes) and a single question for recovery expectations (Kongsted et al., 2014). In contrast, a recent study including both neck and low back pain did not find an association between expectations and duration of current pain (Bishop, Mintken, Bialosky, & Cleland, 2019). One possible reason for the different results may be methodological differences in how expectations are assessed. As recurrence and chronicity of neck pain is high, it is reasonable to suggest that questions of future expectations should include this aspect (Ailliet et al., 2018; Irgens, 2020). The visual patterns represent a nuanced way of reporting temporal aspects of pain whereas questions of expectation and pain assessed by numeric scales ask about expectations of recovery at one given time point and current (or short-term) pain intensity.
It was not part of this study to examine the relation between expectations assessed by visual patterns and numeric scales. However, an increased severity of expectations assessed by scale was observed across expected visual patterns (from Single episode to Severe ongoing pain). It would be relevant, in future studies, to investigate whether expectations and pain history assessed by visual patterns as compared to traditional measures of numeric scales are better ways to evaluate recovery expectations and duration, respectively.
Since expectations and pain history are associated, as well as being independent predictors of outcome, we used a subgroup variable formed by combining the Previous and Expected patterns (Kongsted et al., 2014; Myhrvold et al., 2019). This subgroup variable represented 4 categories of the mild/severe Previous and positive/negative Expected patterns. The subgroup variable was strongly associated with the prognosis. Patients with a mild history generally had positive expectations, whereas patients with a severe previous pattern differed in their expectations and had a poorer outcome in case of negative expectations. This is in line with other studies reporting an association between severe pain history, higher psychological distress, and less favourable prognosis (Bruls, Bastiaenen, & de Bie, 2015; Dimitriadis, Kapreli, Strimpakos, & Oldham, 2015; Hill et al., 2007; O'Neill et al., 2020). Our findings of visual pain history and expectations are consistent with a previous study using traditional measures; however, different populations, methods and settings were studied (Kongsted et al., 2014).
We found that the predictive accuracy of GPE were moderate for both the model including only the subgroup variable formed by combining the Previous and Expected patterns and the model including only a set of previously identified predictors. However, inclusion of both the subgroup variable and the set of previously identified predictors resulted in a higher discriminative ability. This model includes a small number of variables easily assessed, and could therefore have clinical application.
Strengths and limitations
Strengths of our study include the prospective longitudinal design, a high response rate and large sample size. Due to our broad inclusion criteria, we believe this study sample represents a typical distribution of patients in chiropractic practice with different degrees of neck pain, although we cannot exclude selection bias. Another strength is the method of including visual trajectory patterns, which easily can be replicated in future studies or used in clinical practice.
The validity of visual trajectory patterns used in this study has not been investigated. A published validated version of visual patterns exists and would be preferable to use, but this version was not available at the time of our data collection (Dunn et al., 2017). Since our trajectory question was very similar to the validated visual patterns and were used in a similar context, we believe the participants understood the questions and responses were trustworthy.
We realize that a longer follow-up than 12 weeks could have been favourable. However, a trajectory study of chiropractic patients showed that the majority of those who recovered from pain followed a similar pattern with a stable recovery pattern after the first weeks (Kongsted et al., 2015). The outcome measure GPE evaluates aspects of improvement, including symptoms, activity limitations and social functioning (Dworkin et al., 2008). Continuous scales are recommended in prognostic research as they improve statistical analysis and capture more nuances (Steyerberg et al., 2013). However, our binary definition of improvement is commonly used in studies and considered relevant and easily applicable in clinical practice (Dworkin et al., 2008). By dichotomizing the Previous and Expected patterns, we wanted to achieve a manageable number of subgroups in the analyses and avoid very low numbers in the subgroups. However, dichotomizing GPE and the Previous and Expected patterns may have resulted in loss of information.
Future implications
Our findings might facilitate future prognostic research of neck pain by the novel methods of measuring pain history and expectations. We found an alignment of previous pain history and expectations, and that a combination of these led to a new factor showing an association with outcome. This is in line with other studies showing that both an unfavourable pain history and having pessimistic expectations are of importance in predicting poor outcome (Bishop, Mintken, Bialosky, & Cleland, 2013; Kongsted et al., 2014; McDevitt et al., 2018; Mondloch et al., 2001; Myhrvold et al., 2019; Skatteboe et al., 2017a). However, based on AUC of the 3 presented prediction models, the prognostic information explained by the 4 categories appears to supplement other prognostic factors. The prognostic value of Previous and Expected patterns should be further explored with regard to different outcome measures and a longer follow-up. In addition, an external validation of the model is needed before implementation in clinical practice.
Expectations are potentially modifiable, and targeting this factor may have potential clinical value in musculoskeletal conditions (Skatteboe et al., 2014). Our findings showed that having optimistic expectations improve outcome as compared to pessimistic expectations regardless of pain history severity. Information of the Previous and Expected patterns is easily collected at baseline. Using the visual patterns as “prognostic profiles” in clinical practice may be valuable to tailor treatment strategies with regard to targeting modifiable predictors such as expectations. Clinicians should be observant during consultations with patients describing a severe past history and negative expectations to the future, as these patients may be more challenging with regard to a good prognosis.
We only tested GPE as outcome and do not know if visual patterns predict other utilized core patient-reported outcomes such as pain, impairment and disability (Fennelly, Blake, Desmeules, Stokes, & Cunningham, 2018). Different defined outcomes like symptoms, functions or health-related quality of life should be tested for visual patterns. The limitation that traditional measures of pain history do not capture the time-varying aspect of neck pain may also account for a standardized outcome measured at only a single time point reflecting a snapshot of time (Green et al., 2018). It is arguable whether standardized outcomes, measured only at a single time point, reveals true improvement or just a symptom-free period of a recurrent pattern.
CONCLUSION
Patients who had severe neck pain patterns also reported more severe baseline characteristics, although variations within patterns were large. We found that most patients’ expectation for the future was similar to or more optimistic compared with their pain history. Patients with a severe pain history had poor prognosis as compared to patients with a mild pain history, and most markedly so if in addition they had negative expectations. The predictive ability of the different models suggests a small additive effect of the combined Previous and Expected patterns. However, the simplification of combining the patterns, together with previously identified predictors, improves the potential of the prediction model to identify patients at highest risk of poor outcome. Eventually, the improved prediction model might be of value in the management of neck pain patients.
CONFLICTS OF INTEREST
No conflicts of interest exist for any author.
AUTHORS’ CONTRIBUTIONS
All authors were involved in developing the design of the study. BLM and PI collected, prepared and cleaned the data. BLM did the statistical analysis. BLM and NKV wrote the first draft. All authors also contributed by revising the article critically and improving the final version. BLM and PI had full access to all of the data in the study and take responsibility for the integrity of the data and the accuracy of the data analysis. Written permission has been obtained from all participants.
References:
Ailliet L, Rubinstein SM, Hoekstra T, van Tulder MW, de Vet HCW.
Long-term Trajectories of Patients with Neck Pain and
Low Back Pain Presenting to Chiropractic Care:
A Latent Class Growth Analysis
European J Pain 2018 (Jan); 22 (1): 103–113Bishop, M. D., J. E. Bialosky and J. A. Cleland (2011).
Patient Expectations of Benefit from Common Interventions for Low
Back Pain and Effects on Outcome: Secondary Analysis of a
Clinical Trial of Manual Therapy Interventions
J Man Manip Ther. 2011 (Feb); 19 (1): 20–25Bishop, M. D., Mintken, P. E., Bialosky, J. E., & Cleland, J. A. (2013).
Patient expectations of benefit from interventions for
neck pain and resulting influence on outcomes.
Journal of Orthopaedic and Sports Physical Therapy, 43(7), 457–465.
https://doi.org/10.2519/ jospt.2013.4492Bishop, M. D., Mintken, P., Bialosky, J. E., & Cleland, J. A. (2019).
Factors shaping expectations for complete relief from symptoms
during rehabilitation for patients with spine pain.
Physiother Theory Pract, 35(1), 70–79.
https://doi.org/10.1080/09593 985.2018.1440676Bruls, V. E., Bastiaenen, C. H., & de Bie, R. A. (2015).
Prognostic factors of complaints of arm, neck, and/or shoulder:
A systematic review of prospective cohort studies.
Pain, 156(5), 765–788.
https:// doi.org/10.1097/j.pain.0000000000000117Burgess, R., Mansell, G., Bishop, A., Lewis, M., & Hill, J. (2020).
Predictors of functional outcome in musculoskeletal healthcare:
An umbrella review.
European Journal of Pain, 24(1), 51–70.
https:// doi.org/10.1002/ejp.1483Derogatis, L. R., Lipman, R. S., Rickels, K. (1974).
The hopkins symptom checklist (HSCL):
A self-report symptom inventory.
Behavioral Science, 19(1), 1–15.
https://doi. org/10.1002/bs.3830190102Dimitriadis, Z., Kapreli, E., Strimpakos, N., & Oldham, J. (2015).
Do psychological states associate with pain and disability
in chronic neck pain patients?
J Back Musculoskelet Rehabil, 28(4), 797–802.
https://doi.org/10.3233/BMR-150587Dunn, K. M., Campbell, P., & Jordan, K. P. (2017).
Validity of the Visual Trajectories Questionnaire for Pain
J Pain 2017 (Dec); 18 (12): 1451–1458Dworkin, R. H., Turk, D. C., Wyrwich, K. W., Beaton, D. (2008).
Interpreting the clinical importance of treatment outcomes
in chronic pain clinical trials: IMMPACT recommendations.
The Journal of Pain: Official Journal of the American Pain Society, 9(2), 105–121.
https://doi. org/10.1016/j.jpain.2007.09.005EuroQol, G. (1990).
EuroQol–a new facility for the measurement of health-related quality of life.
Health Policy, 16(3), 199–208.
https:// doi.org/10.1016/0168-8510(90)90421-9Fennelly, O., Blake, C., Desmeules, F., Stokes, D., & Cunningham, C. (2018).
Patient-reported outcome measures in advanced
musculoskeletal physiotherapy practice:
A systematic review.
Musculoskeletal Care, 16(1), 188–208.
https://doi.org/10.1002/msc.1200Green, D. J., Lewis, M., Mansell, G., Artus, M., Dziedzic, K. (2018).
Clinical course and prognostic factors across different musculoskeletal
pain sites: A secondary analysis of individual patient data
from randomised clinical trials.
European Journal of Pain, 22(6), 1057–1070.
https://doi. org/10.1002/ejp.1190Grotle, M., Vollestad, N. K., & Brox, J. I. (2006).
Screening for yellow flags in first-time acute low back pain:
Reliability and validity of a Norwegian version of
the Acute Low Back Pain Screening Questionnaire.
Clinical Journal of Pain, 22(5), 458–467.
https://doi. org/10.1097/01.ajp.0000208243.33498.cbProf Theo Vos, PhD, Abraham D Flaxman, PhD, Mohsen Naghavi, PhD, et. al.
Global, Regional, and National Disability-adjusted Life-years (DALYs)
for 333 Diseases and Injuries and Healthy Life Expectancy (HALE) for
195 Countries and Territories, 1990–2016: A Systematic Analysis
for the Global Burden of Disease Study 2016
Lancet. 2017 (Sep 16); 390 (10100): 1260–1344Hemingway, H., Croft, P., Perel, P., Hayden, J. A. (2013).
Prognosis research strategy (PROGRESS) 1:
A framework for researching clinical outcomes.
BMJ, 346, e5595.
https://doi.org/10.1136/bmj.e5595Hill, J. C., Lewis, M., Sim, J., Hay, E. M., & Dziedzic, K. (2007).
Predictors of poor outcome in patients with neck pain treated by physical therapy.
Clinical Journal of Pain, 23(8), 683–690.
https:// doi.org/10.1097/AJP.0b013e3181468e67Hogg-Johnson, S., van der Velde, G., Carroll, L. J. et al (2008).
The Burden and Determinants of Neck Pain in the General Population:
Results of the Bone and Joint Decade 2000–2010 Task Force
on Neck Pain and Its Associated Disorders
Spine (Phila Pa 1976). 2008 (Feb 15); 33 (4 Suppl): S39–51Irgens, P., Myhrvold, B. L., Kongsted, A., Waagan, K., Engebretsen, K. (2020).
Neck pain subgrouping based on long-term weekly SMS-based defined trajectories.
Results not yet published.Kamper, S. J., Ostelo, R. W., Knol, D. L., Maher, C. G., de Vet, H. C. (2010).
Global Perceived Effect scales provided reliable assessments of health
transition in people with musculoskeletal disorders, but
ratings are strongly influenced by current status.
Journal of Clinical Epidemiology, 63(7), 760–766 e761.
https://doi.org/10.1016/j.jclinepi.2009.09.009Kongsted A, Hestbaek L, Kent P.
How Can Latent Trajectories of Back Pain be Translated into Defined Subgroups?
BMC Musculoskelet Disord. 2017 (Jul 3); 18 (1): 285Kongsted A, Kent P, Axen I, Downie AS, Dunn KM.
What Have We Learned From Ten Years of Trajectory Research in Low Back Pain?
BMC Musculoskelet Disord. 2016 (May 21); 17 (1): 220Kongsted, A, Kent, P, Hestbaek, L, and Vach, W.
Patients With Low Back Pain Had Distinct Clinical Course Patterns
That Were Typically Neither Complete Recovery Nor Constant Pain.
A Latent Class Analysis of Longitudinal Data
Spine J. 2015 (May 1); 15 (5): 885–894Kongsted, A., Vach, W., Axř, M., Bech, R.N., Hestbaek, L., Kongsted, A. (2014).
Expectation of Recovery from Low Back Pain: A Longitudinal Cohort
Study Investigating Patient Characteristics Related to Expectations
and the Association Between Expectations and 3-month Outcome
Spine (Phila Pa 1976). 2014 (Jan 1); 39 (1): 81–90Kuorinka, I., Jonsson, B., Kilbom, A., Vinterberg, H., BieringSřrensen, F. (1987).
Standardised Nordic questionnaires for the analysis of musculoskeletal symptoms.
Appl Ergon, 18(3), 233–237.
https://doi.org/10.1016/0003- 6870(87)90010-xLinton, S. J., Nicholas, M., & MacDonald, S. (2011).
Development of a short form of the orebro musculoskeletal pain screening questionnaire.
Spine (Phila Pa 1976), 36(22), 1891–1895.
10.1097/ BRS.0b013e3181f8f775.Mallen, C. D., Peat, G., Thomas, E., Dunn, K. M., & Croft, P. R. (2007).
Prognostic factors for musculoskeletal pain in primary care:
A systematic review.
British Journal of General Practice, 57(541), 655–661.
https://www.ncbi.nlm.nih.gov/pubmed/17688762.March, L., Smith, E. U. R., Hoy, D. G., Cross, M. J., Sanchez-Riera, L. (2014).
Burden of Disability Due to Musculoskeletal (MSK) Disorders
Best Pract Res Clin Rheumatol. 2014 (Jun); 28 (3): 353–366McDevitt, A. W., Mintken, P. E., Cleland, J. A., & Bishop, M. D. (2018).
Impact of expectations on functional recovery in
individuals with chronic shoulder pain.
J Man Manip Ther, 26(3), 136–146.
https:// doi.org/10.1080/10669817.2018.1432541Mondloch, M. V., Cole, D. C., & Frank, J. W. (2001).
Does how you do depend on how you think you'll do? A systematic review
of the evidence for a relation between patients'
recovery expectations and health outcomes.
CMAJ, 165(2), 174–179. Retrieved from
https:// www.ncbi.nlm.nih.gov/pubmed/11501456.Moons, K. G. M., Altman, D. G., Reitsma, J. B., Ioannidis, J. P. A. (2015).
Transparent Reporting of a multivariable prediction model for Individual
Prognosis or Diagnosis (TRIPOD): Explanation and elaboration.
Annals of Internal Medicine, 162(1), W1–73. https:// doi.org/10.7326/M14-0698Myburgh, C., Brandborg-Olsen, D., Albert, H., & Hestbaek, L. (2013).
The Nordic Maintenance Care Program: What Is Maintenance Care?
Interview Based Survey of Danish Chiropractors
Chiropractic & Manual Therapies 2013 (Aug 20); 21: 27Myhrvold, B. L., Kongsted, A., Irgens, P., Robinson, H. S. (2019)
Broad External Validation and Update of a Prediction Model
for Persistent Neck Pain After 12 Weeks
Spine (Phila Pa 1976). 2019 (Nov 15); 44 (22): E1298–E1310Nyiro, L., Peterson, C. K., & Humphreys, B. K. (2017).
Exploring the Definition of «Acute» Neck Pain: A Prospective Cohort
Observational Study Comparing the Outcomes of Chiropractic Patients
with 0-2 Weeks, 2-4 Weeks and 4-12 Weeks of Symptoms
Chiropractic & Manual Therapies 2017 (Aug 16); 25: 24O'Neill, A., O'Sullivan, K., O'Keeffe, M., Walsh, C., & Purtill, H. (2020).
The change of pain classes over time: A latent transition analysis.
European Journal of Pain, 24(2), 457–469.
https://doi. org/10.1002/ejp.1502Pico-Espinosa OJ, Cote P, Hogg-Johnson S, Jensen I, Axen I, Holm LW, et al.
Trajectories of Pain Intensity Over 1 Year in Adults
With Disabling Subacute or Chronic Neck Pain
Clinical J Pain 2019 (Aug); 35 (8): 678–685Skatteboe, S., Roe, C., Fagerland, M. W., & Granan, L. P. (2014).
Expectations for treatment outcomes in neck/back patients regarding
improvements in pain and function. A cross-sectional pilot study.
European Journal of Physical and Rehabilitation Medicine, 50(6), 649–656.
https://www.ncbi.nlm.nih.gov/pubmed/24755775.Skatteboe, S., Roe, C., Fagerland, M. W., & Granan, L. P. (2017a).
Expectations of pain and functioning in patients with
musculoskeletal disorders: A cross-sectional study.
BMC Musculoskeletal Disorders, 18(1), 48.
https://doi.org/10.1186/s12891-016-1386-zSkatteboe, S., Roe, C., Fagerland, M. W., & Granan, L. P. (2017b).
The influence of expectations on improvements in pain and function
in patients with neck/back/shoulder complaints: A cohort study.
Eur J Phys Rehabil Med, 53(6), 936–943.
https://doi.org/10.23736/S1973 -9087.17.04608-1Steyerberg, E. W., Moons, K. G. M., van der Windt, D. A. (2013).
Prognosis research strategy (PROGRESS) 3: Prognostic model research.
PLoS Med, 10(2), e1001381.
https://doi.org/10.1371/journal.pmed.1001381Steyerberg, E. W., Vickers, A. J., Cook, N. R., Gerds, T. (2010).
Assessing the performance of prediction models:
A framework for traditional and novel measures.
Epidemiology, 21(1), 128–138.
https://doi.org/10.1097/ EDE.0b013e3181c30fb2Strand, B. H., Dalgard, O. S., Tambs, K., & Rognerud, M. (2003).
Measuring the mental health status of the Norwegian population:
A comparison of the instruments SCL-25, SCL-10, SCL-5 and MHI-5 (SF-36).
Nordic Journal of Psychiatry, 57(2), 113–118.
https://doi. org/10.1080/08039480310000932Vasseljen, O., Woodhouse, A., Bjorngaard, J. H. (2013).
Natural course of acute neck and low back pain in the general population:
The HUNT study.
Pain, 154(8), 1237–1244.
https://doi. org/10.1016/j.pain.2013.03.032Vernon H, Mior S (1991)
The Neck Disability Index: A Study of Reliability and Validity
J Manipulative Physiol Ther 1991 (Sep); 14 (7): 409–415Verwoerd, A. J., Luijsterburg, P. A., Timman, R., Koes, B. W. (2012).
A single question was as predictive of outcome as the Tampa Scale for
Kinesiophobia in people with sciatica: An observational study.
Journal of Physiotherapy, 58(4), 249–254.
https://doi.org/10.1016/S1836-9553(12)70126-1Von Korff, M., Jensen, M. P., & Karoly, P. (2000)
Assessing global pain severity by self-report in clinical and health services research.
Spine, 25(24), 3140–3151.
10.1097/00007632-200012150-00009.
Return to CHRONIC NECK PAIN
Return to SPINAL PAIN MANAGEMENT
Since 9-12-2023
| Home Page | Visit Our Sponsors | Become a Sponsor |
Please read our DISCLAIMER |