

Patients With Low Back Pain Had Distinct Clinical Course
Patterns That Were Typically Neither Complete Recovery
Nor Constant Pain. A Latent Class Analysis
of Longitudinal DataThis section is compiled by Frank M. Painter, D.C.
Send all comments or additions to: Frankp@chiro.org


FROM: Spine J. 2015 (May 1); 15 (5): 885–894 ~ FULL TEXT
Alice Kongsted, PhD, Peter Kent, PhD,
Lise Hestbaek, PhD, Werner Vach, PhD
The Nordic Institute of Chiropractic and Clinical Biomechanics,
Campusvej 55,
5230 Odense M,
Denmark
a.kongsted@nikkb.dk.
BACKGROUND CONTEXT: The clinical presentation and outcome of patients with nonspecific low back pain (LBP) are very heterogeneous and may be better understood by the recognition of reproducible subgroups. One approach to subgrouping is the identification of clinical course patterns (trajectories). However, it has been unclear how dependent these trajectories are on the analytical model used and the pain characteristics included.
PURPOSE: To identify LBP trajectories using LBP intensity and frequency measured once a week over 1 year and compare the results obtained using different analytical approaches.
STUDY DESIGN: A prospective observational cohort study.
PATIENT SAMPLE: Patients presenting with nonspecific LBP to general practitioners and chiropractors.
OUTCOME MEASURES: Weekly self-report of LBP intensity (0–10) and the number of LBP days measured by short message service cell phone questions over a 1–year follow-up period.
METHODS: Latent class analysis was used to identify the trajectories of LBP and 12 different analytical models were compared. The study was a component of a broader study funded by an unrestricted grant from the Danish Chiropractors' Foundation (USD 370,000).
RESULTS: The study included 1,082 patients. The 12 models resulted in 5 to 12 subgroups, with a number of trajectories stable across models that differed on pain intensity, number of LBP days, and shape of trajectory.
CONCLUSIONS: The clinical course of LBP is complex. Most primary care patients do not become pain-free within a year, but only a small proportion reports constant severe pain. Some distinct patterns exist which were identified independently of the way the outcome was modeled. These patterns would not be revealed by using the simple summary measures traditionally applied in LBP research or when describing a patient's pain history only in terms of duration. The appropriate number of subgroups will depend on the intended purpose of subgrouping.
KEYWORDS: Latent class analysis; Low back pain; Musculoskeletal pain; Primary health care; Prognosis; Trajectory
From the FULL TEXT Article:
Introduction
Low back pain (LBP) is a poorly understood condition with considerable negative consequences for global health. [1] A small proportion of patients severely affected by LBP account for most health- and disability-related costs [2], whereas other people with LBP report no care seeking, activity limitation, or sick leave. [3] Consequently, LBP is a highly diverse condition and there is a need for better understanding of the mechanisms underlying this heterogeneity.
Our understanding of the heterogeneity in LBP and its consequences would be assisted by detailed knowledge about the prognosis of LBP [4] and about the factors associated with the transition from trivial to burdensome LBP. However, in LBP, the general (group average) prognosis does not apply to many individuals and only a little of the variance in population-averaged outcomes has been explained in predictive models. [5] One way of better understanding how LBP patients differ from each other is to explore the differences in their clinical course (LBP trajectory).
Subgroups based on LBP trajectories have previously been identified in studies of six different cohorts. [6–11] Five of these used some sort of computerized subgrouping technique [6–9, 11] and described four to five distinct LBP trajectories. Within these studies, substantial differences between the identified subgroups indicate that the traditional use of only a population-averaged clinical trajectory may be limiting, or even distorting, our understanding of LBP. One cohort was followed twice for 6 months with a 7–year period in between, and the LBP trajectory of most participants was the same despite the 7–year period between measurements. Thus, trajectories may provide some insight into a likely life course pattern rather than only about a given LBP episode. [12]
Although similar numbers of subgroups were found across the cohorts, only some characteristics of the identified trajectory patterns were comparable. This may have been because of actual differences between cohorts or because of differences in outcome measures, timing of data collection, or analytical models. Thus, it is unclear whether some general patterns exist, and none of these previous studies used frequently collected data beyond 6 months follow-up. Also, previously identified trajectories were based on either pain frequency or pain intensity. Whether both elements uniquely contribute to differentiating characteristic LBP patterns has not been investigated. Moreover, the extent to which the subgrouping of LBP trajectories is dependent on how the outcome is modeled has not previously been explored.
Therefore, the objectives of this study were to gain insight into the clinical course of LBP by identifying in a combined cohort of two different groups of LBP patients: the trajectory patterns based on weekly measures of LBP frequency and intensity over a 1–year period and the degree to which these subgroups and their trajectories would vary when using different latent class analysis (LCA) models.
Methods
Patients were recruited for a longitudinal observational cohort study from 106 general practitioners and 36 chiropractors when presenting with LBP. All general practices (GPs) in the Region of Southern Denmark were invited to participate in a quality development initiative during 10 weeks of 2011 and to invite patients to take part in an observational study. The chiropractic clinics were a part of the research network of the Nordic Institute for Chiropractic and Clinical Biomechanics and recruited study participants from September 2010 to January 2012. General practice care in Denmark is fully covered by the national health insurance. Chiropractors are authorized by The Danish Health and Medicines Authority to diagnose and treat patients without referral, but only part of the costs (approximately 20%) are covered by the national health insurance. The cohort has been described in more detail previously. [13, 14] The Regional Ethics Committee for Southern Denmark was advised about the study and data collection, but according to Danish law, a study that does not contain invasive tests or interventions aimed at individuals does not require ethics approval. [15]
Participants
Potential participants were consecutive patients aged 18 to 65 years, consulting a health care provider for the first time due to their current episode of LBP, and who could read Danish. Patients were not included if inflammatory or pathologic pain was suspected or if they had nerve root involvement requiring acute referral to surgery. In the chiropractic cohort, patients were not included if they were pregnant or if they had attended more than one health-care consultation because of LBP within the previous 3 months. In addition, participants completing less than 10 of 52 weekly responses to short message service (SMS) questions were excluded from the analyses.
Data collection
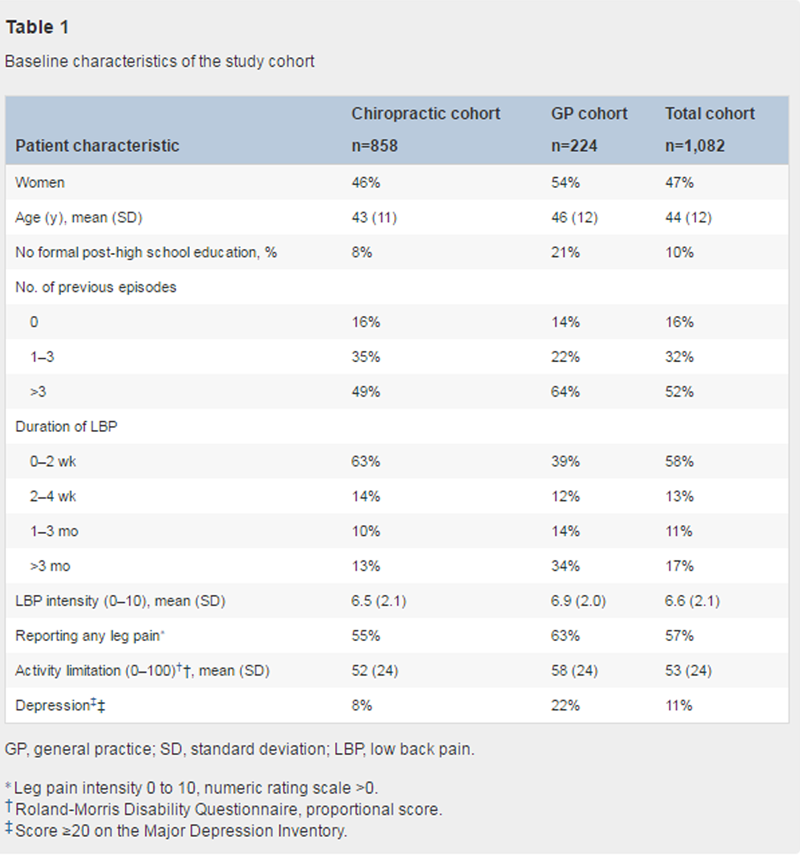
At baseline, a questionnaire was used to collect information on age, gender, education (no formal post-high school education, vocational training, higher education of <3 years, higher education of 3–4 years, higher education of >4 years), duration of the current LBP episode (0–2 weeks, 2–4 weeks, 1–3 months, or >3 months), number of previous LBP episodes (0, 1–2, 3, or more), LBP intensity (numeric rating scale [NRS] 0–10 [16]), leg pain intensity (NRS 0–10), activity limitation (proportional scores on the Roland-Morris Disability Questionnaire [RMDQ] 0–100 [17]), depressive symptoms (Major Depression Inventory sum score, with scores ≥20 classified as depressed [18, 19], and recovery expectations (0–10) [13] with 0 to 5 arbitrarily defined as low.
Follow-up questionnaires were sent by mail 2 weeks, 3 months, and 12 months after their baseline consultation. They included measures of global perceived improvement (seven-point scale from “much worse to much better” [20]) and the RMDQ. In addition, the 12–month questionnaire asked, using a nonvalidated question, which of the seven LBP scenarios the participant thought most likely to happen within the next 5 years. The listed scenarios were as follows: no LBP, episodic mild LBP, rather constant mild LBP, episodic LBP of varying intensity, rather constant LBP of varying intensity, episodic severe LBP, or rather constant severe LBP. The first two categories were interpreted to reflect an expectation of little future LBP.
Low back pain trajectories were based on a weekly follow-up collected by automated SMS questions sent to their cell phone. [21] This has previously been used for high-frequency clinical data collection [22] and been shown to have acceptable reliability. [23] The questions asked were: “How many days did you have low back pain during the last week? (one number between 0 and 7)” (hereafter referred to as “LBP days”) and “How intense was the pain typically on a scale from 0 to 10?” (hereafter referred to as “LBP intensity”). The second question was only asked if one or more days with LBP were reported in response to the first question. If a person reported zero LBP days, the intensity score was coded as zero.
Data analyses
No sample size calculation was performed since the approach was not hypothesis testing. The sample size was set to allow a reasonable description of subgroups including at least 5% of the sample.
The observed overall course of LBP was described in terms of the weekly mean and standard deviation (SD) of LBP intensity, the weekly mean (SD) of LBP days, and the weekly proportion (with 95% confidence interval) that was pain-free (NRS=0).
Subgroups were identified using LCA, which is one of the statistical tools that has been used to identify trajectories in longitudinal data. [24, 25] It has a number of advantages, including an ability to handle repeated data without prior data reduction or assumptions about which features are of importance for differentiating trajectories. [26] Latent class analysis identifies classes (subgroups) and describes for each subject how likely it is to belong to each of these classes. Classes are formed so within-class variation is minimized, whereas between-class variation is maximized as the LCA looks for the most likely model given the observed data.
The LCA was based on all the data points from participants responding to the follow-up in at least 26 of 52 weeks. The SMS data of those participants informed the subgroup formation, as each participant was given a case weight of 1.0 in the LCA. In contrast, the SMS data of participants with less than 26 responses did not affect the subgroup formation, as each was given a case weight of 0.001; however, they were subsequently assigned a posterior probability of belonging to a particular subgroup.
There is no generally accepted approach to the management of pain-related variables in LCA, and pain intensity and the number of days in pain represent different facets of the pain experience that can be classified in numerous ways. Acknowledging that the management of these variables can affect subgroup formation, 12 LCA models were investigated to determine how different the resulting subgroups and their trajectories would be.
The first six LCA cluster models were based on the variables:(i) LBP intensity 0 to 10,
(ii) LBP intensity 0 to 10 and LBP days 0 to 7,
(iii) categorical LBP intensity (0, 1–4, and 5–10) [6],
(iv) categorical LBP intensity and categorical days (0, 1–5, 6–7) [27],
(v) distribution-based categorical LBP intensity with three categories determined by the LCA program (in Week 1 the categorization of NRS was: 0–4, 5–6, 9–10; in Week 2: 0–2, 3–4, 5–10, and thereafter patients scoring LBP=0 generally formed a separate category, eg, in Week 10 the categories were: 0, 1–2, 3–10), and
(vi) distribution-based categorical LBP intensity and distribution-based categorical LBP days (categorization of days; Week 1: 0–4, 5–6, 7; Week 2: 0–2, 3–5, 6–7, and thereafter zero LBP days formed one category, eg, in Week 10: 0, 1–2, 3–7).Models (i) and (ii) were based on the assumption of a normal distribution with mean and variance specific for each week in each cluster. The other models were based on a multinomial distribution with parameters specific for each week in each cluster.
In addition, six LCA regression models were tested. Three models with SMS follow-up week as the predictor variable and the dependent variables including (vii) LBP intensity 0 to 10, (viii) categorical LBP intensity, or (ix) distribution-based categorical LBP intensity and three similar models (x–xii) in which the dependent variable included both LBP intensity and days. In all LC regression models, week2, log (1+week), exponential (week/52), and the square root of week were included to allow for nonlinear patterns. In the models that included both intensity and days, the regression parameters were estimated separately for each type of variable. The distributional assumption was normal with class-specific variance for (vii) and (x) and multinomial for the other models. When this article describes different “models,” it refers to these 12 different ways the outcome measures were used.
Each LCA model was repeated five times because a random start point in the LCA can produce different results. In LCA, the preferred solution is often chosen as the one with the lowest Bayesian information criterion (BIC). However with these data, the BIC kept lowering beyond a reasonable number of classes, and hence, we decided not to increase the number of classes within every repetition whenever the BIC decreased less than 1%. Across the five repetitions of each model, the one with the lowest BIC was chosen. Each individual was allocated to the subgroup that they had the highest posterior probability of belonging to and the subgroups of the 12 chosen solutions were given a clinically meaningful name based on the appearance of that subgroup's averaged trajectory and the individuals' trajectories within the subgroup (face validity). Individual curves and the observed, rather than the predicted, subgroup means were used when naming subgroups, although it is common practice to name latent classes based on predicted means. This approach was chosen to obtain more clinically relevant terms.
Across each of the 12 LCA models, subgroups were compared on baseline characteristics and LBP intensity and days during follow-up using indicator variables for each subgroup as the independent variables in linear or logistic regression models. Differences between subgroups in the course of activity limitation (RMDQ at baseline, 2 weeks, 3 months, and 12 months) were tested in longitudinal regression models using generalized estimating equations (independent variables: subgroup, week, subgroup×week, week2, and log [1+week]). All associations were adjusted for care setting.
The usefulness of the obtained subgroup solutions were evaluated by considering the face validity of trajectories, the explained variance in the measures used for subgroup formation, associations with baseline patient characteristics, and associations with other outcome measures collected alongside the SMS-tracking.
Latent class analysis was performed in LatentGOLD 4.5 (Statistical Innovations, Inc., Belmont, MA, USA) and other analyses in STATA/SE 12.1 (StataCorp LP, College Station, TX, USA). The likelihood approach of LCA accommodates the inclusion of subjects with missing values and therefore, no imputations were performed.
Results
Participants and response rates

Table 1 A total of 1,219 patients consented to participate. Baseline questionnaires were unavailable for 5 participants, 11 were not enrolled in the SMS-tracking for unknown reasons, and 121 (10%) provided fewer pain intensity scores than the minimum of 10 SMS follow-ups. Those excluded because of insufficient SMS follow-ups did not differ significantly from the study cohort regarding age, baseline pain, activity limitation, episode duration, or number of previous episodes, but they were more often male (62% among excluded vs. 53% in the study cohort) and a larger proportion was excluded from the GP than from chiropractic practice (15% vs. 9%). The resulting study cohort included 1,082 participants (Table 1) of whom 87%, 85%, and 79% responded to follow-ups at 2 weeks, 3 months, and 12 months, respectively. Data were available from 92% of 56,264 SMS follow-ups (in 2%, only one SMS question was answered), with the highest response rate in Week 6 (96%) and the lowest in Week 52 (87%). Nonresponders to the 12–month questionnaire were younger and more often males compared with the responders. Their baseline and 2–week pain intensity did not differ from that of the responders. Twelve-month nonresponders who had participated at 3 months had higher LBP intensity at that time than the responders. The Spearman rho correlation between LBP intensity and days was 0.46 (p<.001) when only including weeks with any LBP and was substantially more (0.95) when including weeks with no pain.
Population averaged prognosis
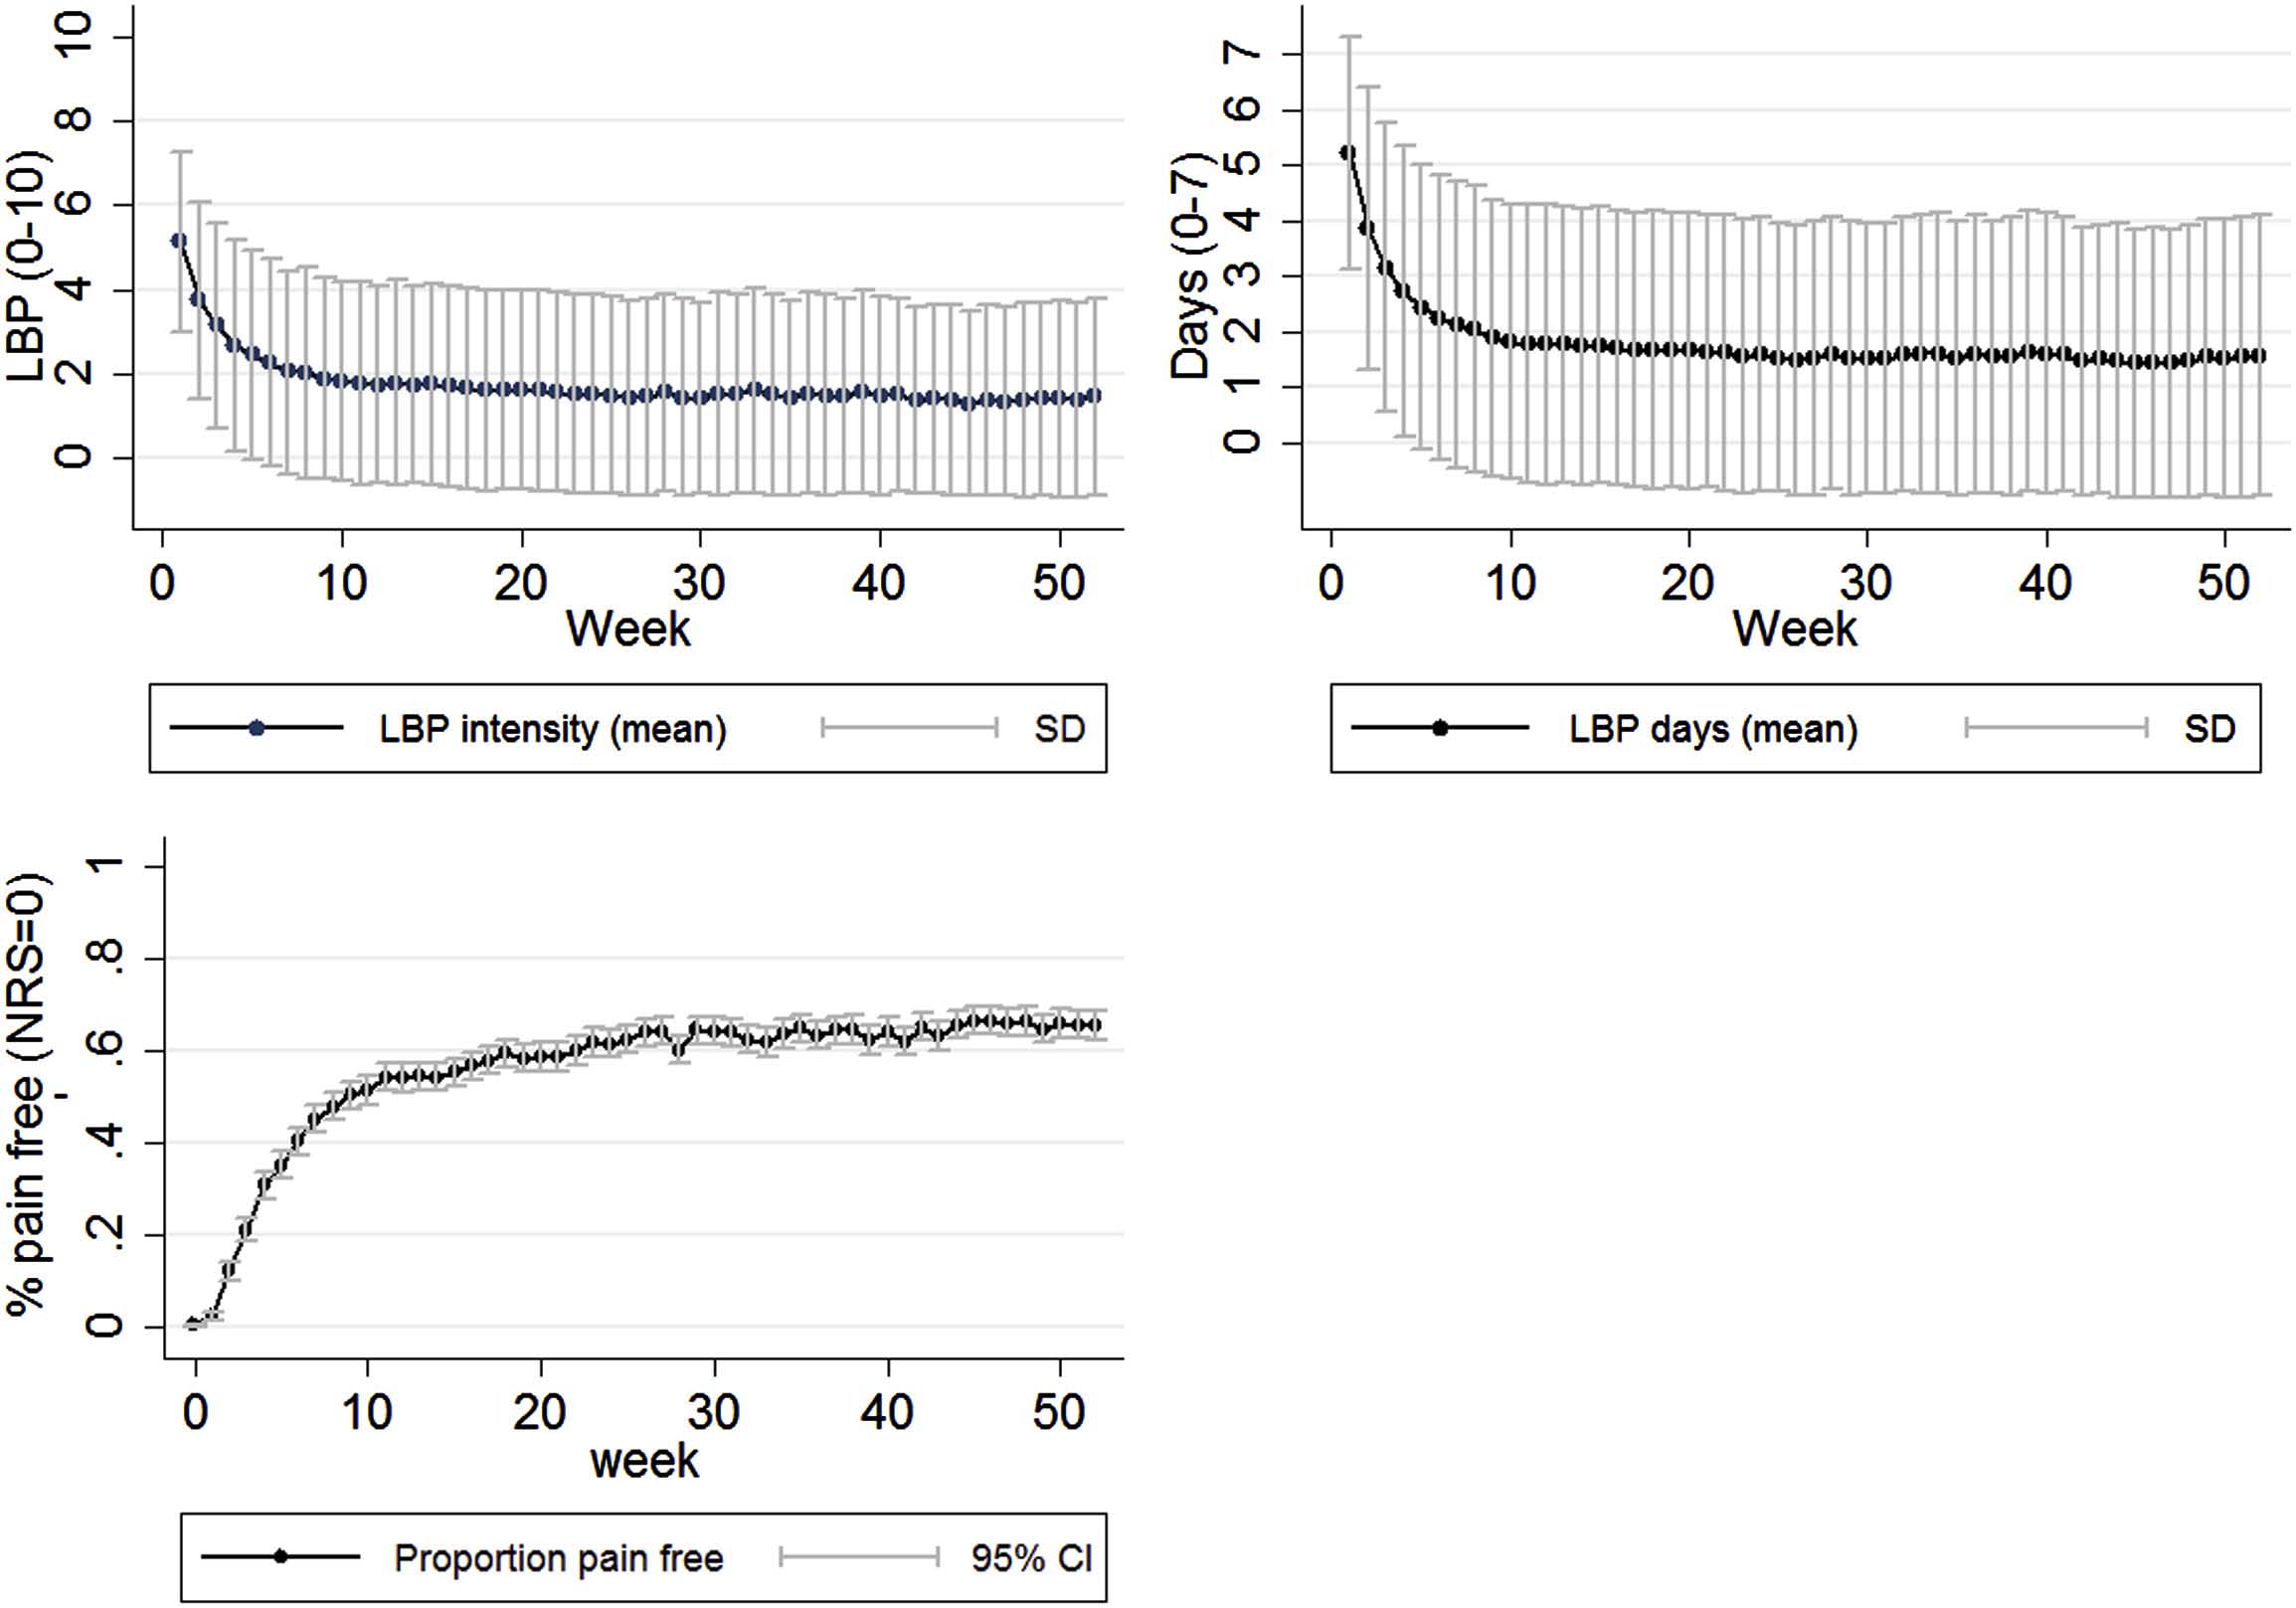
Figure 1
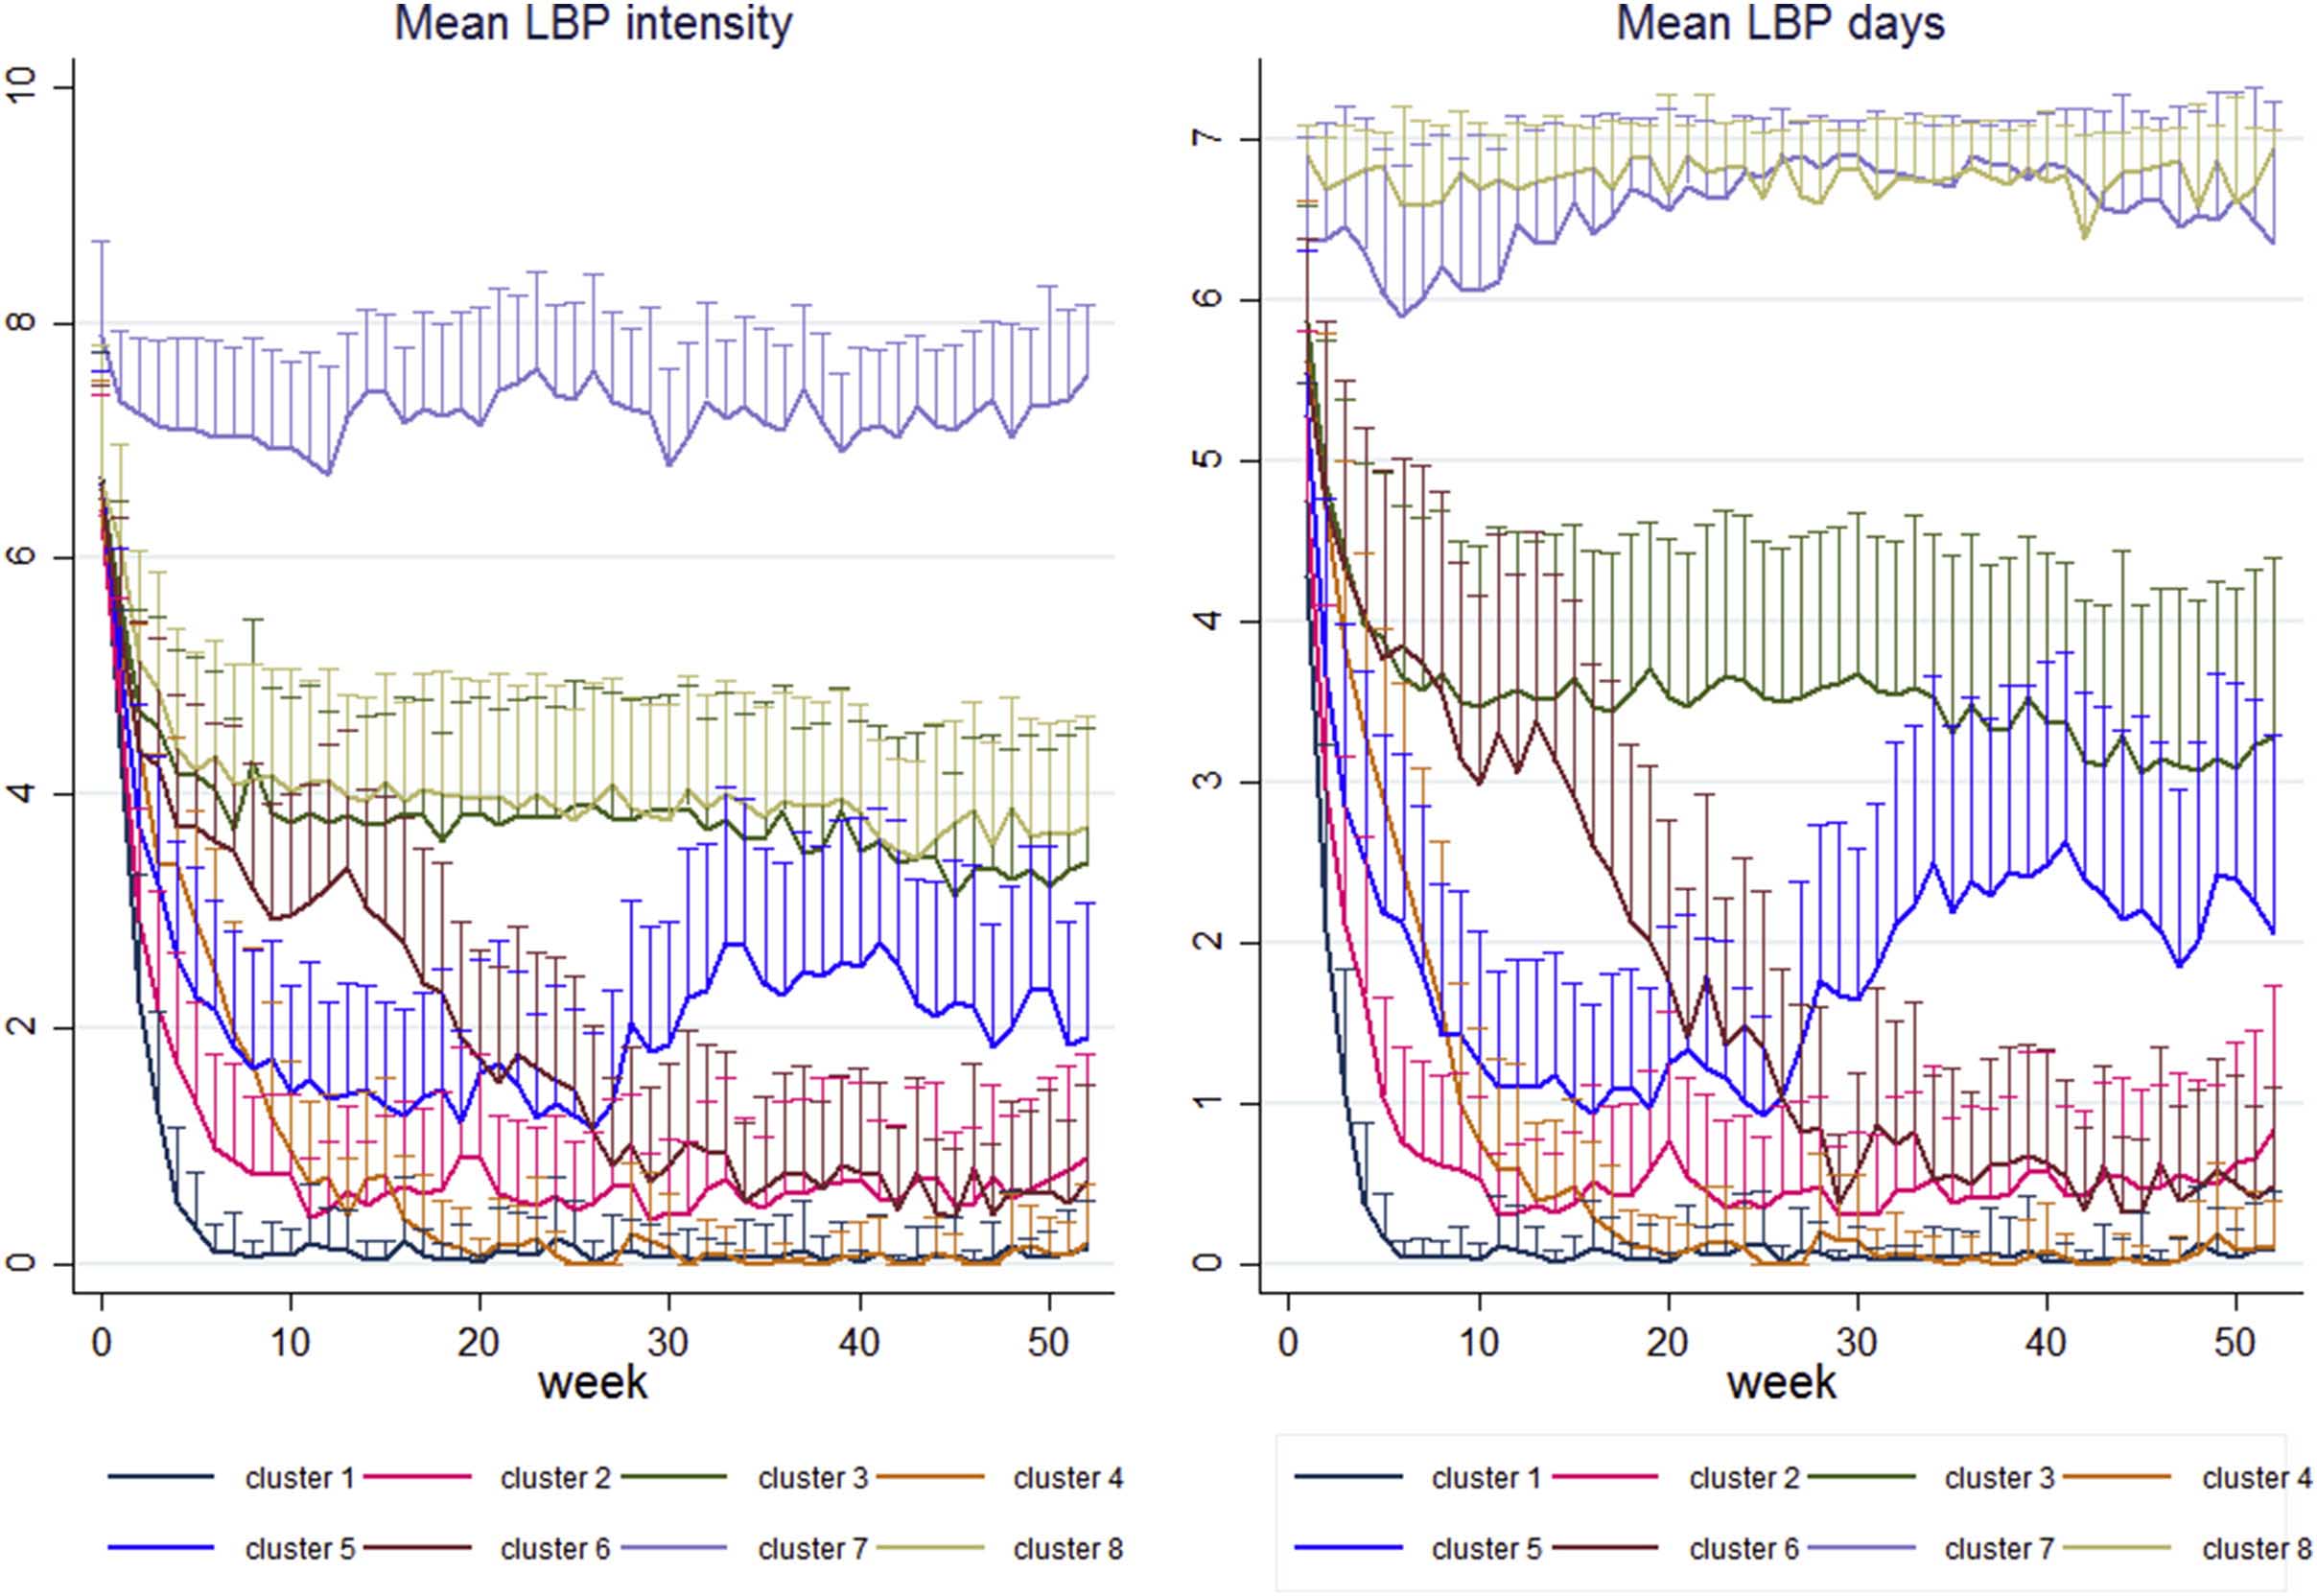
Figure 2
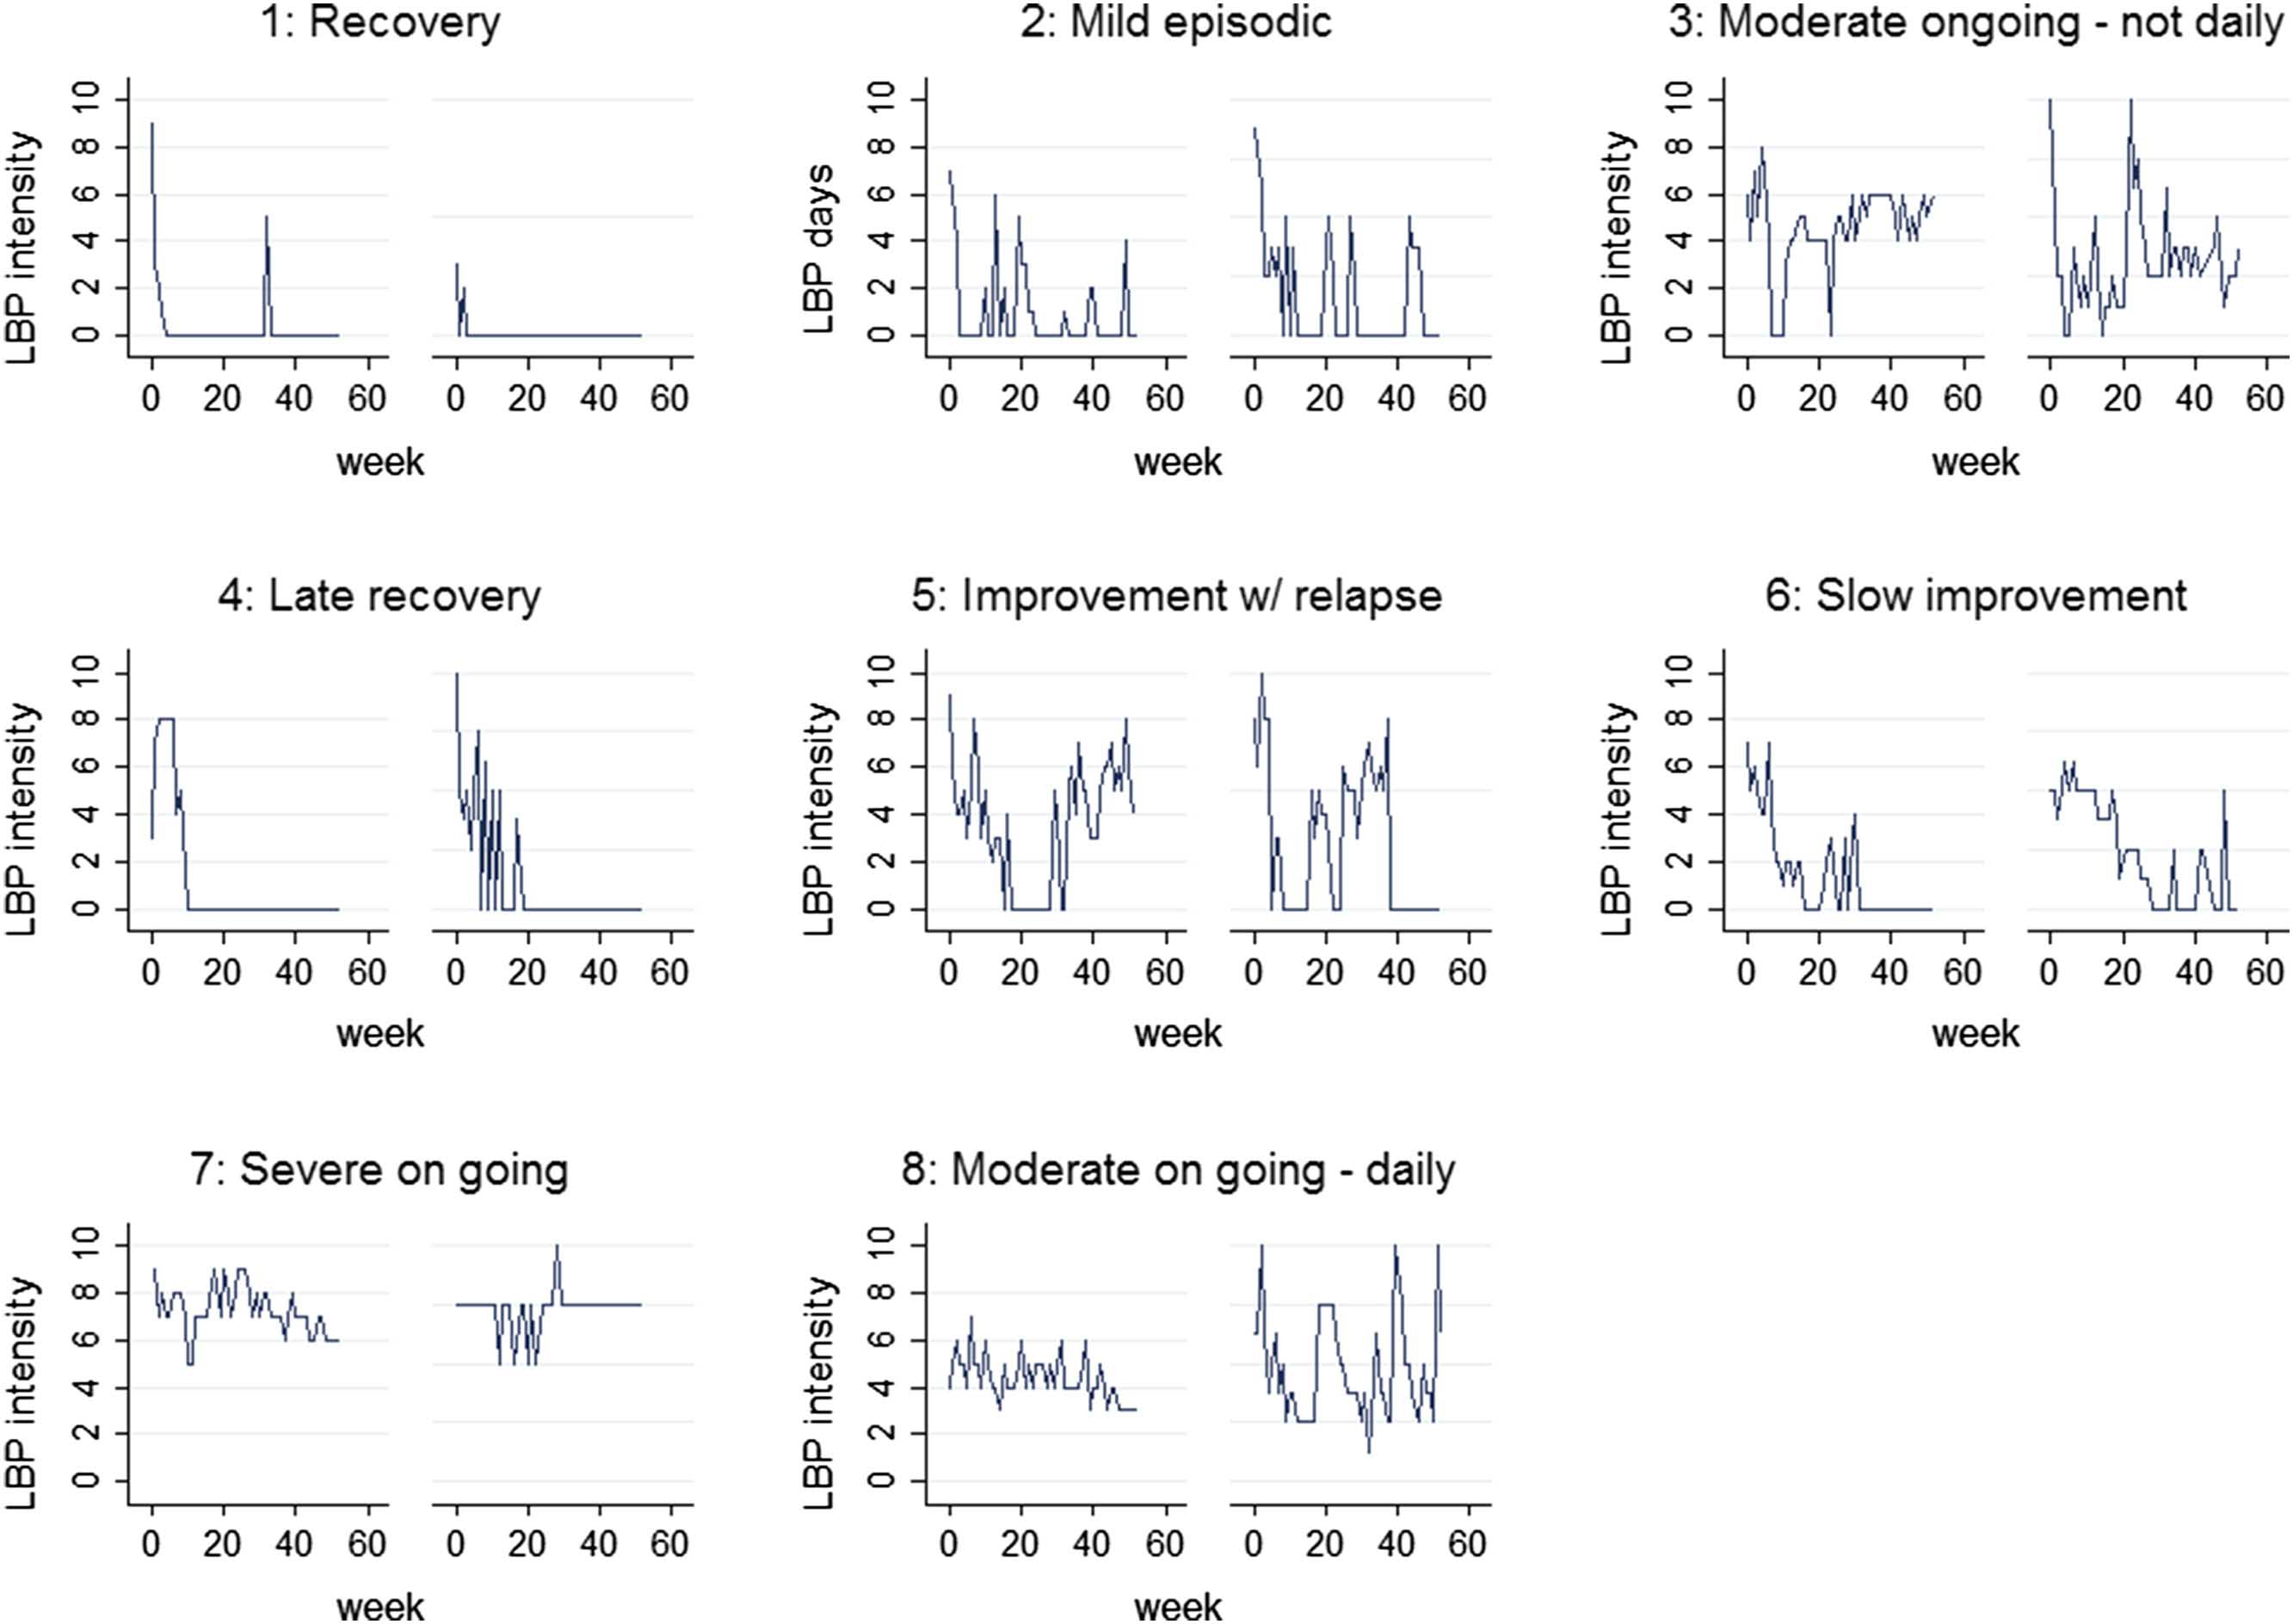
Figure 3 On average, LBP intensity and days declined over the first 10 weeks and remained almost unchanged thereafter (Figure 1). After Week 10, mean LBP intensity scores were 1.6 (SD 2.0) (chiropractic cohort: 1.3 [SD 1.7]; GP cohort: 2.9 [SD 2.5]) and a mean of 1.6 (SD 2.2) LBP days per week were reported (chiropractic patients: 1.3 [SD 1.9]; GP patients: 2.8 [SD 2.6]). The proportion of those who recovered from pain followed a similar pattern (Fig. 1). At the single time-point measurement of Week 52, 66% (95% confidence interval 62%–69%) of the total cohort was pain-free.
Identified subgroups
All subgroup solutions appeared clinically reasonable and distinctive in the sense that individuals had high posterior probabilities of belonging to one subgroup (in all models, less than 1% of subjects had a posterior probability below 50% of belonging to the subgroup they were assigned to [Appendix A]). From 5 to 12 subgroups were identified, with four of the models resulting in five subgroups and other four models in eight subgroups. As an example, Figures 2 and 3 present the subgroups of Model (iv), showing that subgroups differed on intensity, LBP days, and also on clinical course patterns.
The frequencies of the identified trajectory patterns differed between settings, and subgroups with early improvement or recovery were a larger part of the chiropractic sample than the GP sample, whereas patterns of sustained LBP were more frequent in GP (Fig. 2 and Appendix A). These differences between settings are merely descriptive as this study was not designed to investigate or test treatment effects.
Trajectory features across subgrouping models
Some of the main patterns identified by most models were descriptively labeled as: recovery, mild, moderate, or severe ongoing, episodic pain, slow improvement, and relapse. Details of the subgroups identified in the 12 models are described in Appendix A.
Ten models identified a recovery pattern that showed virtually no LBP after the first few weeks. The homogeneity of the recovered groups differed, as some models resulted in a distinction between very early recovery and recovery within a few weeks or between total recovery and recovery with some mild episodes during follow-up. Consequently, depending on the model, the proportion labeled recovery ranged between 17% and 37% (Models [i] and [iii]). At the other extreme, a group with severe ongoing LBP (mean intensity above 5) was identified by 9 of 12 models, with a prevalence between 4% (Models [i], [vii], [x], all with a mean LBP intensity of 8.1 [SD 0.9]) and 12% of the total cohort (Model [iii], mean LBP intensity of 6.8 [SD 1.2]).
Subgroups between the extremes recovery and severe ongoing were not consistently observed in all models. However, most models identified a subgroup characterized by slow improvement, ie, a gradual reduction in LBP severity and days that occurred over approximately 6 months. That subgroup usually included approximately 10% of the total cohort. Another pattern identified across most models was recovery or improvement followed by a relapse generally occurring after at least 6 months (Fig. 2, Fig. 3, Subgroup 5). Also, patterns of mild or moderate LBP were often identified, and in some models, split into subgroups labeled ongoing, fluctuating, and episodic pain (weeks with pain separated by pain-free periods, eg, Subgroup 2 in Fig. 2).
Subgroups that differed on LBP days but not distinctly on LBP intensity were identified in four of six models when introducing LBP days in the LCA. Subgroups 3 and 8 in Model (iv) (Fig. 2) with moderate ongoing pain had mean LBP intensities of 4.9 (SD 1.1) and 4.4 (SD 1.1), respectively, but on average 3.6 (SD 1.0) and 6.5 (SD 0.5) days with pain per week, respectively. Similarly, subgroups existed with the same number of LBP days but differed on LBP intensity (Fig. 2, Subgroups 7 and 8).
In summary, we found trajectories that differed on LBP intensity (recovery, mild, moderate, severe), course patterns (speed of improvement, degree of fluctuations, relapses) and the frequency of LBP (patients with the same typical pain intensity reporting daily or nondaily pain). The example in Fig. 2 illustrates the principal features of the subgroups. Trajectories of other models are illustrated in Appendix B.
Patient characteristics within subgroups
Table 2
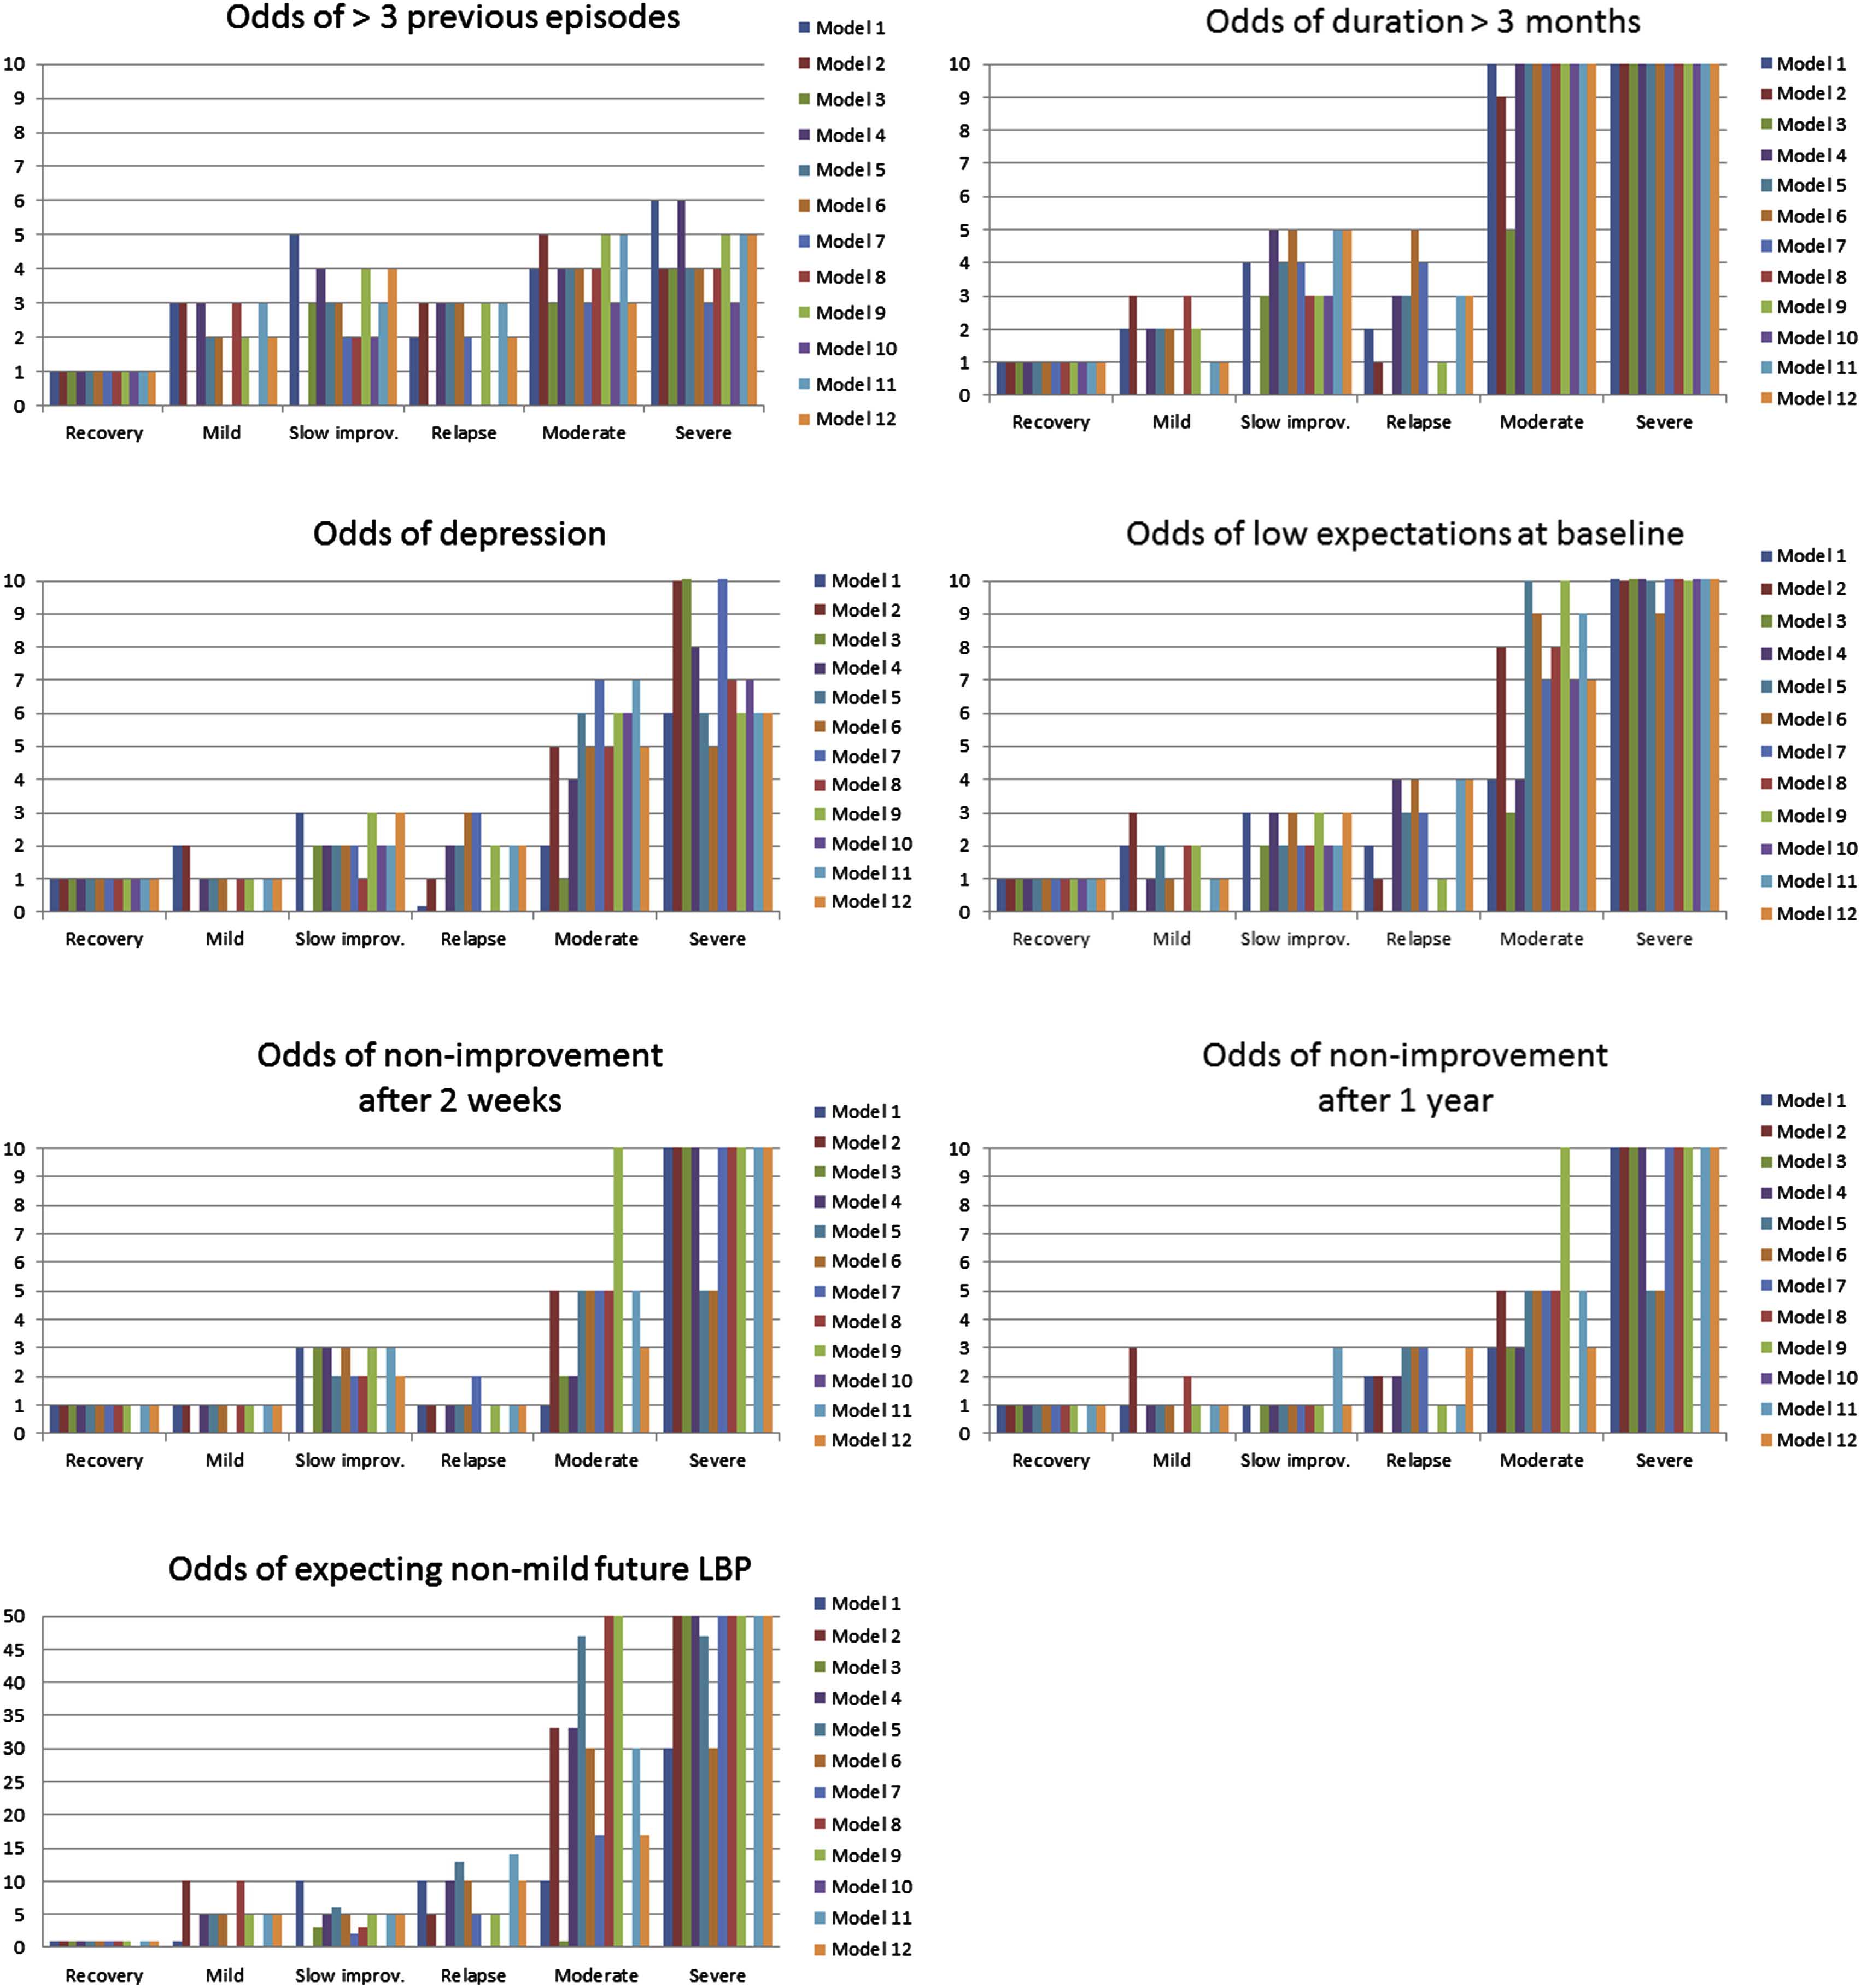
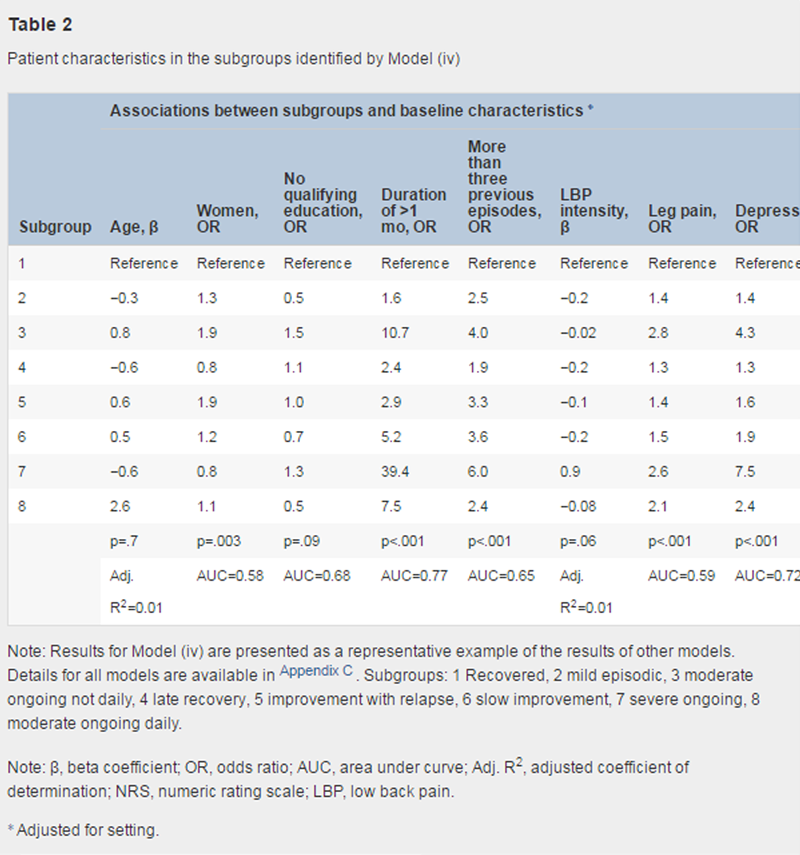
Figure 4 Associations between subgroups and patient characteristics were highly similar across models. Generally, subgroups were associated with gender, duration of LBP, number of previous episodes, leg pain, depression, and recovery expectations, although these had not influenced the subgroup formation (Table 2 and Appendix C). Subgroups were associated with baseline LBP intensity in 6 of 12 models and were not significantly associated with age (except in two models) or education. The direction of the associations was stable for subgroups labeled the same way across models. For example, the more severe patterns were systematically associated with longer duration, more previous episodes, leg pain, depression, and low recovery expectations (Figure 4). These observations underline that the subgroups identified by different LCA models were quite similar and they imply that the trajectory subgroups actually represent distinctly different patient profiles.
The subgroups explained 80% to 94% of the variance (adjusted R2) in mean LBP intensity. Models including LBP days in the LCA explained 73% to 95% of the variance in the number of LBP days, and models that were formed using only LBP intensity explained 68% to 81% of the variance in LBP days (Table 2 and Appendix C).
Associations with global perceived improvement at 2 weeks and 12 months were significant in all models in patterns congruent with subgroup labeling. For instance, subgroups with trajectories of moderate ongoing or severe ongoing pain had lower odds of improvement than other subgroups, both after 2 weeks and 12 months, whereas those with late recovery generally had lower odds of improvement compared with those recovered at 2 weeks but not after 12 months, and the opposite was observed for the relapse patterns (Fig. 4 and Appendix C). In addition, subgroups were strongly associated with expected future LBP at 12 months follow-up, indicating that patients with more severe trajectories were considerably less likely to have expectations of little future LBP. In all models, the associations with activity limitation had significant group and group×time effects (results not reported).
Choice of most useful model
The investigated models resulted in subgroup solutions that showed similarity in the main patterns of LBP trajectories. The models varied in how detailed their separation of trajectories was and thus, in the number of subgroups identified. However, no single model was clearly superior to the others when using the criteria of classification error, class size, the face validity of subgroups, and associations with patient characteristics and outcome.
Discussion
To the authors' knowledge, this study is the first to describe trajectories of LBP based on weekly measurements over a 1–year period, to include a measure of both pain intensity and frequency in the investigation of LBP trajectories, and to address the extent to which subgrouping of LBP trajectories depends on how the outcome is modeled.
The study identified LBP trajectories that were quite stable across different LCA models. Some distinct trajectories were identified by all LCA models and a higher number of subgroups identified in some models appeared to be mainly the result of some subgroups being split into subcategories. Whether subgroups should be split or not is a decision to be based on the specific situation.
The observed trajectories had similarities with those previously described in patients from primary care to the extent that subgroups differed on pain severity, speed of improvement, and clinical course patterns. [6, 8] However, our results, together with those previously reported, illustrate that weekly measures, as compared with monthly measures, allowed a distinction between different fluctuation patterns and between patterns with different rates of improvement in the early course. Also, the 1–year follow-up provided information regarding late recovery and relapses that could not be revealed with 6–month follow-ups, and we observed that using both LBP intensity and days identified subgroups with similar patterns of LBP intensity but different frequency and vice versa. It is not known the extent to which these findings would be similar for physiotherapy care settings, secondary care settings, or in other countries. In this study, all identified trajectories were present in both GP and chiropractic practice, and the similarity of published findings across different cohorts and in different settings suggests that the patterns may be universal. However, their prevalence is likely to differ between cohorts, similar to our observation that the trajectory patterns of early improvement were more frequent in the chiropractic cohort and the trajectories with sustained moderate or severe pain were more frequent in GP.
The existence of distinct LBP clinical course patterns implies that LBP is not well described by measuring outcome at only one or few points in time, by summarizing individual trajectories into a summary score, or by population means in longitudinal analyses. As an example, the trajectories labeled improvement with relapse and slow improvement in the present study did not differ on mean intensity or frequency during follow-up, but had markedly different clinical course patterns, and those slowly improving had almost twice as high odds of positive expectations regarding future LBP than those in the subgroup with the relapse pattern. The more detailed course description achieved by trajectories may be useful as predictors of individuals' future LBP as demonstrated in a study that compared individuals' 6–month trajectories measured twice with 7 years in between. [12] Trajectory patterns may also be more sensitive and more clinically relevant outcomes than the single time-point measures and summary scores that have traditionally been used, especially in the context of a recognition that most patients do not “recover” from LBP, if recovery is defined as being pain-free for a sustained period of time.
To make use of knowledge about patterns in the clinical course of LBP, we need a way to be able to work with these across populations, including in small data sets and clinical settings in which LCA is not applicable. A possible next step in operationalizing knowledge about common trajectories in LBP is to mathematically or conceptually describe them in ways that can be readily applied to other data sets in research settings or to individuals in clinical settings. Perhaps such descriptions will need to be on a qualitative/semiquantitative level if they are to be easily applicable where measurement instruments and timing are similar, but not identical, to the ones we used. Having transformed latent classes into measurable variables, these should be subsequently tested as prognostic factors and also for their usefulness as outcome measures.
In the interpretation of the findings of this study, some methodologic issues should be noted. We recognize that other theoretically more appropriate clustering techniques exist for longitudinal data, such as latent class growth analysis, latent class growth mixture modeling, and sequence analysis. However, as LCA was able to detect distinctly different patterns, we find it questionable that better results would be achieved by allowing more complex modeling. This was supported by previous head-to-head comparisons of methods. [25] It should be noted that in our cohort, the proportion of patients in each subgroup might not be truly representative of primary care since, for logistical reasons, we were not able to recruit every consecutive patient and any selection bias relative to the source population was unknown. This is the case in most primary care cohort studies and we have no reason to believe that any unusual selection biases existed in this study. On the other hand, the large sample from the two different settings, the response rate, and the detailed outcome measures strengthened the study. The study was founded by the Danish Chiropractors' Foundations. Since it had no capacity to influence with the scholarly conduct of the research, interpretation of results, or the dissemination of study outcomes, we do not believe there is a potential source of bias in the study's funding.
In conclusion, the clinical course of LBP is complex. Over a 1–year follow-up period, most patients did not become pain-free for a sustained period, but at the other end of the spectrum, only a small proportion reported persistent severe pain. Some distinct patterns existed that were identified independently of how the outcome measure was modeled by LCA. These patterns would not be evident when using traditional single time-point measures of LBP or when describing a patient's LBP history only in terms of duration. It is still not evident what implications the identification of such patterns have, but potentially this subgrouping approach may improve clinical prediction and guide targeted interventions. The current implication for clinicians and researchers is to be aware that most LBP does not simply go away and that the averaged course of LBP does not reflect most individual patients' trajectories.
Acknowledgments
The study obtained financial support from the Danish Chiropractors' Foundation (grant number 01/1624 ). The authors would like to thank the chiropractors in the “KIP” research network and the participating general practitioners for their participation in data collection. We also thank “APO Odense” for establishing the contact with general practitioners. The Nordic Institute of Chiropractic and Clinical Biomechanics is financed by the Danish Chiropractors' Foundation, which also supports Alice Kongsted's position at University of Southern Denmark and partly supports Peter Kent's position.
Supplementary data
References:
Vos T, Flaxman AD, Naghavi M, Lozano R, Michaud C, et al.:
Years Lived with Disability (YLDs) for 1160 Sequelae of 289 Diseases and Injuries 1990-2010:
A Systematic Analysis for the Global Burden of Disease Study 2010
Lancet. 2012 (Dec 15); 380 (9859): 2163–2196Maetzel, A. and Li, L.
The economic burden of low back pain: a review of studies published between 1996 and 2001.
Best Pract Res Clin Rheumatol. 2002; 16: 23–30Leboeuf-Yde, C., Fejer, R., Nielsen, J., Kyvik, K.O., and Hartvigsen, J.
Consequences of Spinal Pain: Do Age and Gender Matter? A Danish Cross-sectional
Population-based Study of 34,902 Individuals 20-71 Years of Age
BMC Musculoskelet Disord. 2011 (Feb 8); 12: 39Hemingway, H., Croft, P., Perel, P., Hayden, J.A.,
Abrams, K., Timmis, A. et al.
Prognosis research strategy (PROGRESS) 1: a framework for researching clinical outcomes.
BMJ. 2013; 346: e5595Hayden, J.A., Dunn, K.M., van der Windt, D.A., and Shaw, W.S.
What is the prognosis of back pain?.
Best Pract Res Clin Rheumatol. 2010; 24: 167–179Dunn KM, Jordan K, Croft PR.
Characterizing the Course of Low Back Pain: A Latent Class Analysis
American J Epidemiology 2006 (Apr 15); 163 (8): 754–761Tamcan, O., Mannion, A.F., Eisenring, C.,
Horisberger, B., Elfering, A., and Muller, U.
The course of chronic and recurrent low back pain in the general population.
Pain. 2010; 150: 451–457Axen I, Bodin L, Bergstrom G, Halasz L, Lange F, Lovgren PW, Rosenbaum A.
Clustering Patients on the Basis of Their Individual Course of Low Back Pain Over a Six Month Period
BMC Musculoskelet Disord. 2011 (May 17); 12: 99Chen, C., Hogg-Johnson, S., and Smith, P.
The recovery patterns of back pain among workers with compensated occupational back injuries.
Occup Environ Med. 2007; 64: 534–540Kongsted, A. and Leboeuf-Yde, C.
The Nordic Back Pain Subpopulation Program: Individual Patterns of
Low Back Pain Established by Means of Text Messaging:
A Longitudinal Pilot Study
Chiropractic & Osteopathy 2009 (Nov 17); 17: 11Macedo, L.G., Maher, C.G., Latimer, J.,
McAuley, J.H., Hodges, P.W., and Rogers, W.T.
Nature and determinants of the course of chronic low back pain over a 12-month period: a cluster analysis.
Phys Ther. 2014; 94: 210–221Dunn, K.M., Campbell, P., and Jordan, K.P.
Long-term Trajectories of Back Pain: Cohort Study With 7-year Follow-up
BMJ Open. 2013 (Dec 11); 3 (12): e003838Kongsted, A., Vach, W., Axř, M., Bech, R.N., Hestbaek, L., Kongsted, A. (2014).
Expectation of Recovery from Low Back Pain: A Longitudinal Cohort
Study Investigating Patient Characteristics Related to Expectations
and the Association Between Expectations and 3-month Outcome
Spine (Phila Pa 1976). 2014 (Jan 1); 39 (1): 81–90Hestbaek L, Munck A, Hartvigsen L, Jarbol DE, Sondergaard J, Kongsted A.
Low Back Pain in Primary Care: A Description of 1250 Patients
with Low Back Pain in Danish General and Chiropractic Practice
Int J Family Med. 2014 (Nov 4); 2014: 106102Danish National Committee on Biomedical Research Ethics.
Guidelines about notification. ; 2011 (Available at:)
http://www.cvk.sum.dk/English/guidelinesaboutnotification.aspx
(Accessed February 28, 2015)Jensen, M.P., Karoly, P., O'Riordan, E.F.,
Bland, F. Jr., and Burns, R.S.
The subjective experience of acute pain. An assessment of the utility of 10 indices.
Clin J Pain. 1989; 5: 153–159Kent, P. and Lauridsen, H.H.
Managing missing scores on the Roland Morris Disability Questionnaire.
Spine. 2011; 36: 1878–1884Bech, P., Rasmussen, N.A., Olsen, L.R.,
Noerholm, V., and Abildgaard, W.
The sensitivity and specificity of the Major Depression Inventory, using the Present State Examination as the index of diagnostic validity.
J Affect Disord. 2001; 66: 159–164Olsen, L.R., Jensen, D.V., Noerholm, V.,
Martiny, K., and Bech, P.
The internal and external validity of the Major Depression Inventory in measuring severity of depressive states.
Psychol Med. 2003; 33: 351–356Lauridsen, H.H., Hartvigsen, J.,
Korsholm, L., Grunnet-Nilsson, N., and Manniche, C.
Choice of external criteria in back pain research: does it matter? Recommendations based on analysis of responsiveness.
Pain. 2007; 131: 112–120New agenda solutions.
SMS-Track Questionnaire 1.1.3. ; 2007 (Available at:)
http://sms-track.dk
(Accessed February 28, 2015)Axen, I., Bodin, L., Bergstrom, G., Halasz, L.,
Lange, F., Lovgren, P.W. et al.
The use of weekly text messaging over 6 months was a feasible method for monitoring the clinical course of low back pain in patients seeking chiropractic care.
J Clin Epidemiol. 2012; 65: 454–461Johansen, B. and Wedderkopp, N.
Comparison between data obtained through real-time data capture by SMS and a retrospective telephone interview.
Chiropr Osteopat. 2010; 18: 10Twisk, J. and Hoekstra, T.
Classifying developmental trajectories over time should be done with great caution: a comparison between methods.
J Clin Epidemiol. 2012; 65: 1078–1087Barban, N. and Billari, F.C.
Classifying life course trajectories: a comparison of latent class and sequence analysis.
J Royal Stat Soc Ser C Appl Stat. 2012; 61: 765–784Kent, P. and Kongsted, A.
Identifying clinical course patterns in SMS data using cluster analysis.
Chiropr Man Therap. 2012; 20: 20Kongsted, A. and Leboeuf-Yde, C.
The Nordic Back Pain Subpopulation Program: Course Patterns Established
Through Weekly Follow-ups in Patients Treated For Low Back Pain
Chiropractic & Osteopathy 2010 (Jan 15); 18: 2
Return to LOW BACK PAIN
Return to TRAJECTORIES OF LOW BACK PAIN
Since 4-02-2016
| Home Page | Visit Our Sponsors | Become a Sponsor |
Please read our DISCLAIMER |