

Global Low Back Pain Prevalence and Years Lived
with Disability from 1990 to 2017: Estimates from
the Global Burden of Disease Study 2017This section is compiled by Frank M. Painter, D.C.
Send all comments or additions to: Frankp@chiro.org


FROM: Annals of Translational Medicine 2020 (Mar); 8 (6): 299 ~ FULL TEXT
OPEN ACCESS Aimin Wu, Lyn March, Xuanqi Zheng, Jinfeng Huang, Xiangyang Wang, Jie Zhao, Fiona M. Blyth, et/ al.
Division of Spine Surgery,
Department of Orthopaedics,
Zhejiang Spine Surgery Centre,
The Second Affiliated Hospital of Wenzhou Medical University,
Zhejiang Provincial Key Laboratory of Orthopaedics,
Wenzhou 325027, China.

Background: Low back pain (LBP) is a common musculoskeletal problem globally. Updating the prevalence and burden of LBP is important for researchers and policy makers. This paper presents, compares and contextualizes the global prevalence and years lived with disability (YLDs) of LBP by age, sex and region, from 1990 to 2017.
Methods: Data were extracted from the GBD (the Global Burden of Disease, Injuries, and Risk Factors Study) 2017 Study. Age, sex and region-specific analyses were conducted to estimate the global prevalence and YLDs of LBP, with the uncertainty intervals (UIs).
Results: The age-standardized point prevalence of LBP was 8.20% (95% UI: 7.31-9.10%) in 1990 and decreased slightly to 7.50% (95% UI: 6.75-8.27%) in 2017. The prevalent numbers of people with LBP at any one point in time in 1990 was 377.5 million, and this increased to 577.0 million in 2017. Age-standardized prevalence of LBP was higher in females than males. LBP prevalence increased with age, and peaked around the ages of 80 to 89 years, and then decreased slightly. Global YLDs were 42.5 million (95% UI: 30.2 million-57.2 million) in 1990 and increased by 52.7% to 64.9 million (95% UI: 46.5 million-87.4 million) in 2017. YLDs were also higher in females than males and increased initially with age; they peaked at 35-39 years of age in 1990, before decreasing, whereas in 2017, they peaked at 45-49 years of age, before decreasing. Western Europe had the highest number of LBP YLDs.
Conclusions: Globally, LBP is the leading global cause of YLDs. Greater attention is urgently needed to mitigate this increasing burden and the impact it is having on health and social systems.
Keywords: Global Burden of Disease Study; Low back pain (LBP); prevalence; years lived with disability (YLDs).
There is more like this at our
Global Burden of Disease PageKEYWORDS: Epidemiology; Low Back Pain; Outcomes Research
From the FULL TEXT Article:
Introduction
Low back pain (LBP) is the most common musculoskeletal problem globally. [1–4] It is the leading cause of activity limitation and absenteeism from work [5–7], and results in a huge medical burden and economic cost. [2, 8] It is consequently one of the major global public health problems. [9–11]
The Global Burden of Disease (GBD) Study is updated every one to two years. [6, 12–15] LBP is included as one of the musculoskeletal conditions in GBD study—the last article describing the global burden of LBP in detail was based upon the GBD 2010 [10] analysis. However, since then, there have been a number of methodological changes made and updated data. [6] These include: an updated DisMod-MR tool; construction of a Socio-Demographic Index (SDI); further research to establish disability weights (DWs); and adjustment for comorbidity. [6] Therefore, it is important to present these changes and highlight the resulting update on the prevalence and global burden of LBP.
Methods
All of the data analysed and presented in this article were obtained from the updated GBD 2017 (the Global Burden of Disease, Injuries, and Risk Factors Study) (http://www.healthdata.org/gbd/data). The GBD 2017 data were derived from the GBD repository of population health data, including World Health Surveys and National Health Surveys, literature reviews, and claims data. Literature review for LBP was conducted in October 2017. The electronic databases of Ovid Medline, EMBase, and CINAHL were searched and eight studies were included. In addition, USA claims data for 2000, 2010, 2012, and 2014 by state, and Taiwan claims data from 2016 were included.
In brief, Bayesian meta-regressions by DisMod-MR 2.1 were used to synthesize sparse and heterogeneous, epidemiological data to estimate the point prevalence and YLD outcomes. In GBD 2010, DisMod-MR 1.0 was used to pool all data by world region. This was updated to DisMod-MR 2.0 in GBD 2013, which increased the computational speed allowing consistent computations between all disease parameters at the country level. DisMod-MR 2.1 was used in GBD 2016 and 2017, and enables estimates down to the sub-national level. Results were stratified by five-year age groups from birth up to 95+. The detailed methods of the systematic analysis for GBD 2017 by the IHME (Institute for Health Metrics and Evaluation) have been published elsewhere. [6]
LBP was defined as pain that lasts for at least one day (with/without pain referred into one or both lower limbs) in the area on the posterior aspect of the body from the lower margin of the 12th ribs to the lower gluteal folds. [10, 16, 17]
DWs represent the magnitude of health loss associated with BP. DWs were measured on a scale from zero to one, with zero representing a state of full health, and one representing a state equivalent to death. The DWs used in GBD 2010 were based on face to face surveys conducted in five countries as well as an internet survey. [10] The DWs used in GBD 2017 have been described previously [18], and also included data from the European Disability Weights Measurement Study that took place in Hungary, Italy, the Netherlands and Sweden.
A total of six sequelae were used to represent the different levels of LBP severity:(I) most severe BP with leg pain (DW: 0.384, 95% CI: 0.256–0.518);
(II) most severe BP without leg pain (DW: 0.372, 95% CI: 0.250–0.506);
(III) severe BP with leg pain (DW: 0.325, 95% CI: 0.219–0.446);
(IV) severe BP without leg pain (DW: 0.272, 95% CI: 0.182–0.373);
(V) moderate BP with/without leg pain (DW: 0.054, 95% CI: 0.035–0.079); and
(VI) mild BP with/without leg pain (DW: 0.020, 95% CI: 0.011–0.035).There is no mortality from LBP, therefore, the YLDs and DALYs (Disability-adjusted life years) values are the same. In this paper, we have only used the term YLDs. The unadjusted YLDs of each sequela were calculated using the formula:
YLDsequela = Prevalencesequela ✕ DWsequela. [17]
The SDI was originally constructed in GBD 2015; it is a composite indicator of development status correlated with health outcomes. Briefly, it is the geometric mean of 0 to 1 indices of total fertility rate under the age of 25 (TFU25), mean education for those aged 15 and older (EDU15+), and lag-distributed income (LDI) per capita.
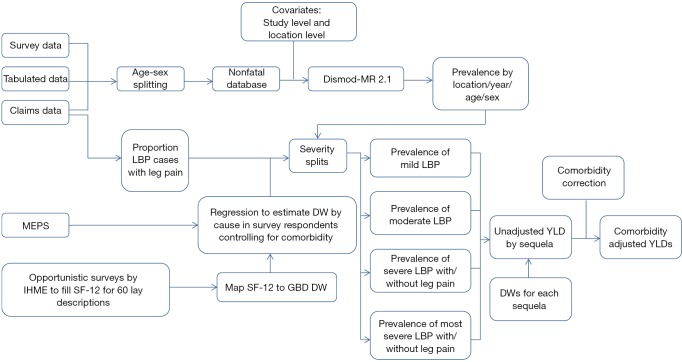
Figure 1 A comorbidity correction involving a micro-simulation performed for each age-sex-location-year, was used to calculate the comorbidity-adjusted YLDs at the final stage. The co-occurrence of different diseases was estimated by simulating 40,000 individuals in each age-sex-location-year combination based on disease prevalence. A flow chart describing the process for estimating the YLDs is shown in Figure 1.
Uncertainty intervals (UIs) were calculated using a propagating technique also described elsewhere. [15, 19, 20] Briefly, the distribution of every computed step was stored in 1,000 draws; the final estimate is the mean estimate across all 1,000 draws, and the 95% UI is the 25th and 975th ranked values.
Results
Prevalence

Table 1
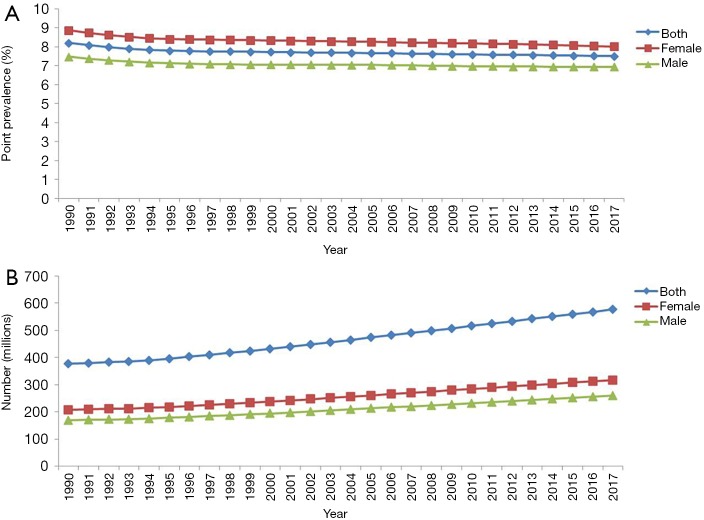
Figure 2
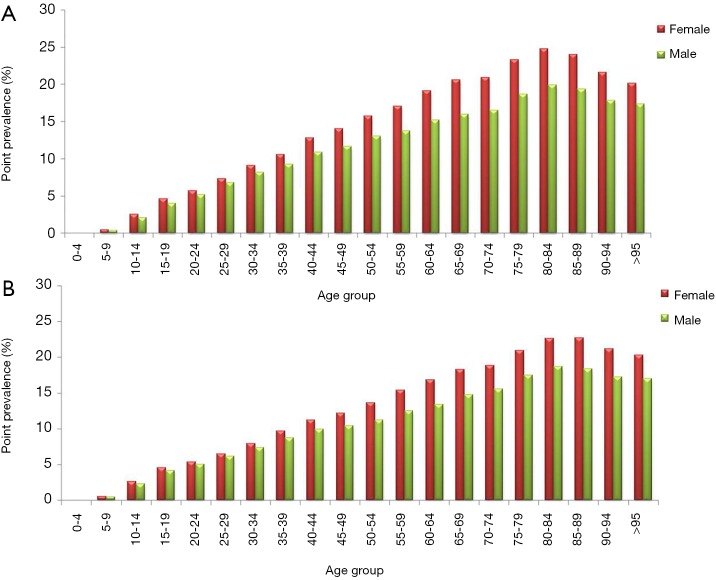
Figure 3
Table 2 The age-standardized point prevalence of LBP in the 21 world regions by gender at 1990 and 2017 is summarized in Table 1.
Globally, the age-standardized point prevalence of LBP was 8.20% (95% UI: 7.31–9.10%) in 1990, and this decreased to 7.50% (95% UI: 6.75–8.27%) in 2017. Prevalence was higher in females than males. For females, this was 8.86% (95% UI: 7.90–9.82%) in 1990 and 8.01% (95% UI: 7.22–8.84%) in 2017, whereas for males, prevalence was 7.47% (95% UI: 6.67–8.31%) in 1990 and 6.94% (95% UI: 6.24–7.67%) in 2017 (Figure 2A). The estimated prevalent numbers of people with LBP was 377.5 million in 1990, and this increased to 577.0 million in 2017, due to the considerable increased population globally from 1990 to 2017 (Figure 2B).
LBP prevalence increased with age, peaking around the ages 80 to 89 years old, and then slightly decreased. This pattern was observed in both females and males, in 1990 and 2017 (Figure 3A,B).
In 2017, the highest LBP prevalence was Southern Latin America (13.47%), followed by high-income Asia Pacific (13.16%), while the lowest was East Asia (3.92%), followed by Central Latin America (5.62%). The highest prevalent number of people with LBP was South Asia (96.3 million), followed by East Asia (67.7 million), while the lowest prevalent number of people with LBP was Oceania (0.7 million), followed by Caribbean (2.7 million).
Years lived with disability (YLDs)
LBP was the leading cause of YLDs for both 1990 and 2017 out of the all conditions studied in GBD 2017. In both time points, LBP was the leading cause of YLDs in 13 out of the 21 world regions (Table 2).
The global YLDs for LBP were 42.5 million (95% UI: 30.2 million–57.2 million) in 1990, and increased 52.7% to 64.9 million (95% UI: 46.5 million–87.4 million) in 2017 (Table 2). YLDs were higher for females than males in both 1990 (23.3 million, 95% UI: 16.6 million–31.2 million, compared to 19.2 million, 95% UI: 13.7 million–26.2 million, respectively) and 2017 (35.5 million, 95% UI: 25.4 million–47.7 million, compared to 29.5 million, 95% UI: 21.0 million–40.0 million, respectively) (Table 2). The age-standardized YLD rate (per 100,000 population) decreased slightly from 892 (95% UI: 637–1,195) in 1990 to 810 (95% UI: 582–1,089) in 2017, although this was not statistically significant at the 0.05 level. The age-standardized YLD rate was also higher in females than males (Table 2).
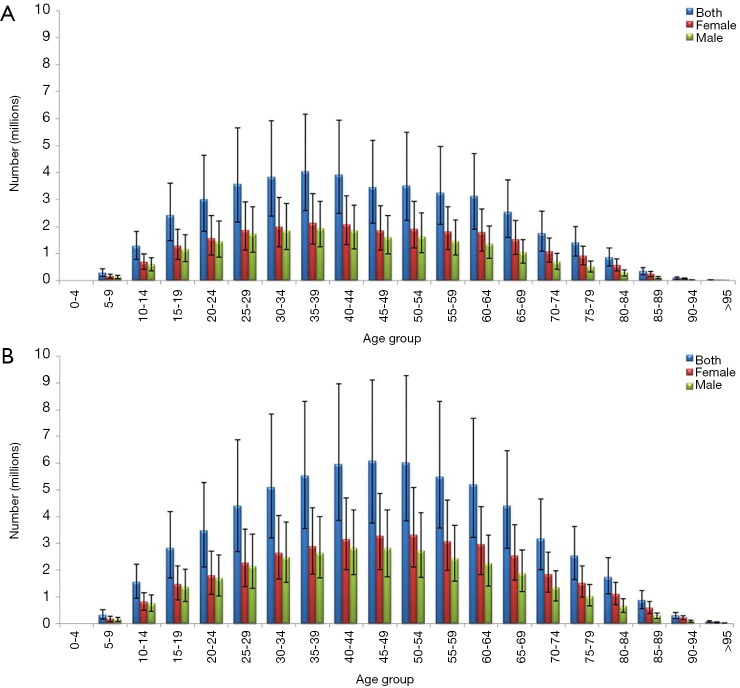
Figure 3 Total YLDs for LBP also increased initially with age; they peaked at 35–39 years of age in 1990, before decreasing (Figure 4A), whereas in 2017, they peaked at 45–49 years of age, before decreasing (Figure 4B). Both females and males had similar trends.
In 2017, the region with the highest number of YLDs was South Asia (10.8 million, 95% UI: 7.7 million–14.7 million), followed by East Asia (7.7 million, 95% UI: 5.53 million–10.4 million). The region with the lowest number of YLDs was Oceania (73,589, 95% UI: 52,501–100,281), followed by the Caribbean (303,867, 95% UI: 219,393–408,488). The region with the highest age-standardized YLD rate (per 100,000 persons) was Southern Latin America [1,404], followed by high-income Asia Pacific [1,361]. The region with the lowest age-standardized YLDs rate was East Asia [419], followed by Central Latin America [604].
Discussion
In this article, data analysed in GBD 2017 are presented. The prevalence (in %) of LBP had decreased between 1990 and 2017, whereas the prevalent number of people with LBP and the number of YLDs had increased substantially. LBP remains the leading global cause of YLDs in 2017. It should be noted that with each GBD study iteration, new data are being added to the models that derive the estimates over time. This consequently alters and strengthens the model outputs—as a result, and for example, prevalence estimates from GBD 2010 may differ from those from GBD 2017. Other factors that may influence prevalence changes between iterations are changes to the DWs, the DisMod-MR tool, construction of the SDI, and adjustments for comorbidity.
The gender disparity of LBP prevalence was different in GBD 2017 compared to GBD 2010. [10] In GBD 2010, prevalence was reportedly higher in males (10.1%) compared to females (8.1%); however, prevalence was higher in females in GBD 2017. This difference between GBD 2010 and GBD 2017 is mainly attributed to the improved data coverage and methods in GBD 2017 rather than any real changes over this period. Other studies have reported a similar gender trend. [21–24] Possible explanations for this are likely to be complex and may include biological, psychological and sociocultural factors. [22, 25, 26] However, another interesting finding is that males in Central, Eastern, Western and Southern Sub-Saharan Africa had a higher prevalence than females—further research is needed to better understand this.
The prevalence trends by age observed in GBD 2017 were similar to GBD 2010 (10). Prevalence was high in all age groups from 18 years onwards, and peaked at around 80–89 years old (Figure 3). There are many factors that may increase the prevalence of LBP with age. Aging is associated with pain, which may restrict social and physical function [27]; consequently, this restriction may result in further deterioration of the musculoskeletal system and further pain. Degeneration of the lumbar spine as a potential contributor to LBP continues to be a subject of debate. [28–32]
There was a slight decrease in the point prevalence (%) of LBP from 1990 to 2017, although this was not significant at the 0.05 level. The number of prevalent cases of LBP and number of YLDs has increased dramatically in this period, although, again, this was not significant at the 0.05 level. If these are real increases, they are likely to be mainly driven by aging and increasing population numbers [19] — having said this, the influence of this will vary from region to region, and there may also be other contributing factors such as obesity, increased motorization [1, 4], and willingness to report pain. Of note, the point prevalence and age-standardized YLDs rate (per 100,000 persons) in Southern Latin America, high-income Asia Pacific, Andean Latin America, Australasia and Western Sub-Saharan Africa have all increased suggesting that factors beyond aging and population increase may be at play.
The age trend for YLDs was different to that of prevalence. YLDs peaked in the middle-aged population, and thus the working-age population is most greatly affected by the burden of LBP. Figure 4 shows YLDs peaked around the ages 35 to 39 years old in 1990. However, consistent with the aging population and increasing global life expectancy, this peak was delayed to 45 to 49 years old in 2017. [19]
Strengths and limitations
The updated GBD 2017 has been improved compared to GBD 2010. More up-to-date data were included from World Health Surveys and National Health Surveys, the European Disability Weights Measurement Study, additional systematic reviews, and claims data from the USA Taiwan.
Methodological changes included(I) updating the DisMod-MR tool,
(II) having greater granularity in reporting of results for the oldest age groups (80–84, 85–89, 90–94 and 95+ years),
(III) construction of a SDI, and
(IV) adjustment for comorbidity. These changes increase confidence in the accuracy of results.Despite some improvements since GBD 2010, sufficient population-based prevalence and burden estimates on LBP are still lacking from many regions and countries. Consequently, burden estimates were heavily reliant on models. While these models have been improved, it should be noted that they are models rather than original data. Further, of the studies that were included in the analysis, substantial heterogeneity remains between the case definitions used. This has made it difficult to compare the data across countries and over time. Additionally, it is difficult to determine with confidence the impact of changes to LBP policy and practice. Hence, this is the key limitation in estimating and understanding the global burden of LBP. Standardisation of data collection would be an important first step. The Global Alliance for Musculoskeletal (MSK) Health and the Global Burden of Disease 2010 Study MSK Expert Group have developed a standardized survey questionnaire for measuring the population prevalence of LBP and other MSK conditions. [24]
The tool can be found online at: http://bjdonline.org/msk-survey-module/. The case definitions are aligned to those of the GBD. The intention for the questionnaire is for it to be integrated within pre-existing and planned surveys such as National Health Surveys, and not being used as a stand-alone tool. This will help to minimize the burden from having to conduct multiple surveys in the local communities, and, subsequently, will save the required resources. It also encourages LBP and other musculoskeletal disorders to be viewed as being integrated within broader health initiatives rather than being seen as a separate issue. It is hoped this publicly-available module will be widely adopted to increase the availability of comparable data on LBP and other MSKs. [24]
The DWs used also have some limitations. The DWs were based on surveys that were conducted in a limited number of countries (Bangladesh, Indonesia, Peru, Tanzania, the USA, Hungary, Italy, The Netherlands and Sweden) prior to 2013 as well as a global web-based survey. [18] The surveys rely on perceptions of respondents to often brief descriptions of a complex health problem. More recent surveys in a greater number of countries will increase the generalizability of the DWs.
Implications for policy and practice
From 1990 to 2017, LBP continued to be the leading cause of YLDs globally. Many countries and health-related organizations continue to prioritize communicate diseases over non-communicable diseases such as LBP. The Lancet Low Back Pain Series recently made a call for action on the management of LBP burden from governments, policy makers and the broader society. [8, 9, 33] However, there continues to be a gap between evidence for effective management of LBP and current practice and policy, as outlined in the recent Lancet Series. [8, 9, 33] Greater attention is needed to bridge this gap. A biopsychosocial framework could be used to guide the management including education, self-management, resumption of usual activities and exercise, and psychological measures for those with persistent symptoms. Management guidelines for different stages of BP and for different contexts should also be recommended. The recent Lancet Series documented high level of the inappropriate investigations and treatments that are contributing to the LBP burden for both individuals and society. Key recommended principles for LBP would be to reduce unnecessary imaging and treatment, support people to be active and stay at work, and to only use medication, imaging, and surgery prudently. [33] For high-risk cases, prevention and early intervention could be considered. Linton et al. reported a stepped, stratified, and matched care approach might reduce wastage of clinical time and resources. [34]
Hartvigsen et al. [8] concluded that the cost and disability from LBP vary substantially between countries, and would increase in the coming decades. Many of the risk factors (such as obesity, increased motorization and work-related issues) associated with LBP identified in those high-income countries are also present in developing countries. [1, 4, 35, 36] High-income countries are likely to have better developed health systems to manage this increasing burden. For these low-income and middle-income countries, health systems are most likely not as well developed, and, therefore, will face greater challenges in managing the impact of the growing LBP burden.
Given that many of the risk factors for LBP are shared by other non-communicable diseases, it is imperative that integrated, collaborative approaches are established and built upon to ensure affordable solutions to the growing burden of LBP [37], especially, in low- and middle-income countries. [38] Greater efforts are urgently needed to expand the amount of comparable data on the prevalence of LBP at national and sub-national levels. Future investigation should also include the effectiveness, cost-effectiveness of preventive and therapeutic strategies.
Conclusions
The global prevalence and YLD rates from LBP decreased slightly from the 1990 to 2017, but the number of LBP sufferers and YLDs increased substantially. Prevalence and YLDs were higher in females than males. Prevalence increased with age, and YLDs peaked at around 35 to 49 years of age. Globally, LBP remains the leading global cause of YLDs, yet it continues to be inadequately recognized as a disease burden in the population with the major disparity continuing between the level of burden, and the policy, research and health services response. This will continue to be an urgent need for governments and other donors. [33, 38]
Acknowledgments
We would like to thank the Global Burden Disease 2017 Study for the data.
Funding: A Wu is supported by the National Natural Science Foundation of China (No. 81501933), the Wenzhou Municipal Science and Technology Bureau (Y20170389), the Wenzhou leading talent innovative project (RX2016004), and the Zhejiang Provincial Medical Technology Foundation of China (2018KY129).
References:
Hoy D, Bain C, Williams G, et al.
A systematic review of the global prevalence of low back pain.
Arthritis Rheum 2012;64:2028–37Deyo RA, Cherkin D, Conrad D, et al.
Cost, controversy, crisis: low back pain and the health of the public.
Annu Rev Public Health 1991;12:141–56Maher C, Underwood M, Buchbinder R.
Non-specific low back pain.
Lancet 2017;389:736–47Hoy D, Brooks P, Blyth F, et al.
The epidemiology of low back pain.
Best Pract Res Clin Rheumatol 2010;24:769–81Lee H, Hubscher M, Moseley GL, et al.
How does pain lead to disability? A systematic review and meta-analysis of
mediation studies in people with back and neck pain.
Pain 2015;156:988–97James SL, Abate D, Abate KH, et al.
Global, regional, and national incidence, prevalence, and years lived with disability
for 354 diseases and injuries for 195 countries and territories, 1990–2017:
a systematic analysis for the Global Burden of Disease Study 2017.
Lancet 2018;392:1789–858Driscoll T, Jacklyn G, Orchard J, et al.
The Global Burden of Occupationally Related Low Back Pain:
Estimates From the Global Burden of Disease 2010 Study
Ann Rheum Dis. 2014 (Jun); 73 (6): 975–981- This is the first of 3 articles in the remarkable Lancet Series on Low Back Pain
Hartvigsen J, Hancock MJ, Kongsted A, Louw Q, Ferreira ML, Genevay S, Hoy D, Karppinen J et al.
What Low Back Pain Is and Why We Need to Pay Attention
Lancet. 2018 (Jun 9); 391 (10137): 2356–2367
Buchbinder R, van Tulder M, Öberg B, Costa LM, Woolf A, Schoene M, Croft P.
Low Back Pain: A Call For Action
Lancet. 2018 (Jun 9); 391 (10137): 2384–2388Hoy D, March L, Brooks P, et al.
The Global Burden of Low Back Pain: Estimates from the Global Burden of Disease 2010 study
Ann Rheum Dis. 2014 (Jun); 73 (6): 968–974Erdem MN, Erken HY, Aydogan M.
The effectiveness of non-surgical treatments, re-discectomy and minimally
invasive transforaminal lumbar interbody fusion in post-discectomy pain syndrome.
J Spine Surg 2018;4:414–22Global, regional, and national incidence, prevalence, and years lived with disability for 310 diseases
and injuries, 1990–2015: a systematic analysis for the Global Burden of Disease Study 2015.
Lancet 2016;388:1545–602Prof Theo Vos, PhD, Abraham D Flaxman, PhD, Mohsen Naghavi, PhD, et. al.
Global, Regional, and National Disability-adjusted Life-years (DALYs)
for 333 Diseases and Injuries and Healthy Life Expectancy (HALE) for
195 Countries and Territories, 1990–2016: A Systematic Analysis
for the Global Burden of Disease Study 2016
Lancet. 2017 (Sep 16); 390 (10100): 1260–1344GBD 2016 Disease and Injury Incidence and Prevalence Collaborators. Global, regional, and national incidence,
prevalence, and years lived with disability for 328 diseases and injuries for
195 countries, 1990–2016: a systematic analysis for the Global Burden of Disease Study 2016.
Lancet 2017;390:1211–59GBD 2017 SDG Collaborators. Measuring progress from 1990 to 2017 and projecting attainment to 2030 of the
health-related Sustainable Development Goals for 195 countries and territories:
a systematic analysis for the Global Burden of Disease Study 2017.
Lancet 2018;392:2091–138Hoy D, March L, Brooks P, et al.
Measuring the global burden of low back pain.
Best Pract Res Clin Rheumatol 2010;24:155–65Wu A, Dong W, Liu S, et al.
The prevalence and years lived with disability caused by low back pain in China, 1990 to 2016:
findings from the global burden of disease study 2016.
Pain 2019;160:237–45Salomon JA, Haagsma JA, Davis A, et al.
Disability weights for the Global Burden of Disease 2013 study.
Lancet Glob Health 2015;3:e712–23GBD 2017 Mortality Collaborators. Global, regional, and national age-sex-specific mortality and life expectancy,
1950–2017: a systematic analysis for the Global Burden of Disease Study 2017.
Lancet 2018;392:1684–735GBD 2017 Causes of Death Collaborators. Global, regional, and national age-sex-specific mortality
for 282 causes of death in 195 countries and territories, 1980–2017:
a systematic analysis for the Global Burden of Disease Study 2017.
Lancet 2018;392:1736–88Bailey A.
Risk factors for low back pain in women: still more questions to be answered.
Menopause 2009;16:3–4Wáng YXJ, Wáng JQ, Káplár Z.
Increased low back pain prevalence in females than in males after menopause age:
evidences based on synthetic literature review.
Quant Imaging Med Surg 2016;6:199Wang YXJ.
Menopause as a potential cause for higher prevalence of low back pain in women
than in age-matched men.
J Orthop Translat 2016;8:1–4Hoy DG, Raikoti T, Smith E, et al.
Use of The Global Alliance for Musculoskeletal Health survey module for estimating
the population prevalence of musculoskeletal pain: findings from the Solomon Islands.
BMC Musculoskelet Disord 2018;19:292Turk DC, Okifuji A.
Psychological factors in chronic pain: evolution and revolution.
J Consult Clin Psychol 2002;70:678–90Rollman GB, Lautenbacher S.
Sex differences in musculoskeletal pain.
Clin J Pain 2001;17:20–4Dionne CE, Dunn KM, Croft PR.
Does back pain prevalence really decrease with increasing age? A systematic review.
Age Ageing 2006;35:229–34Urrutia J, Zamora T, Prada C.
The prevalence of degenerative or incidental findings in the lumbar spine
of pediatric patients: a study using magnetic resonance imaging as a screening tool.
Eur Spine J 2016;25:596–601Teraguchi M, Yoshimura N, Hashizume H, et al.
Prevalence and distribution of intervertebral disc degeneration over the entire spine
in a population-based cohort: the Wakayama Spine Study.
Osteoarthritis Cartilage 2014;22:104–10Symmons DP, van Hemert AM, Vandenbroucke JP, et al.
A longitudinal study of back pain and radiological changes in the lumbar spines
of middle aged women. II. Radiographic findings.
Ann Rheum Dis 1991;50:162–6Millecamps M, Tajerian M, Naso L, et al.
Lumbar intervertebral disc degeneration associated with axial and radiating
low back pain in ageing SPARC-null mice.
Pain 2012;153:1167–79Wang Y, Videman T, Battie MC.
ISSLS prize winner: Lumbar vertebral endplate lesions: associations with
disc degeneration and back pain history.
Spine (Phila Pa 1976) 2012;37:1490–6Foster NE, Anema JR, Cherkin D, Chou R, Cohen SP, Gross DP, Ferreira PH, Fritz JM.
Prevention and Treatment of Low Back Pain: Evidence, Challenges, and Promising Directions
Lancet. 2018 (Jun 9); 391 (10137): 2368–2383Linton SJ, Nicholas M, Shaw W.
Why wait to address high-risk cases of acute low back pain? A comparison
of stepped, stratified, and matched care.
Pain 2018;159:2437–41Volinn E.
The epidemiology of low back pain in the rest of the world. A review of
surveys in low- and middle-income countries.
Spine (Phila Pa 1976) 1997;22:1747–54Shiri R, Falah-Hassani K, Heliovaara M, et al.
Risk Factors for Low Back Pain: A Population-Based Longitudinal Study.
Arthritis Care Res (Hoboken) 2019;71:290–9Vlaeyen JWS, Maher CG, Wiech K, et al.
Low back pain.
Nat Rev Dis Primers 2018;4:52Hoy D, Geere JA, Davatchi F, et al.
A time for action: Opportunities for preventing the growing burden and disability
from musculoskeletal conditions in low- and middle-income countries.
Best Pract Res Clin Rheumatol 2014;28:377-93.
Return to LOW BACK PAIN
Return to GLOBAL BURDEN OF DISEASE
Since 11-18-2018
| Home Page | Visit Our Sponsors | Become a Sponsor |
Please read our DISCLAIMER |