

The Global Burden of Low Back Pain:
Estimates from the Global Burden of Disease 2010 studyThis section is compiled by Frank M. Painter, D.C.
Send all comments or additions to: Frankp@chiro.org


FROM: Ann Rheum Dis. 2014 (Jun); 73 (6): 968–974 ~ FULL TEXT
OPEN ACCESS Prof Theo Vos, PhD, Abraham D Flaxman, PhD, Mohsen Naghavi, PhD,
Prof Rafael Lozano, MD, Catherine Michaud, MD, Prof Majid Ezzati et. al.
School of Population Health,
Brisbane, QLD, Australia

OBJECTIVE: To estimate the global burden of low back pain (LBP).
METHODS: LBP was defined as pain in the area on the posterior aspect of the body from the lower margin of the twelfth ribs to the lower glutaeal folds with or without pain referred into one or both lower limbs that lasts for at least one day. Systematic reviews were performed of the prevalence, incidence, remission, duration, and mortality risk of LBP. Four levels of severity were identified for LBP with and without leg pain, each with their own disability weights. The disability weights were applied to prevalence values to derive the overall disability of LBP expressed as years lived with disability (YLDs). As there is no mortality from LBP, YLDs are the same as disability-adjusted life years (DALYs).
RESULTS: Out of all 291 conditions studied in the Global Burden of Disease 2010 Study, LBP ranked highest in terms of disability (YLDs), and sixth in terms of overall burden (DALYs). The global point prevalence of LBP was 9.4% (95% CI 9.0 to 9.8). DALYs increased from 58.2 million (M) (95% CI 39.9M to 78.1M) in 1990 to 83.0M (95% CI 56.6M to 111.9M) in 2010. Prevalence and burden increased with age.
CONCLUSIONS: LBP causes more global disability than any other condition. With the ageing population, there is an urgent need for further research to better understand LBP across different settings.
There is more like this at our
Global Burden of Disease PageKEYWORDS: Epidemiology; Low Back Pain; Outcomes Research
From the FULL TEXT Article:
Introduction
Low back pain (LBP) is well documented as an extremely common health problem [1–4]; it is the leading cause of activity limitation and work absence throughout much of the world, [5] and it causes an enormous economic burden on individuals, families, communities, industry and governments. [6–8] As part of the Global Burden of Disease 2010 Study (GBD 2010), [9] the global burden of musculoskeletal conditions was estimated using updated methods that address methodological limitations of previous GBD studies. [10–12] Burden was expressed in disability-adjusted life years (DALYs).
This paper details the methods and results for estimating the global burden of LBP for GBD 2010. It is one of a series of articles. The overall capstone GBD 2010 papers were published in the Lancet, [9, 13–16] and the papers that report the methods and results for the MSK conditions are published in Annals of Rheumatic Diseases. [17–25] One of these papers describes in detail the methods used for estimating the global burden of the MSK conditions [22] and should be read in conjunction with the current paper.
Methods
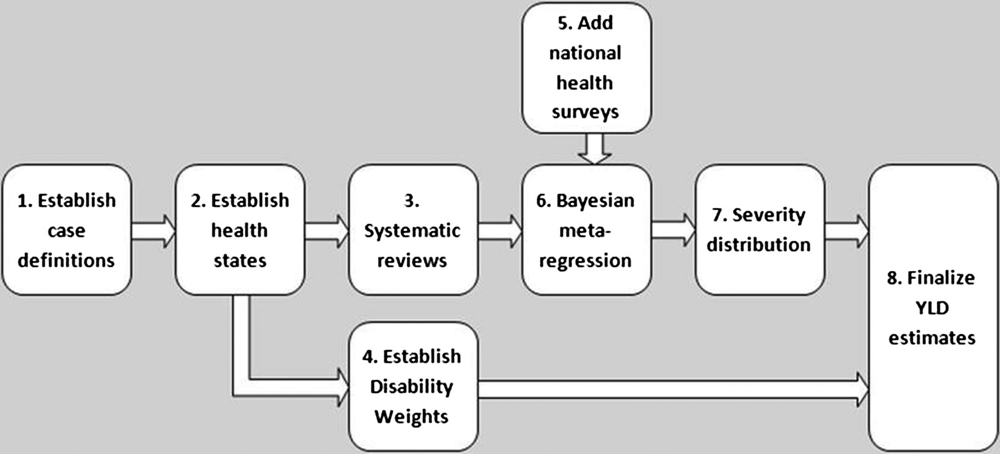
Figure 1 Figure 1 outlines the steps taken in estimating the burden of LBP. The GBD LBP expert group performed steps 1 to 3, and the GBD core team performed the remaining steps.
Established case definition
The initial case definition for LBP was ‘activity-limiting LBP (± pain referred into one or both lower limbs) that lasts for at least one day’. [12] The ‘low back’ was defined as the area on the posterior aspect of the body from the lower margin of the twelfth ribs to the lower glutaeal folds. For the final analysis, ‘activity-limiting’ was removed from the case definition because: (1) this provided a more robust analytical model given that relatively few data points from the systematic review conformed to the case definition of LBP that was activity-limiting and (2) this definition aligned better with the LBP definition used in national health surveys that were included in the final analysis.
Established health states

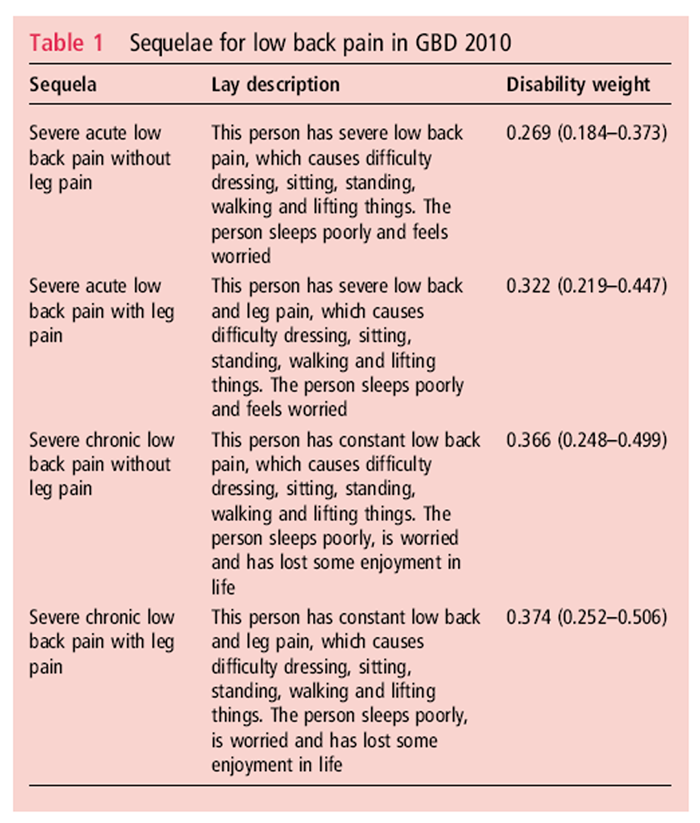
Table 1 A series of sequelae were developed to characterise the different levels of severity and take into account the variation in functional loss associated with acute and chronic LBP with or without leg pain (Table 1). [12] Each sequela was defined in lay terms.
Performed systematic reviews
The systematic reviews have been described elsewhere [26–28] — see online supplementary file 1 for further details. For incidence, a small number of studies were found, but all counted the number of people as the numerator rather than the number of incident episodes. This number could not be converted to episode incidence as no data were found on the average number of episodes a person with LBP experiences over time. Thus, incidence could not be used as a parameter in the burden estimates. [26] For duration and remission, no population-based studies were found, and for mortality, there was no consistent and conclusive evidence that LBP is associated with an increased risk of mortality. [26]
For prevalence, 170 published studies were identified. These reported 1,139 age and/or sex-specific estimates. All included studies were assessed for risk of bias using a tool specifically developed for GBD 2010. [28] High risk of bias estimates (n = 242) and estimates with a prevalence recall period greater than 1 year (n = 105) were excluded, leaving a total of 792 estimates from 118 studies (101 papers). One German study [29] was excluded, as it contained outlier data (point prevalence ranging from 77% to 92% in elderly Germans), and estimates more consistent with most other studies (point prevalence ranging from 20% to 50%) were available in two other German studies of equal or lower risk of bias. [30, 31] This left a total of 117 studies and 780 estimates, with data available from 47 countries and 16 of the 21 GBD world regions.
There was substantial heterogeneity between studies with respect to prevalence period and case definition (ie, the minimum episode duration), anatomical location, and whether or not cases had to experience activity limitation. To make data points more comparable, adjustments were made in DisMod-MR, a Bayesian meta-regression tool developed for GBD 2010 by predicting the value of a data point as if the study had used the reference definition. To do so, DisMod-MR estimates coefficients for study-level covariates by comparing the values of prevalence measured by various methods in the global dataset. For the purpose of these analyses, it was necessary to reduce the number of categories of case definition and prevalence period. This was done by merging some of the categories on the basis of overlapping CIs or expert opinion (on the basis of proximity to overlapping CIs) for prevalence and/or regression coefficients. To determine how best to reduce the number of categories, a multivariate regression was done with prevalence (log transformed plus 0.2 to achieve normality) as the dependent variable and the following independent variables: age, sex, prevalence period, minimum episode duration, anatomical location, activity limitation, coverage, urbanicity and risk of bias (see online supplementary file 2).
Three groups were formed for prevalence recall period:(1) point (including one day);
(2) short-term (one week to two months); and
(3) longer-term (three months to one year).
Three groups were formed for anatomical case definition:(1) back, low back, ‘posterior aspect of the body from the lower margin of the twelfth ribs to the lower glutaeal folds’, and ‘thoraco-lumbo-sacral’;
(2) lumbar, ‘lumbar or sacro-iliac joint(s)’, and ‘neck or back’; and
(3) ‘posterior aspect of the body from the seventh cervical vertebra to the lower glutaeal folds’, and ‘thoracic or lumbar’.
For the minimum episode duration definition variations, two groups were formed:(1) ‘not specified’, ‘>1 day’, ‘>3 days’, ‘>1 week’, and ‘>7 weeks’; and
(2) ‘>3 months’, ‘>6 months’, ‘chronic’, and ‘frequent’.
NOTE: > = greater than (as in 5>4)Note, the first category in each of the above groups is considered the reference category.
Established disability weights
Surveys were conducted in five countries for GBD 2010 and complemented by an open access internet survey; pair-wise comparison questions were used, in which respondents were asked to indicate which of two health states presented as brief lay descriptions they considered ‘the healthier’. Results were used to derive DWs. [15]
Added information from National Health Surveys
Additional information on prevalence of LBP was derived from the World Health Surveys (50 countries; 1,495 data points) [32]; Australian National Health Surveys (1995, 2001, 2003/2004 and 2007/2008; 43 data points) [33]; Australian Surveys of Disability, Ageing and Carers (2003 and 2009; 41 data points) [34]; and the US National Health Information surveys (2001–2008; 168 data points) [35] and NHANES (2009; 20 data points). [36] Data from these surveys were not included in the systematic review as they did not fulfil our inclusion criteria at that time.
Bayesian metaregression
DisMod-MR is a Bayesian metaregression tool that has a number of functions, including: (1) pooling heterogeneous data and adjusting data for methodological differences; (2) checking data on incidence, prevalence, duration, remission and mortality risk for internal consistency and (3) predicting values for countries and regions with little or no data using disease-relevant country characteristics and random effects for country, region and super-region. In the absence of usable incidence and remission data, a ‘prevalence-only’ model was run (see online supplementary file 3).
Severity distribution
To estimate the distribution of LBP cases across the GBD 2010 health states, the US Medical Expenditure Panel Survey (MEPS) from 2000 to 2009 was used. This had information on the prevalence of 156 disorders included in the GBD as well as health status information provided by all individuals using the Short Form-12 (SF-12) questionnaire. [37]
In order to provide a translation of SF-12 values into a scale comparable with that used by the GBD 2010 DWs, the GBD core team conducted a small study on a convenience sample of respondents who were asked to fill in SF-12 to reflect 62 lay descriptions covering a wide range of severity that were used in the GBD DW surveys. With regression methods, the proportion of an individual's SF-12 score, translated into a GBD DW, that could be attributed to LBP was calculated, while controlling for any comorbid other condition.
Cases were then grouped in categories of disability based on the midpoints between DWs reflecting successive levels of severity. It was assumed that those with no disability in MEPS were cases that had remitted since their diagnosis of LBP was reported. As the case definition was for ‘point prevalence’, this proportion of cases was excluded from the calculation of the average DW for all LBP and the remaining proportions were scaled to add up to 100%.
Table 2
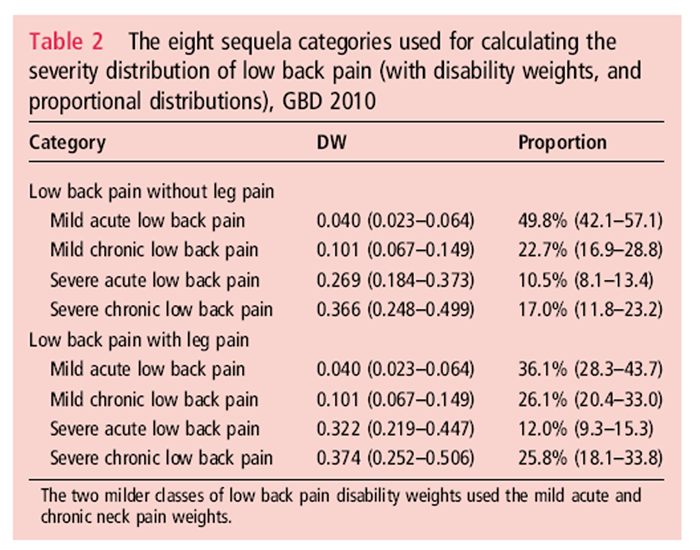
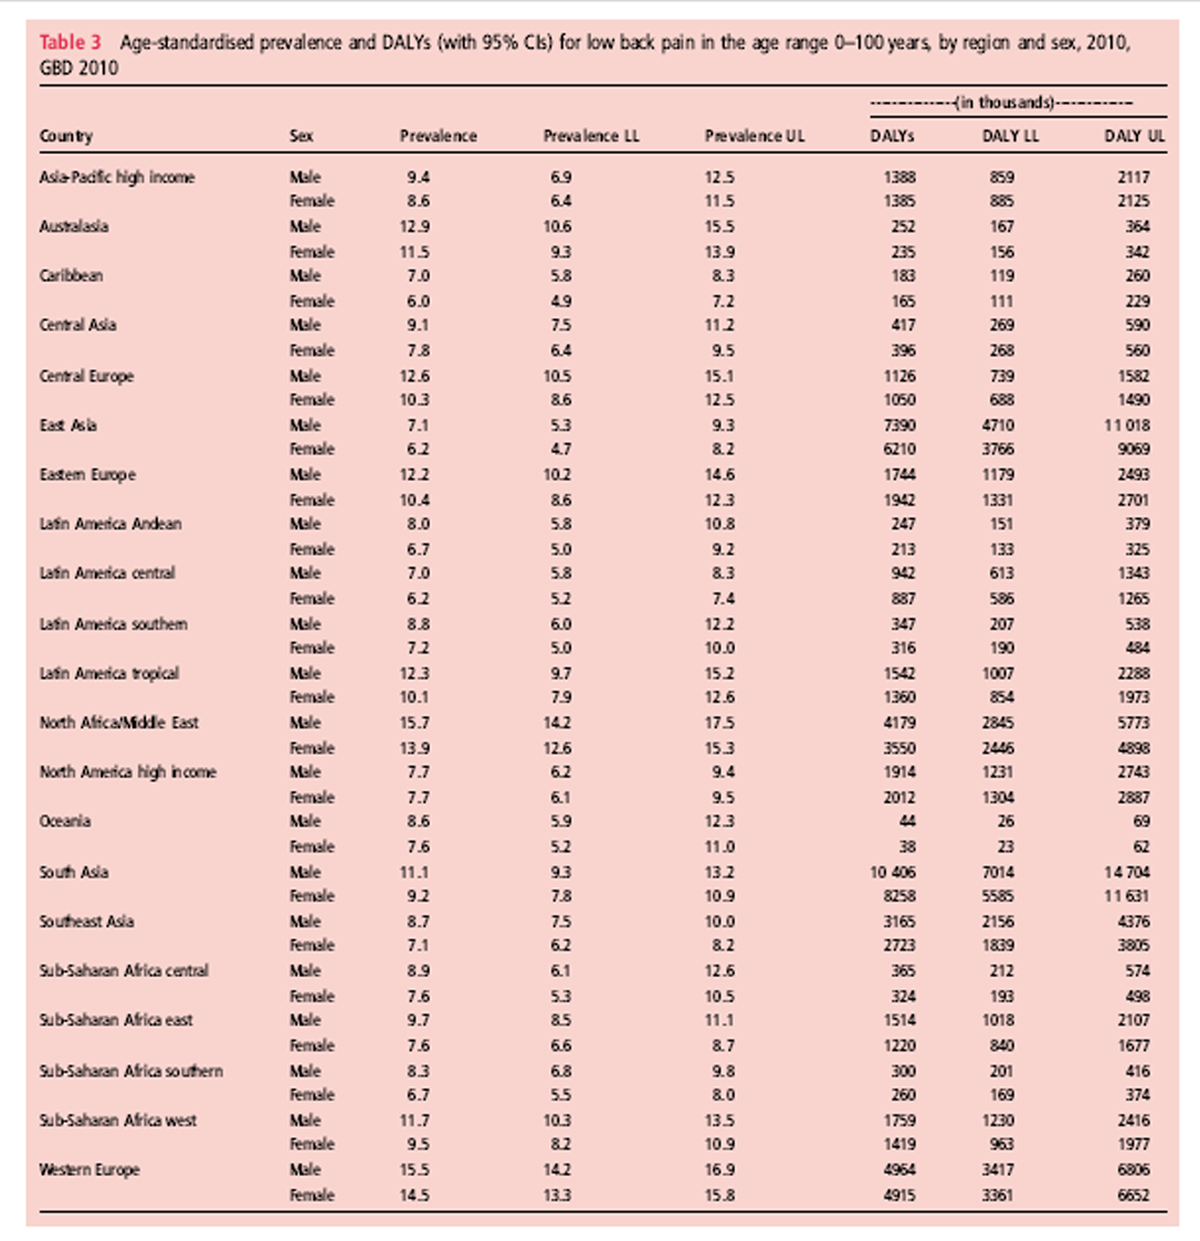
Table 3 MEPS respondents with LBP were partitioned into levels of severity for LBP with leg and another four for LBP without leg pain. The mild acute and chronic neck pain DWs were used as proxy DWs for the lowest LBP disability classes given that no mild LBP health states were available from the household and on-line surveys used to derive DWs (Tables 2 and 3). An age distribution of the proportions of LBP with and without leg pain was derived from the prevalence figures in MEPS. The proportions for males and females combined were calculated after finding little difference by sex. From these proportions, the average DWs were calculated by age.
Final burden estimates
The Disability-Adjusted Life Year (DALY) is the standard metric used to quantify burden. [38] DALYs are calculated by combining years of life lost (YLL) due to premature mortality, and years lived with disability (YLD). As there is no mortality from LBP, YLDs and DALY estimates are the same. The average DW was multiplied by the age/sex/region-specific prevalence for the years 1990, 2005 and 2010 to derive YLDs. The uncertainty interval (UI) around each quantity of interest was calculated from SEs around all data inputs and the uncertainty from all steps of data manipulations, including the use of country and region fixed effects in DisMod-MR and the severity distributions. Uncertainty ranges are presented as the 2.5 and 97.5 centile values, which can be interpreted as a 95% UI. Further detail on how uncertainty was calculated can be found elsewhere. [9] Prevalence estimates were standardised using the 2001 WHO standard population. [39]
As disability weights were derived for single health states, simple addition of YLDs for all conditions would assume that disability is additive if a person has comorbid health states. Thus, a person with a number of more severe health states could be awarded a cumulative disability weight that exceeds 1, which equates to greater health loss than ‘being dead’. Assuming a multiplicative function between DWs for comorbid health states assures that a combined DW can never be greater than 1. To make a correction for comorbidity, hypothetical populations were simulated for each age, sex, country and year. Individuals in these hypothetical populations were assigned to have no, one or more health states based on the prevalence figures for each health state. The multiplicative function was applied to any individual with comorbid health states and the DW for each component health state reduced proportionately. This allowed an estimate of the reduction in DW for any health state in an age and sex group by country and year: the comorbidity correction.
Results
Description of included data
There were 2,566 data points included in the final DisMod-MR models. These were from 85 countries, and 20 of the 21 GBD 2010 regions. The majority of studies used for these data included both sexes, a broad age range in the adult population, and urban and rural populations.
Prevalence
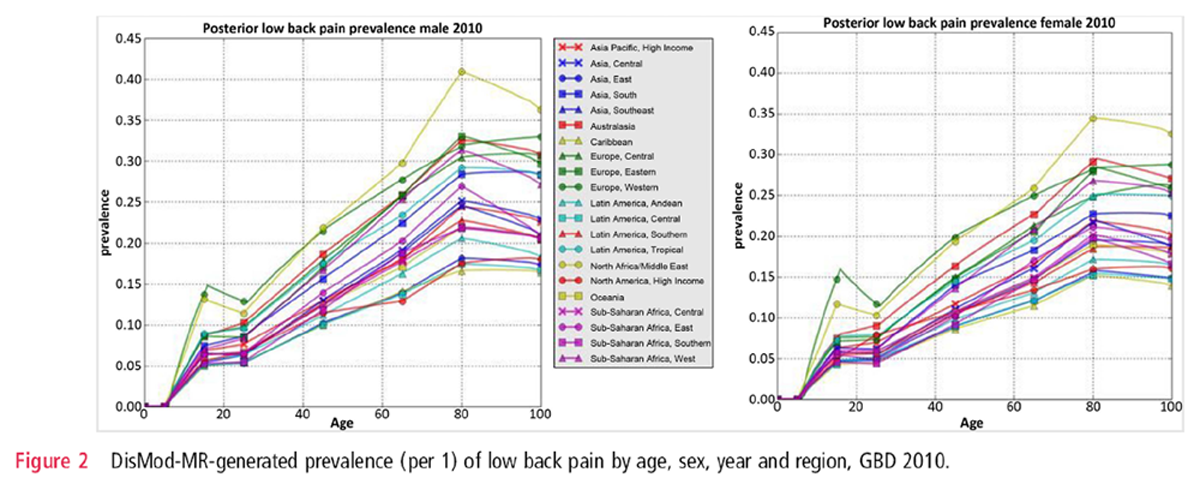
Figure 2 The global age-standardised point prevalence of LBP (from 0 to 100 years of age) in 2010 was estimated to be 9.4% (95% CI 9.0 to 9.8). It was higher in men (mean: 10.1%; 95% CI 9.4 to 10.7) compared with women (mean: 8.7%; 95% CI 8.2 to 9.3). The age and sex distribution across regions was similar. DisMod-MR assumes a similar age pattern for all regions unless there are sufficient data points in a region to indicate a variation from the global age pattern. The large heterogeneity in the LBP dataset meant that there was no departure from the default of a common age pattern (Figure 2). Prevalence peaked at around 80 years of age.
Age-standardised prevalence in 2010 was highest in western Europe (mean: 15.0%; 95% CI 14.1 to 16.0) followed by North Africa/Middle East (mean: 14.8%; 95% CI 13.8 to 15.9), and lowest in the Caribbean (mean: 6.5%; 95% CI 5.6 to 7.4) followed by central Latin America (mean: 6.6%; 95% CI 5.8 to 7.4). Prevalence did not change significantly from 1990 to 2010.
YLD and DALYs
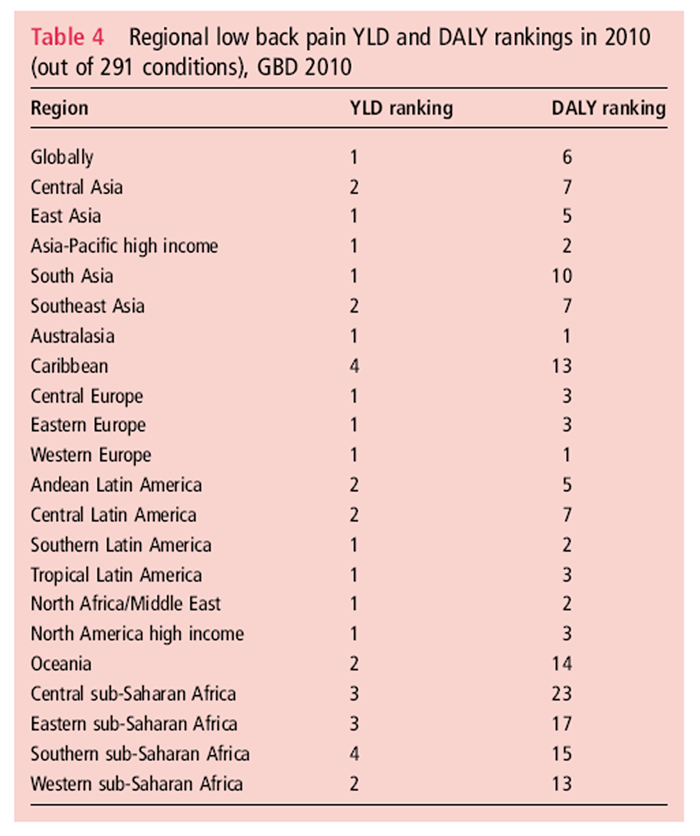
Table 4 Globally, and out of the 291 conditions studied, LBP was ranked as the greatest contributor to global disability (measured in YLDs), and the sixth in terms of overall burden (measured in DALYs) — Table 4. It was ranked as the greatest contributor to disability in 12 of the 21 world regions and the greatest contributor to overall burden in two of the 21 world regions (western Europe and Australasia).
DALYs increased from 58.2 million (M) (95% CI 39.9M to 78.1M) in 1990 to 83.0M (95% CI 56.6M to 111.9M) in 2010. Population increase contributed 30% of the 43% increase in DALYs between 1990 and 2010 while ageing was responsible for the remaining 13%. DALYs were highest in mens (44.2M; 95% CI 30.3M to 60.1M) compared with women (38.9M; 95% CI 26.5M to 52.9M). DALYs were highest between ages 35 and 50 years.
Discussion
New estimates of the global burden of low back pain The process for estimating the global burden of LBP has been extensive, and has taken almost 6 years. The results show that the prevalence and burden from LBP is very high throughout the world. Out of the 291 conditions studied in GBD 2010, LBP was found to have the sixth highest burden. LBP caused more disability globally than any other condition. The study has also enhanced our understanding of LBP. It suggests that prevalence peaks in older age groups. As a consequence, in regions with higher life expectancies, burden of LBP was ranked higher. With ageing populations throughout the world, but especially in low and middle-income countries, the number of people living with LBP will increase substantially over coming decades.
Previous estimates of the global burden of low back pain
For the original GBD study (GBD 1990), no estimates were made for LBP. For the GBD 2000–2004 updates, separate estimates were made for three LBP health states:(1) Acute episode of LBP resulting in moderate or greater limitations to mobility and usual activities;
(2) Episode of intervertebral disc displacement or herniation; and
(3) Chronic intervertebral disc disorder. [11]The global burden of LBP in 2004 was estimated to be 2.5 million DALYs, representing just 0.09% of the overall global disease burden. Overall, LBP ranked 105th out of 136 conditions studied.
The previous approach for estimating the burden of LBP had a number of limitations. First, the assumptions used to derive the incidence and duration of a LBP episode led to significant underestimation. Duration of acute LBP episodes was assumed to be four days, and incidence was derived from period prevalence figures (‘in the last 2 weeks did you have back pain?’). Other factors explaining the low estimates for 2004 were lower DWs and the exclusion of mild non-specific LBP, which is common and has a substantial global impact. [40–43] There were also limitations due to methodological heterogeneity between LBP prevalence studies and a paucity of suitable data.
Intervertebral disc pathology was a defining factor for two of the health states in GBD 2004, yet the presence of intervertebral disc pathology requires imaging, and most population-based studies do not have the resources to perform these investigations. More importantly, the presence of intervertebral disc pathology correlates poorly with clinical symptoms, and is therefore unlikely to be a good indicator of functional disability. [44]
Strengths and limitations of the new estimates
GBD 2010 provided an opportunity to ensure that LBP is quantified more accurately. There were several improvements on previous methods, including:(1) the development of a new case definition and set of functional health states, which are more in line with the natural history of LBP, and include mild LBP;
(2) the development of a new set of DWs for these health states, which were derived through community-based and health professional surveys in a number of countries;
(3) more in-depth systematic review methods to capture country-specific information;
(4) substantial attempts at dealing with risk of bias and the methodological heterogeneity between studies; and
(5) use of a new, more advanced version of DisMod that can(a) pool all data rather than rely on a ‘pick and choose’ method,
(b) perform meta-regression to make data points from different studies more comparable,
(c) use data to fill in missing information and
(d) carry forward uncertainty throughout the analysis.Despite these strengths, there were limitations. The functional domains in GBD 2010 refer to body functions and structures (eg, vision) as well as more complex human operations (eg, mobility). They do not refer to broader aspects of life such as participation, well-being, carer burden and economic impact. It is important that burden of disease estimates are supplemented with this information to consider the full impact of a condition in a population.
There was considerable methodological variation between studies, especially relating to the prevalence period and case definition used. Researchers are encouraged to adopt recent recommendations on defining LBP in epidemiologic studies to assist future reviews, enable comparisons between countries, and improve our understanding of LBP. [12, 45]
While using the MEPS study had the advantage of estimating the distribution of severity while taking comorbidity into account, it also had limitations. There is likely to have been some level of recall bias despite there being three follow-up points per year. Also, MEPS may not be representative of the health state experience for LBP across the globe. In low-income and middle-income countries, where services for the prevention and management of LBP are less extensive as in the USA, the health state experience could be different.
Suggested further research
There is a clear need for further research on the natural history of LBP. Long-term longitudinal studies that include people from the general population would provide important information on the average duration, and severity of disability over the course of an episode of LBP. Incorporating this research with pain diaries to track the daily patterns of pain and disability would add greater depth to this research. With expanding and ageing populations in many low-income and middle-income countries, the enormous burden from LBP in these areas will grow significantly over coming decades. There is an urgent need to increase our understanding, and attempt to mitigate the growing burden of LBP in these areas.
Conclusion
Globally, LBP causes more YLD than any other condition. Governments, health service and research providers and donors need to pay far greater attention to the burden that LBP causes than what they have done previously. Further research is urgently needed to better understand the predictors and clinical course of LBP across different settings, and the ways in which LBP can be prevented and better managed.
Acknowledgments
We would like to thank the following individuals who were kind enough to provide us with data upon request: Professor Fereydoun Davatchi, Dr Arash Tehrani, Dr Rowsan Ara, and Professor Atiqul Haq. Additionally, we are thankful to Dr Rungthip Puntumetakul, Melinda Protani, and Dr Rumna De for their involvement in testing of the risk of bias tool. The MSK LBP Expert Group was comprised of the following individuals: Rachelle Buchbinder, Damian Hoy, Peter Brooks, Lyn March, Anthony Woolf, and Fiona Blyth. The GBD Core Team members included on this paper are: Christopher Murray and Theo Vos.
References:
Andersson GB.
Epidemiology of low back pain.
Acta Orthop Scand Suppl 1998;281:28–31Dionne CE, Dunn KM, Croft PR.
Does back pain prevalence really decrease with increasing age? A systematic review.
Age Ageing 2006;35:229–34Rapoport J, Jacobs P, Bell NR, et al.
Refining the measurement of the economic burden of chronic diseases in Canada.
Chronic Dis Can 2004;25:13–21Deyo RA, Cherkin D, Conrad D, et al.
Cost, controversy, crisis: low back pain and the health of the public.
Annu Rev Public Health 1991;12:141–56Lidgren L.
The bone and joint decade 2000–2010.
Bull World Health Organ 2003;81:629Steenstra IA, Verbeek JH, Heymans MW, et al.
Prognostic factors for duration of sick leave in patients sick listed with acute low back pain:
a systematic review of the literature.
Occup Environ Med 2005;62:851–60Kent PM, Keating JL.
The epidemiology of low back pain in primary care.
Chiropr Osteopat 2005;13:13Thelin A, Holmberg S, Thelin N.
Functioning in neck and low back pain from a 12-year perspective:
a prospective population-based study.
J Rehabil Med 2008;40:555–61Murray CJ, Vos T, Lozano R, et al.
Disability-adjusted life years (DALYs) for 291 diseases and injuries in 21 regions, 1990–2010:
a systematic analysis for the Global Burden of Disease Study 2010.
Lancet 2013;380:2197–223World Health Organisation.
The global burden of disease: 2004 update.
Geneva: World Health Organization, 2008Lopez AD, Mathers CD, Ezzati M, et al.
Global Burden of Disease and Risk Factors.
New York, NY: Oxford University Press, 2006Hoy DG, March L, Brooks P, et al.
Measuring the global burden of low back pain.
Best Pract Res Clin Rheumatol 2010;24:155–65Lozano R, Naghavi M, Foreman K, et al.
Global and regional mortality from 235 causes of death for 20 age groups in 1990 and 2010:
a systematic analysis for the Global Burden of Disease Study 2010.
Lancet. 2012 (Dec 15); 380 (9859): 2163–2196Vos T, Flaxman AD, Naghavi M, et al.
Years Lived with Disability (YLDs) for 1160 Sequelae of 289 Diseases and Injuries 1990-2010:
A Systematic Analysis for the Global Burden of Disease Study 2010
Lancet 2013;380:2163–96Salomon JA, Vos T, Hogan DR, et al.
Common values in assessing health outcomes from disease and injury:
disability weights measurement study for the Global Burden of Disease Study 2010.
Lancet 2013;380:2129–43Lim SS, Vos T, Flaxman AD, et al.
A comparative risk assessment of burden of disease and injury attributable to 67 risk factors
and risk factor clusters in 21 regions, 1990–2010: a systematic analysis for the Global Burden
of Disease Study 2010.
Lancet 2013;380:2224–60Cross M, Smith E, Hoy D, et al.
The global burden of rheumatoid arthritis: estimates from the Global Burden of Disease 2010 study.
Ann Rheum Dis 2014. Published Online First 18 Feb.Cross M, Smith E, Hoy D, et al.
The global burden of hip and knee osteoarthritis: estimates from the Global Burden of Disease 2010 study.
Ann Rheum Dis 2014. Published Online First 19 Feb 2014.Hoy D, March L, Brooks P, et al.
The Global Burden of Low Back Pain:
Estimates from the Global Burden of Disease 2010 study
Ann Rheum Dis. 2014 (Jun); 73 (6): 968–974Hoy D, March L, Woolf A, et al.
The Global Burden of Neck Pain:
Estimates From the Global Burden of Disease 2010 Study
Ann Rheum Dis. 2014 (Aug); 73 (8): 1462–1469Hoy D, Smith E, Blyth F, et al.
Reflecting on the global burden of musculoskeletal conditions: lessons learnt, next steps.
Ann Rheum Dis. 2014 (Jun); 73 (6): 982–989Hoy D, Smith E, Cross M, et al.
The Global Burden of Musculoskeletal Conditions for 2010:
An Overview of Methods
Ann Rheum Dis 2014;73:982–9Sanchez-Riera L, Carnahan E, Vos T, et al.
The global burden attributable to low bone mineral density.
Ann Rheum Dis 2014. Published Online First 1 Apr 2014.Smith E, Hoy D, Cross M, et al.
The global burden of gout: estimates from the Global Burden of Disease 2010 study.
Ann Rheum Dis 2014. Published Online First 3 Mar 2014.Smith E, Hoy D, Cross M, et al.
The Global Burden of Other Musculoskeletal Disorders:
Estimates From the Global Burden of Disease 2010 Study
Ann Rheum Dis. 2014 (Aug); 73 (8): 1462–1469Hoy DG, Brooks P, Blyth F, et al.
The epidemiology of low back pain.
Best Pract Res Clin Rheumatol 2010;24:769–81Hoy D, Bain C, Williams G, et al.
A systematic review of the global prevalence of low back pain.
Arthritis Rheum 2012;64:2028–37Hoy D, Brooks P, Woolf A, et al.
Assessing risk of bias in prevalence studies: modification of an existing tool
and evidence of interrater agreement.
J Clin Epidemiol 2012;65:934–9Gunzelmann T, Schumacher J, Brahler E.
The prevalence of pain in the elderly German population: Results of population-based studies
with the Giessen Subjective Complaints List (Giessener Beschwerdebogen GBB).
Schmerz 2002;16:249–54Kohlmann T, Deck R, Raspe H.
Prevalence and severity of back pain in Lubeck.
Aktuelle Rheumatol 1995;20:99–104Neuhauser H, Ellert U, Ziese T.
[Chronic back pain in the general population in Germany 2002/2003:
prevalence and highly affected population groups].
Gesundheitswesen 2005;67:685–93World Health Organisation.
World Health Surveys. 2012.
http://www.who.int/healthinfo/survey/en/index.htmlAustralian Bureau of Statistics.
Australian National Health Surveys. 2012.
http://www.abs.gov.au/ausstats/abs@.nsf/mf/4364.0Australian Bureau of Statistics.
Australian Surveys of Disability, Ageing and Carers.
http://www.abs.gov.au/ausstats/abs@.nsf/mf/4430.0US National Institutes of Health.
US National Health Information surveys.
http://www.cdc.gov/nchs/nhis.htmUS Centres for Disease Control and Prevention.
National Health and Nutrition Examination Survey.
http://www.cdc.gov/nchs/nhanes.htmAgency for Healthcare Research and Quality.
United States Medical Expenditure Panel Survey 2000–2009.
Rockville, United States: Agency for Healthcare Research and QualityMurray CJL, Lopez AD.
The global burden of disease: a comprehensive assessment of mortality and disability
from diseases, injuries and risk factors in 1990 and projected to 2020.
Boston: Harvard University Press, 1996Ahmadi B, Boschi-Pinto C, Lopez A, et al.
Age standardization of rates: a new WHO standard.
Geneva: World Health Organisation, 2001Walker BF, Muller R, Grant WD.
Low back pain in Australian adults: prevalence and associated disability.
J Manipulative Physiol Ther 2004; 27:238–44Cassidy JD, Carroll LJ, Côté P, et al.
The Saskatchewan health and back pain survey: The prevalence of low back pain
and related disability in Saskatchewan adults.
Spine 1998;23:1860–7Goubert L, Crombez G, De Bourdeaudhuij I.
Low back pain, disability and back pain myths in a community sample:
prevalence and interrelationships.
Eur J Pain 2004;8:385–94Schmidt CO, Raspe H, Pfingsten M, et al.
Back pain in the German adult population: prevalence, severity, and
sociodemographic correlates in a multiregional survey.
Spine 2007;32:2005–11Von Korff M.
Studying the natural history of back pain.
Spine 1994;19(18 Suppl):2041S–6SDionne CE, Dunn KM, Croft PR, et al.
A consensus approach toward the standardization of back pain definitions
for use in prevalence studies.
Spine 2008;33:95–103
Return to LOW BACK PAIN
Return to GLOBAL BURDEN OF DISEASE
Since 11-18-2018
| Home Page | Visit Our Sponsors | Become a Sponsor |
Please read our DISCLAIMER |