

Costs of Complementary and Alternative Medicine (CAM)
and Frequency of Visits to CAM Practitioners:
United States, 2007This section is compiled by Frank M. Painter, D.C.
Send all comments or additions to: Frankp@chiro.org


FROM: National Health Statistics Reports 2009 (Jul 30); (18): 1–14 ~ FULL TEXT
OPEN ACCESS Richard L. Nahin, Ph.D., M.P.H., Patricia M. Barnes, M.A.; Barbara J. Stussman, B.A.; and Barbara Bloom, M.P.A.
RAND Corporation,
Santa Monica, California,
United States of America.
FROM: Nahin, National Health Statistics Reports 2009Objective: This report presents selected estimates of costs of complementary and alternative medicine (CAM) use among U.S. adults, the frequency of visits made to CAM providers, and the frequency of purchases of self-care CAM therapies. Data from the 2007 National Health Interview Survey (NHIS), which is conducted by the Centers for Disease Control and Prevention's National Center for Health Statistics, are used in this report.
Methods: Estimates were derived from the Complementary and Alternative Medicine Supplement of the 2007 NHIS, sponsored by the National Center for Complementary and Alternative Medicine, which is part of the National Institutes of Health. Estimates were generated using the SUDAAN statistical package to account for the NHIS complex sample design.
Results: In 2007, adults in the United States spent $33.9 billion out of pocket on visits to CAM practitioners and purchases of CAM products, classes, and materials. Nearly two-thirds of the total out-of-pocket costs that adults spent on CAM were for self-care purchases of CAM products, classes, and materials during the past 12 months ($22.0 billion), compared with about one-third spent on practitioner visits ($11.9 billion). Despite this emphasis on self-care therapies, 38.1 million adults made an estimated 354.2 million visits to practitioners of CAM. About three-quarters of both visits to CAM practitioners and total out-of-pocket costs spent on CAM practitioners were associated with manipulative and body-based therapies. A total of 44% of all out-of-pocket costs for CAM, or about $14.8 billion, was spent on the purchase of nonvitamin, nonmineral, natural products.
From the FULL TEXT Article:
Introduction
Complementary and alternative medicine (CAM) comprises a diverse set of healing philosophies, therapies, and products. [1] Over the last decade, the U.S. public has shown a steady and substantial use of complementary and alternative medicine, with 2007 estimates placing overall prevalence of use at 38.3% of adults (83 million persons) and 11.8% of children (8.5 million children under age 18 years). [2] The most recent national estimates of out-of-pocket expenditures for CAM therapies are now more than a decade old. [3] In their 1997 telephone survey, Eisenberg et al [3] contacted a nationally representative sample of 2,055 individuals aged 18 years or older, with a weighted response rate of 60%. At that time, the total out-of-pocket expenditure for CAM use in adults was estimated at $27.0 billion per year, with $12.2 billion of the total going toward payment of CAM professionals such as acupuncturists, chiropractors, and massage therapists.
This report is based on a CAM survey supplement administered as part of the sample adult questionnaire of the 2007 National Health Interview Survey (NHIS). The report focuses on the out-of-pocket expenditures on CAM. Estimates of total cost and cost per visit for all CAM therapies used, as well as prevalence of use of individual CAM therapies and the associated per-visit costs to a CAM provider, are presented. The report also examines the number of visits made to CAM providers in a 12–month period. A previous report discussed the prevalence of CAM use among adults and children. [2]
Methods
Data source
The statistics shown in this report are based on data from the Adult Complementary and Alternative Medicine supplement of the 2007 NHIS. [4] NHIS, which is in the field continuously, is conducted by the Centers for Disease Control and Prevention’s National Center for Health Statistics. It is a survey of a nationally representative sample of the civilian, noninstitutionalized household population of the United States. In the family section, basic health and demographic information is collected on all household members. All adult members of the household who are home at the time of the interview are invited to participate and respond for themselves, with proxy responses allowed for persons unavailable at the time of the interview. Additional information is collected on one randomly selected adult aged 18 years or over (sample adult) and one randomly selected child aged 0–17 years (sample child) in each family. Information on the sample adult is self-reported except in rare cases when the sample adult is physically or mentally incapable of responding, and information on the sample child is collected from an adult who is knowledgeable about the child’s health, usually a parent.
The 2007 CAM supplement was administered to sample adults and respondents for sample children. It included questions on 36 types of CAM therapies used in the United States, including 10 types of provider-based CAM therapies (e.g., acupuncture, chiropractic and osteopathic manipulation, traditional healers) and 26 other CAM therapies for which the services of a provider are not necessary (e.g., nonvitamin, nonmineral, natural products; special diets; movement therapies); see ‘‘Technical Notes,’’ ‘‘Definition of terms,’’ for a list and descriptions of all 36 CAM therapies. Following the taxonomy of unconventional health care proposed by Kaptchuk and Eisenberg [1], stress management classes, support groups, and religious (faith) healing are not included in the definition of CAM used in this report, although questions on their use were included in the CAM supplement. Within the CAM supplement, one section asked about participants’ use of ‘‘herbal supplements.’’ This section queried participants on a list of 45 dietary supplements that went beyond the category of ‘‘herbal supplements’’ to include such items as androstenedione, carnitine, creatine, DHEA, fish oils, glucosamine, lutein, lycopene, melatonin, omega fatty acids, prebiotics or probiotics, and SAM-e, but not vitamins or minerals. Therefore, to more correctly label this extensive set of dietary supplements in this report, this group of supplements is referred to as nonvitamin, nonmineral, natural products.
Inclusion and development of the 2007 CAM supplement was supported by seven institutes, centers, or offices of the National Institutes of Health:
National Center for Complementary and Alternative Medicine
National Heart, Lung and Blood Institute
National Institute of Allergy and Infectious Disease
National Institute of Child Health and Human Development
National Institute of Mental Health
Office of Behavioral and Social Science Research
Office of Dietary Supplements
Strengths and limitations of the data
A major strength of the NHIS CAM data is that they were collected for a nationally representative sample of U.S. adults, allowing estimation of CAM use for a wide variety of population subgroups. The large sample size also facilitates investigation of the association between CAM and a wide range of other self-reported health characteristics included in the NHIS, such as health behaviors, chronic health conditions, injury and poisoning episodes, access to medical care, and health insurance coverage.
The NHIS questions have several limitations:1) The questions are dependent on respondents’ memory and their willingness to report use accurately.
2) The collection of survey data at a single point in time results in an inability to produce consecutive annual prevalence estimates, and can reduce the ability to produce reliable prevalence estimates for small population subgroups, as this could require a larger sample and more than one year of data.
3) The total costs per person for nonvitamin, nonmineral, natural products and homeopathy were calculated by multiplying the amount spent at the most recent purchase by the number of purchases per year.Because data were not available for the exact cost at each purchase, and the most recent purchase may not have been typical of the respondent's usual purchase of CAM products, the estimates may contain errors.
Statistical analysis
In 2007, NHIS interviews were completed in 29,266 households, which yielded 75,764 persons in 29,915 families and a household response rate of 87.1%. This report is based on data from 23,393 completed interviews with sample adults aged 18 years and over. The final 2007 sample adult response rate was 67.8%. Procedures used in calculating response rates are detailed in Appendix I of the Survey Description Document, NHIS data files. [5]
All estimates and associated standard errors shown in this report were generated using SUDAAN, a software package designed to account for a complex sample design such as that of NHIS. [6] All estimates for adults were weighted, using the sample adult record weight, to represent the U.S. civilian, noninstitutionalized population aged 18 years and over.
Estimates were calculated using recodes for the number of times the respondent saw various CAM practitioners, the amount paid out of pocket for each CAM practitioner visit, the number of times self-care therapies were purchased, and the amount paid out of pocket for the self-care therapy (see ‘‘Technical Notes,’’ ‘‘Calculation of estimates,’’ for a detailed explanation of the recodes and ‘‘Definition of terms’’ for definitions of CAM practitioner and self-care therapies). Persons with unknown CAM information have been excluded from the analysis.
In tables shown in this report, estimates with a relative standard error of more than 30% but less than or equal to 50% are identified with an asterisk (*), indicating that they are statistically unstable due to small sample size. Estimates with a relative standard error of greater than 50% are indicated with a dagger () and are not shown.
Results
Figure

Table 1
Table 2
Table 3
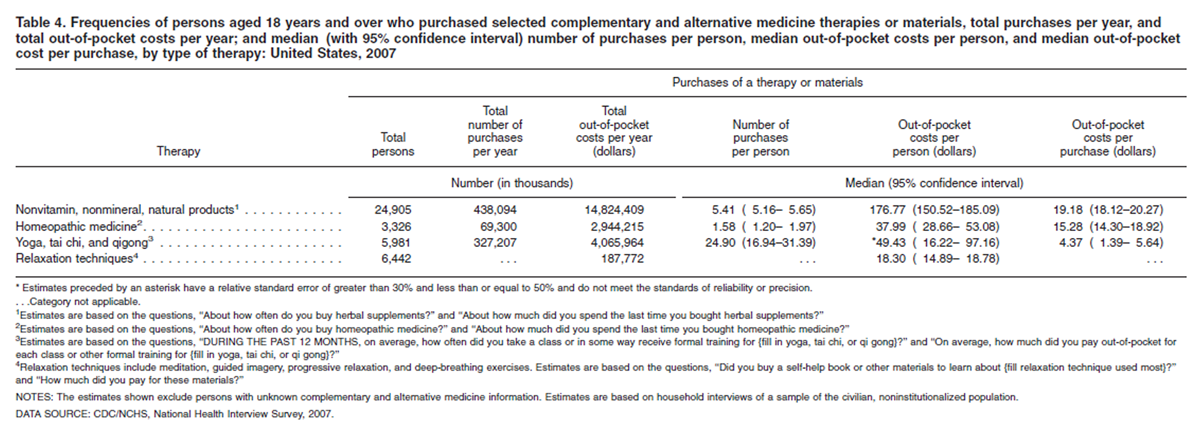
Table 4
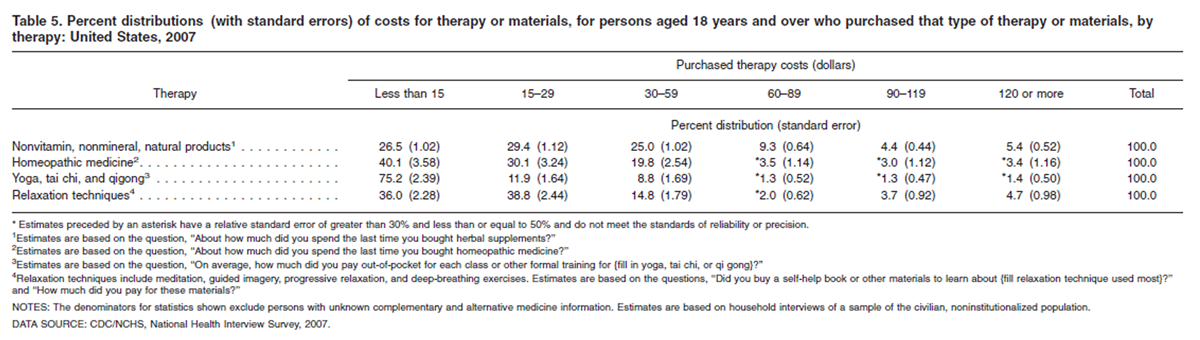
Table 5 Out-of-pocket costs for CAM (Figure)
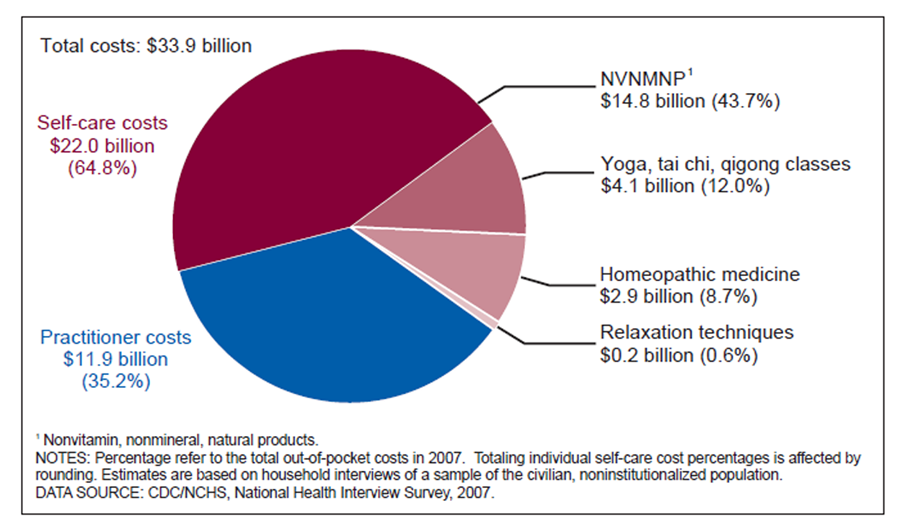
In 2007, adults in the United States spent $33.9 billion out of pocket on visits to CAM practitioners and purchases of CAM products, classes, and materials (see figure).
Nearly two-thirds of the total out-of-pocket costs that adults spent on CAM were for self-care purchases of CAM products, classes, and materials during the past 12 months ($22.0 billion) compared with about one-third spent on practitioner visits ($11.9 billion) (see figure).
A total of 44% of all out-of-pocket costs for CAM was spent on the purchase of nonvitamin, nonmineral, natural products (see figure).
CAM practitioner therapies (Tables 1–3)
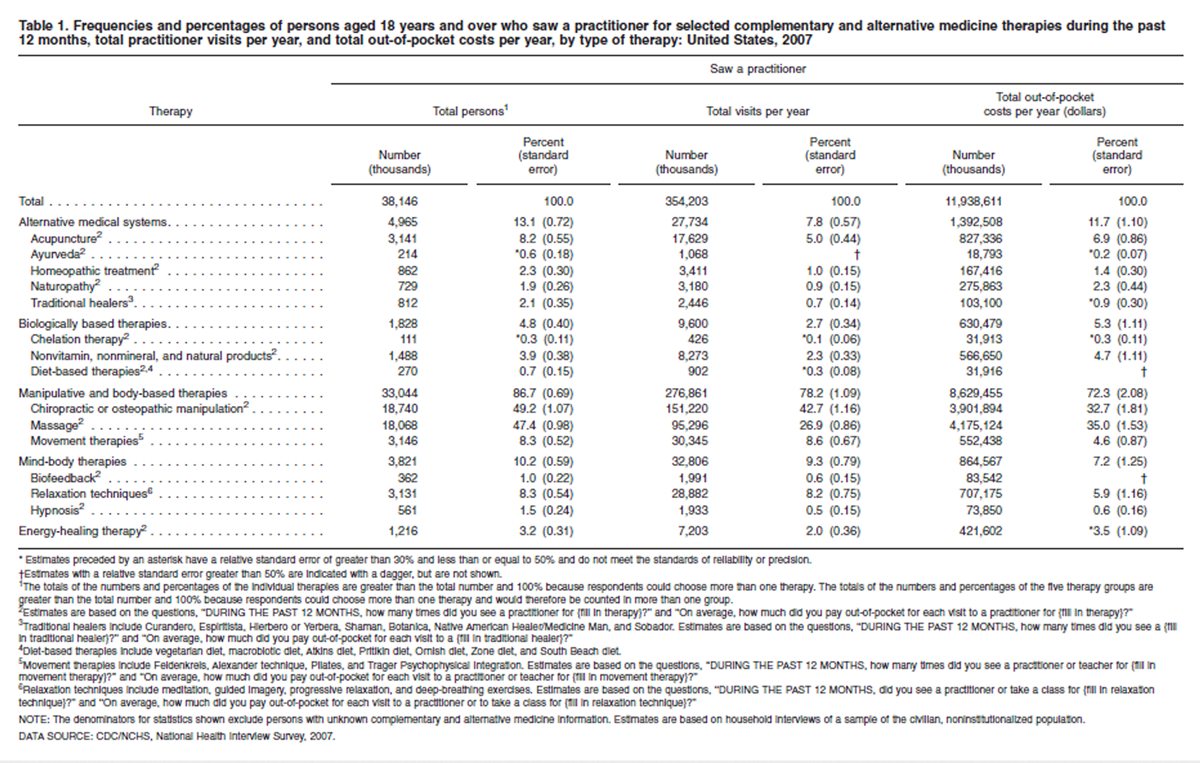
In 2007, 38.1 million adults made an estimated 354.2 million visits to CAM practitioners, at an estimated out-of-pocket cost of $11.9 billion dollars (Table 1).
About three-quarters of both visits to CAM practitioners and total out-of-pocket costs spent on CAM practitioners during the past 12 months were associated with manipulative and body-based therapies (Table 1).
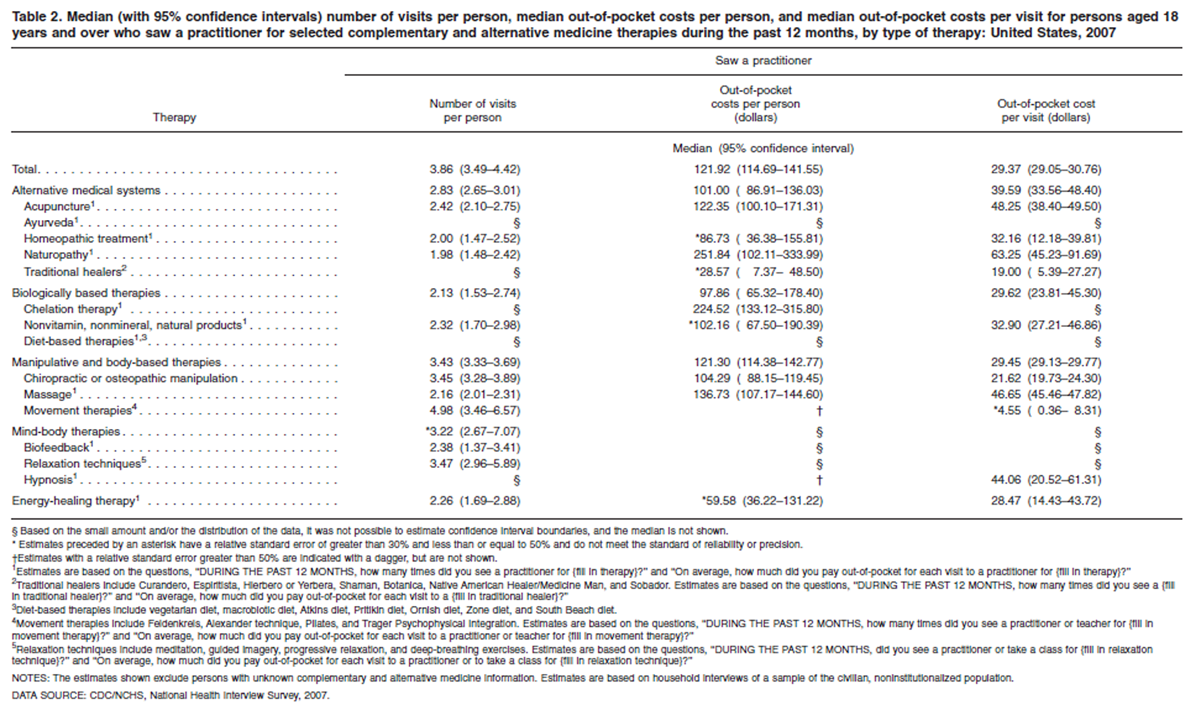
On average, adults in the United States spent $121.92 per person for visits to CAM providers and paid $29.37 out of pocket per visit. Some of the highest per-person, out-of-pocket costs are associated with visits to practitioners of naturopathy and chelation therapy, while one of the lowest per-person, out-of-pocket costs is associated with visits to practitioners of chiropractic or osteopathic manipulation therapy (Table 2).
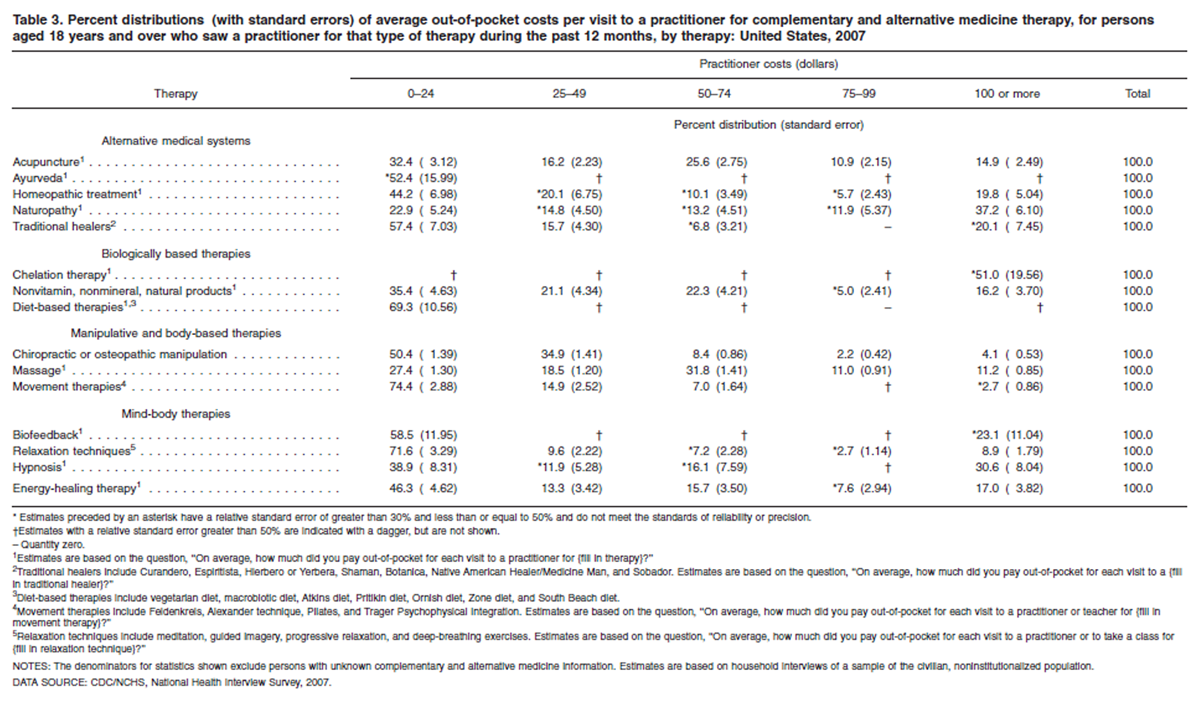
For most types of CAM therapies, the majority of adults spent less than $50 per visit to a practitioner. However, at least 20% of persons visiting practitioners of acupuncture, homeopathy, naturopathy, massage, and hypnosis therapy paid $75 or more per visit (Table 3).
CAM self-care therapies (Tables 4–5)
Nonvitamin, nonmineral, natural products ($14.8 billion) accounted for the majority of out-of-pocket dollars spent on CAM self-care purchases (Table 4).
Adults who made CAM self-care purchases spent a total of $4.1 billion out of pocket on yoga, tai chi, or qigong classes (Table 4).
Adults spent $2.9 billion out of pocket on the purchase of homeopathic medicine in 2007 (Table 4).
Across categories of self-care CAM products, most adults who purchased the products spent less than $30 per purchase. However, about 5% of individuals who bought nonvitamin, nonmineral, natural products or who purchased self-help materials to learn relaxation techniques spent more than $120 per purchase (Table 5).
Discussion
Using data from the 2007 NHIS, weestimate that U.S. adults spent about $33.9 billion out of pocket on visits to CAM practitioners and on purchases of CAM products, classes, and materials. This equates to 1.5% of total health-careexpenditures in the United States and to 11.2% of out-of-pocket health-care expenditures. [7] Almost two-thirds of CAM costs were associated with self-care therapies such as nonvitamin, nonmineral, natural products; homeopathic products; and yoga. Of this, the public spent $14.8 billion out of pocket to purchase nonvitamin, nonmineral, natural products—about 31% of the amount that the public spent out of pocket to buy pharmaceutical drugs in 2007 ($47.6 billion). [7] The public also spent $12.4 billion out of pocket on visits to CAM providers, or 25% of that spent out of pocket for conventional physician services ($49.6 billion). [7]
It has been 10 years since the last national estimates on the cost of CAM and on the number of visits to CAM providers were made by Eisenberg and colleagues. [3] That survey varied from the 2007 NHIS in several ways, including being a telephone survey and collecting information differently on the cost of CAM therapies. Nevertheless, comparisons between the two surveys are of special interest given that they collected information on an overlapping, if not identical, set of CAM therapies and that both provide national estimates of costs and visits.
The greatest contrast between the two surveys concerns the relative amount of out-of-pocket dollars spent on CAM providers compared with self-care CAM therapies such as homeopathic products, yoga, and nonvitamin, nonmineral, natural products. The present observation that about two-thirds of CAM costs were associated with self-care therapies contrasts with the findings of Eisenberg et al. [3], who reported that the majority of CAM costs resulted from consultations with health-care professionals offering CAM services. [3] While these differences may be partly attributed to variations in survey methodology, they are consistent with the hypothesis that the use of self-care therapies has increased and the use of CAM health-care professionals has decreased. For instance, using the Consumer Price Index and expressing 1997 costs in 2007 dollars, the out-of-pocket costs in 2007 for CAM practitioner services ($11.9 billion) fell outside the range calculated by Eisenberg et al. ($15.8 billion–$25.3 billion) [3], while the NHIS cost estimate of nonvitamin, nonmineral, natural products is more than twice that estimated by Eisenberg et al. ($14.8 billion vs. $6.6 billion). Some of these differences in estimated expenditures may be the result of differences in how nonvitamin, nonmineral, natural products were operationally defined in the two surveys, or in how cost per purchase was determined, or other differences in survey design and implementation. However, these estimated expenditures are broadly consistent with industry sales data that also demonstrate a large increase in expenditures for nonvitamin, nonmineral, natural products between 1997 and 2007. [8] Industry sales data, however, suggest lower total expenditures for homeopathic medicine than the estimates derived here. [9]
Comparison of the two surveys suggests that the number of visits U.S. adults make to CAM practitioners has dropped by about 50% since 1997—628. [8] million or 3,176 visits per 1,000 adults in 1997 [3] compared with 354.2 million or 1,592 visits per 1,000 adults in 2007. The Eisenberg et al. estimate of visits to CAM providers [3] was even somewhat similar in size to the total number of office visits to physicians [M.D. and doctor of osteopathy (D.O.)] in 1997 (787.4 million). [10] However, the estimated number of office visits to CAM providers in the 2007 NHIS is substantially lower than the projected number of visits to physicians (M.D. and D.O.) for 2007 (more than 902.0 million visits). [11] While some of these discrepancies may result from the different methodologies used in the two surveys, as well as the different types of CAM therapies queried, the 2007 NHIS data suggest that a major factor in the reduction in visits to CAM providers in 2007 compared with 1997 was a decline in the number of adults who sought care from these practitioners and the frequency of this care.
The two practitioner groups that had the largest reduction in visits in 2007 compared with 1997 were practitioners of energy-healing therapies and the various relaxation techniques. Together, the drop in visits to these two groups of practitioners accounted for about half of the total decrease in 2007 from 10 years earlier. Visits to practitioners of relaxation techniques declined from 103.2 million in 1997 (521.2 visits per 1,000 adults) [3] to 28.9 million in 2007 (128.9 visits per 1,000 adults), while visits to energy healers decreased from 40.0 million in 1997 (201.9 visits per 1,000 adults) (3) to 7.2 million in 2007 (32.4 visits per 1,000 adults).
Underlying these declines in the number of visits is a corresponding decrease in the numbers of persons who sought care from practitioners. While 15.3% of persons who used relaxation techniques sought care from a practitioner of relaxation techniques in 1997 [3], the proportion dropped to 9.0% in 2007. For those who saw a practitioner, the number of visits per person in 2007 was about one-fifth of that observed in 1997: 3.5 visits per person compared with 20.9 visits per person [3], respectively. Approximately twice as many individuals bought a self-help book or other materials to learn relaxation techniques in 2007 (6.4 million) as saw a practitioner (3.1 million), suggesting that relaxation techniques are used primarily as self-care. Similarly, the percentage of the adult population who saw a practitioner of energy-healing therapy declined by half in 2007 (0.5%) compared with 1997 (1.0%), while the number of visits per person dropped by almost 90%, from 20.2 visits per person in 1997 to 2.3 visits per person in 2007. [2, 3]
Despite the overall decrease in visits to CAM providers in 2007 compared with 1997, visits to acupuncturists, a progressively more regulated and professionalized CAM provider group, increased over this same time period, with 17.6 million visits estimated for 2007 (79.2 visits per 1,000 adults), or three times that observed in 1997 (27.2 visits per 1,000 adults). [3] The increase for acupuncture may in part be due to the greater number of states that license this practice and a corresponding increase in the number of licensed practitioners in 2007 compared with 1997, as well as increased insurance coverage for these therapies. Large numbers of articles in the lay press about the benefits of acupuncture were published during this period, increasing awareness in the general population. Together, greater opportunity and increased awareness may explain much of the observed increase in adult use of acupuncture.
In summary, NHIS data indicate that the U.S. public makes more than 300 million visits to CAM providers each year and spends billions of dollars for these services, as well as for self-care forms of CAM. These expenditures, although a small fraction of total health-care spending in the United States, constitute a substantial part of out-of-pocket health-care costs and are comparable to out-of-pocket costs for conventional physician services and prescription drug use.
References:
Kaptchuk TJ, Eisenberg DM.
Varieties of Healing 2: A Taxonomy of Unconventional Healing Practices
Annals of Internal Medicine 2001 (Aug 7); 135 (3): 196–204Barnes PM , Bloom B , Nahin RL:
Complementary and Alternative Medicine Use Among Adults and Children:
United States, 2007
US Department of Health and Human Services,
Centers for Disease Control and Prevention,
National Center for Health Statistics, Hyattsville, MD, 2008.Eisenberg DM, Davis RB, Ettner SL, Appel S, Wilkey S, Van Rompay M, Kessler RC.
Trends in Alternative Medicine Use in the United States, 1990 to 1997:
Results of a Follow-up National Survey
JAMA 1998 (Nov 11); 280 (18): 1569–1575National Center for Health Statistics.
National Health Interview Survey (NHIS): 2007 data release [online]. Available from:
http://www.cdc.gov/nchs/nhis/nhis_2007_data_release.htm.National Center for Health Statistics.
National Health Interview Survey (NHIS): Public-use data release. NHIS survey description [online]. Available from:
ftp://ftp.cdc.gov/pub/Health_Statistics/NCHS/Dataset_ Documentation/NHIS/2007/srvydesc.pdf 2008.Research Triangle Institute.
SUDAAN (Release 9.0.1) [computer software].
Research Triangle Park, NC: Research Triangle Institute. 2005.Center for Medicare & Medicaid Services.
National Health Expenditure Projections 1960–2007 [online].
Available from:
http:// www.cms.hhs.gov/National HealthExpendData/01_Overview. asp#TopOfPage
Accessed December 14, 2008.Nutrition Business Journal.
Supplement Business Report 2006. p 31.
San Diego, CA: Penton Media, Inc. 2008.Nutrition Business Journal.
Supplement Business Report 2006. p 202.
San Diego, CA: Penton Media, Inc. 2008.Woodwell DA.
National Ambulatory Medical Care Survey: 1997 summary.
Advance data from vital and health statistics; no 305.
Hyattsville, MD: National Center for Health Statistics. 1999.Cherry DK, Hing E, Woodwell DA, Rechtsteiner EA.
National Ambulatory Medical Care Survey: 2006 summary.
National health statistics reports; no 3.
Hyattsville, MD: National Center for Health Statistics. 2008.Willson S, Stussman B, Maitland A, Nahin RL.
The role of self concept in answering survey questions on complementary
and alternative medicine: Challenges to and strategies
for improving data quality.
Submitted to a refereed journal.
Return to ALT-MED/CAM ABSTRACTS
1-24-2023

| Home Page | Visit Our Sponsors | Become a Sponsor |
Please read our DISCLAIMER |