

Long-term Trajectories of Patients with Neck Pain and
Low Back Pain Presenting to Chiropractic Care:
A Latent Class Growth AnalysisThis section is compiled by Frank M. Painter, D.C.
Send all comments or additions to: Frankp@chiro.org


FROM: European J Pain 2018 (Jan); 22 (1): 103–113 ~ FULL TEXT
L. Ailliet • S.M. Rubinstein • T. Hoekstra • M.W. van Tulder • H.C.W. de Vet
Department of Epidemiology and Biostatistics and the
EMGO Institute for Health and Care Research,
VU University Medical Center,
Amsterdam, The Netherlands.
Background: Information on the course of neck pain (NP) and low back pain (LBP) typically relies on data collected at few time intervals during a period of up to 1 year.
Methods: In this prospective, multicentre practice-based cohort study, patients consulting a chiropractor responded weekly for 52 weeks to text messages on their cell phones. Data from 448 patients (153 NP, 295 LBP) who had returned at least one set of answers in the first 26 weeks were used. Outcome measures were pain intensity (VAS) and functional outcome, assessed using four different questions: pain intensity, limitation in activities of daily living (ADL), number of days with pain in the previous week and number of days limited in ADL. Distinct patterns of pain were analysed with quadratic latent class growth analysis.
Results: The final model was a 4-class model for NP and LBP. The 'recovering from mild baseline pain' is most common (76.3% of NP patients/58.3% of LBP patients) followed by the 'recovering from severe baseline pain' class (16.3% NP/29.8% LBP). They follow similar trajectories when considered over a period of 6 months. Pain at baseline, duration of complaints, functional status, limitations in ADL and the score on psychosocial scales were the variables that most contributed to distinguish between groups.
Conclusions: Most patients with NP or LBP presenting in chiropractic care show a trajectory of symptoms characterized by persistent or fluctuating pain of low or medium intensity. Only a minority either experience a rapid complete recovery or develop chronic severe pain.
Significance: Ninety percentage of patients with neck pain or low back pain presenting to chiropractors have a 30% improvement within 6 weeks and then show a trajectory of symptoms characterized by persistent or fluctuating pain of low or medium intensity. Only a minority either experience a rapid complete recovery or develop chronic severe pain.
From the FULL TEXT Article:
Introduction
Spine problems receive much attention from researchers, clinicians, patients and other stakeholders. In order to establish optimal treatment strategies and to control expenses, it is important to understand the course of spinal pain. Evidence is mounting that back pain episodes can no longer be seen as unrelated events but that they should be viewed in the context of a lifelong pain experience (Dunn et al., 2013b).
Studies in the past on the course of spinal pain have almost exclusively focused on the course of low back pain (LBP). Only one small study in a physical therapy setting reported on the course of neck pain (NP); a total of 50 consecutive patients provided data on five repeated measures over 4 weeks (Walton et al., 2014).
In the past, to chart the course of spinal pain, researchers relied primarily on data collected on a small number of time points during the follow-up period of 3 months to 1 year. Only two studies relied on more frequent data collection to chart the course of LBP: Dunn and colleagues’ study in 2006 used monthly questionnaires by mail over a period of 6 months (Dunn et al., 2006), and Tamcan and colleagues in 2010 used frequent data collection (weekly, during 1 year) by means of a one-page diary via email or postal service (Tamcan et al., 2010). Both studies – one in primary care (Dunn et al., 2006) and one in a general population with people who had reported LBP in two previous surveys (2 years apart; Tamcan et al., 2010) – yielded four clusters representing different pathways of back pain. Dunn and colleagues repeated their study 7 years later with patients from the original cohort: With these additional data collected over a 6-month follow-up period, they demonstrated that most people with back pain (89%) appeared to follow a particular pain trajectory over long time periods (Dunn et al., 2013a), and did not have frequently recurring or widely fluctuating patterns (Leboeuf-Yde et al., 2012).
In the last couple of years, the availability of novel techniques such as data collection through frequent text messaging (SMS) has profoundly changed the methods of data collection in spine research and allows for better charting of the course of spinal pain (Kongsted and Leboeuf-Yde, 2009; Axen et al., 2011, 2012; Kent and Kongsted, 2012; Macedo et al., 2012; Leboeuf-Yde et al., 2013; Eklund et al., 2016). We have used this method in our study.
We studied the course of both NP and LBP in patients presenting to chiropractors in Belgium and the Netherlands. There were three main objectives:(1) to establish, using latent class growth analysis (LCGA), whether there were distinct groups of patients with different pathways of NP or LBP in the 6 months following the first consultation with the chiropractor for their problem;
(2) to determine whether membership in the groups was associated with distinct characteristics at baseline and at followup; and
(3) to determine whether NP and LBP had the same trajectories.
Methods
Study design and population
A prospective, multicentre practice-based cohort study was conducted for patients with NP and/or LBP. Participants were recruited by 97 chiropractors in their clinics in Belgium and the Netherlands (Ailliet et al., 2016). All patients received standard chiropractic care, and treatment was left to the discretion of the chiropractor. The study was approved by the medical ethics committees of the University Ghent, Belgium, under registration number B67020095664 and VU University Medical Center, Amsterdam, the Netherlands, with reference number 08/232.
Recruitment of patients
Recruitment took place between August 26th and December 30th 2010. Patients were recruited from a pool of patients participating in a large cohort study in a chiropractic setting. Interested patients were contacted by one and the same research assistant who explained the study protocol. They were asked whether they wanted to participate in a separate study, examining the course of NP or LBP over the period of 1 year by means of text messages sent to their mobile phones on a weekly basis over a period of 1 year. After consenting over the telephone, patients were included for this part of the study as well.
Inclusion/exclusion criteria
Patients between 18 and 65 years old, who had not visited a chiropractor in the past 6 months, with neck and/or LBP with or without radiation to an extremity as their chief complaint were eligible. Patients had to have a basic understanding of the Dutch language, in both reading and writing. Subjects were excluded if they had a ‘red flag’ (such as a suspected tumour, fracture or infection) or any condition considered to be a contraindication for spinal manipulative therapy such as severe osteoporosis, acute rheumatic episode or extremely high blood pressure values. Patients presenting with both NP and LBP were asked to decide whether they wanted to report on their NP or LBP at the start of the study. During the entire study, patients were sent questions pertaining to that specific body region.
Data collection
Participating patients completed a web-based or a paper version of the baseline questionnaire prior to the first consultation with the chiropractor. This questionnaire collected information on sociodemographic, biomedical and psychological items: sex, age, BMI, level of education, work status, duration of complaints, previous treatment and/or imaging, present level of pain and limitation, patient expectations and fear for the treatment. The levels of distress, depression, fear and somatization were measured via the four scales of the Four-Dimensional Symptom Questionnaire (Terluin, 1996; Terluin and Duijsens, 2002), the patient’s beliefs with regard to the effect of physical activity and work on their spinal complaint via the Fear Avoidance Beliefs Questionnaire (FABQ; Vendrig et al., 1998), social support using the Feij Social Support scale (Feij et al., 1992) and functional status measured by the Neck Disability Index (NDI) for those with NP and the Oswestry Disability Index (ODI) for those presenting with LBP.
Procedure
Over a period of 1 year, four consecutive text messages (SMS) were sent on a weekly basis to participating patients’ mobile phones, starting on the first Friday after inclusion and thereafter repeated every Friday at 2.00 p.m. for 52 weeks.
One SMS was sent for each of the four questions, and replies were given by answering each SMS. Patients could answer at their discretion, but the following question was not sent out before the answer to the preceding question was received. The text message information sent back by the study participants was automatically incorporated into a data file hosted on a server at the provider of the SMS-track system’s office in Denmark (http://www. sms-track.com).
SMS questions
Every week, the following questions were asked:(1) On a scale from 0 to 10 (with 0 = no pain and 10 = worst pain imaginable), how would you rate your NP/LBP today?
(2) On a scale from 0 to 10 (with 0 = not limited in activities of daily living (ADL) at all and 10 = extremely limited in ADL), how much are you limited in your ADL today?
(3) On a scale from 0 to 7, how many days did you experience NP/LBP in the past week?
(4) On a scale from 0 to 7, how many days were you limited in your ADL in the past week?Outcome measure
The outcome measure for this study was ‘pain intensity’ and was measured by the question ‘On a scale from 0 to 10 (with 0 = no pain and 10 = worst pain imaginable), how much NP/LBP do you experience today?’.
In order to describe and interpret the course of the different trajectories, Ostelo and colleagues’ definition of minimal important change was used. A 30% change from baseline was proposed as a clinically meaningful improvement when comparing before and after measures for individual patients (Ostelo et al., 2008). We used the cut-off points for musculoskeletal pain proposed by Boonstra et al. (2014), resulting in the classes 0.1–3.8, 3.9–5.7 and 5.8– 10 cm on the VAS. Since in our study whole numbers were used on the numeric rating scale, we used the correction to the whole number below 5.8. As Von Korff suggested patients reporting a score of >5 on a scale from 0 to 10 as having severe pain, we combined Boonstra’s scores with the cut-off score for severe pain proposed by Von Korff et al. (1992) to make a distinction between mild, moderate and severe levels of pain, and how the different patterns related to that. As a result, patients with mild levels of pain scored 1, 2 or 3, patients with moderate levels of pain scored 4 or 5, and patients with severe levels of pain scored 5 or more on the Numeric Rating Scale.
Functional status was measured at baseline and after 6 and 12 months and scored as continuous variables by the NDI and ODI to allow for a more comprehensive description of the different classes.
Statistical analysis
Data were transmitted from a spread sheet to SPSS 20.0 (SPSS Statistics for Windows, Version 20.0. Armonk, NY, USA: IBM Corp.). When answers other than a number were given, data were manually given a number when possible (e.g. ‘I have no pain’ was recorded as 0). Answers that could not be recoded were coded as missing values.
The objective was to present the results of the study over a period of 1 year, but our data did not allow for this. Due to technical problems with the SMS tracking system, we encountered a large number of missing values. Over a period of 6–9 weeks, no text messages were sent. As a result, all patients had some missing data during the 12-month data collection period. Since patients entered the study at different times over a 4-month period (1 September 1 through 30 December 2011), the missing data were considered to be ‘missing completely at random’ (Little and Rubin, 2002). As a result of the large number of missing data in the last months of the data collection, we were only able to use the data set of the first 6 months of data collection.
Distinct patterns of pain were analysed with quadratic LCGA in Mplus. LCGA models are contemporary regression-based models used to unravel heterogeneity in pain development. This is done by identifying k number of distinct populations or classes on the basis of developmental pain patterns.
We did investigate the need for freeing up withinclass variance parameters. Using a commonly applied approach, we first modelled several latent class growth models (i.e. analogous to group-based models) to obtain the optimal number of classes. After the optimal number of classes was chosen, we assessed the need to free up within-class variance parameters. The final model actually included estimated within-class variance for the intercept, but slope variances were fixed within classes.
We aimed to establish whether there were distinct subgroups of patients with different trajectories of pain during 6 months of follow-up. Analyses were conducted separately for NP and back pain patients, and we followed the same analysis strategy for both patient groups.
We included patients with at least one pain measurement during follow-up. Because the analyses assume that missing data are missing at random (MAR), and we have no reason to assume otherwise (this mechanism is difficult to test (Enders, 2010; Potthoff et al., 2006)) we – after careful consideration – employed this common inclusion procedure (Muthen, 2003; Jung and Wickrama, 2008; Enders, 2010; Hoekstra et al., 2011).
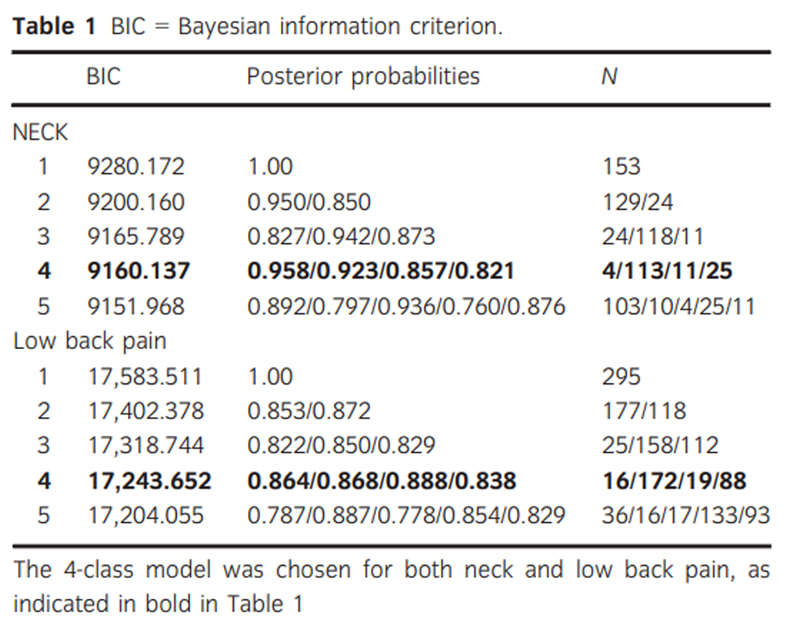
The final model was chosen based on a stepwise procedure (Jung and Wickrama, 2008). This procedure starts with a one-class solution, then adding one class at the time. To determine the final model, we used several statistical fit indices. First, we used the Bayesian information criterion (BIC; Raftery, 1995; Schwarz, 1978). The BIC considers both the likelihood of the model and the number of parameters in the model. A lower BIC indicates a better fitting model. Additionally, we took the posterior probabilities into account (Jung and Wickrama, 2008). For each patient, these probabilities are calculated and provide information of the likelihood of that patient to belong to each of the obtained classes. The probability of the class to which a certain patient is ultimately assigned to should be considerably higher than the probability of belonging to another group and should be at least 0.8 (Goodman, 2007). In this way, the classes are clearly distinguishable from each other.

Table 2
Table 3
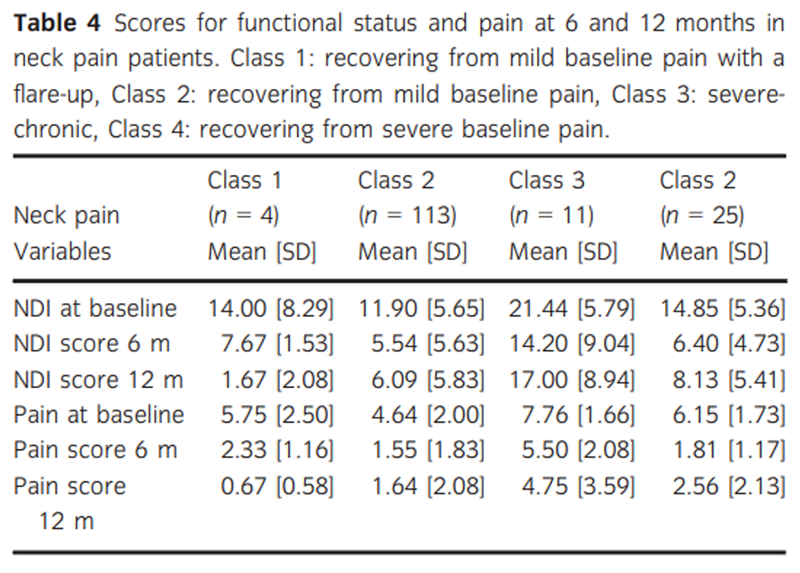
Table 4
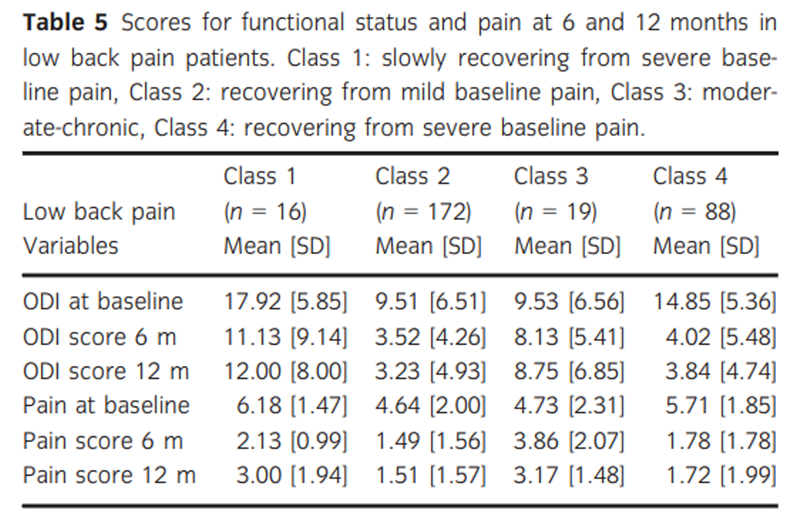
Table 5 Based on previous literature, we assessed models with linear, quadratic and cubic trajectory shapes. After the optimal number of trajectories was chosen, we assessed the need for freeing up within-class variance parameters as suggested (Hox, 2010; Muthen and Muthen, 2010; Hoekstra, 2013).
Classification of patients into their best fitting class was carried out using the SAVEDATA option in Mplus (MPLUS (Version 6.11). [Computer Software]. Los Angeles, CA, USA: Muthen & Muthen). The variables were subsequently imported into SPSS for further analyses.
We aimed to determine whether membership to each of the trajectories could be explained by characteristics measured at baseline and/or at follow-up. Characteristics of the obtained trajectories were described accordingly: means (SD) or median (IQR) for continuous variables and percentages for categorical variables. Results are presented in Tables 2 and 3.
We compared the trajectories for the NP patients (Table 4) with those of the LBP patients (Table 5). We checked whether all identified classes were clinically relevant, even though they were mathematically appropriate. This was not done with statistical techniques but based on our careful clinical judgement. Two of the authors, both with >20 years of clinical experience, checked whether the identified classes corresponded to the patterns they see in clinical practice. This method has also been reported in earlier work (Kongsted and Leboeuf-Yde, 2009).
Results
In total, of the 917 patients from the original cohort study, 495 patients (169 NP, 326 LBP) agreed to participate in this aspect of the study. This data set contained only those patients who had returned at least one set of answers between the 1st and the 26th week (which is a common inclusion criterion within LCGA): 153 patients (58 from Belgium and 95 from the Netherlands) with NP (90.5%) and 295 patients (112 from Belgium and 183 from the Netherlands) with LBP (90.5%) fulfilled this criterion. The baseline characteristics of those patients agreeing to participate in this aspect of the study did not differ significantly from the baseline characteristics of those patients from the original cohort that did not agree to participate (Supporting information, Table S1).
Regarding the number of missing data and the number of different patterns, we found 226 missing data patterns with very little overlap between patients; that is, some patients miss one or more data points of the earlier weeks, whereas some patients miss one or more of the middle period or the last. There is no structured pattern visible. Moreover, missing data coverage of at least 0.10 is advised for latent class models, and in no model, our coverage approximated this value. For back pain patients, the coverage ranged from 0.895 for week 1 (highest), to 0.369 for week 26 (lowest), indicating that 89.5% of the patients have valid data for at least week 1 and 36.9% have valid data for week 26. It should be noted that 13 patients only had one follow-up measurement and these patients were classified in all four trajectories. Overall, the majority of the patients had valid data at most of the weeks. The missings in the data on patients with LBP can be found in Appendix 1.
The quadratic latent class model was used, and chosen over the linear and cubic models since both latter models resulted in worse fit (e.g. for the back pain patients; 4-class linear BIC = 17,507.449, 4-class quadratic BIC = 17,243.652 and 4-class cubic BIC = 17,127.128, but with similar trajectory shapes, thus leading to the choice for the more parsimonious model (Muthen, 2003; Hoekstra, 2013; Jung and Wickrama, 2008)). Moreover, for the cubic models, we additionally encountered some convergence issues due to very small cubic slope values. Ultimately, the quadratic models were also chosen based on substantive theory and model parsimony.
Table 1
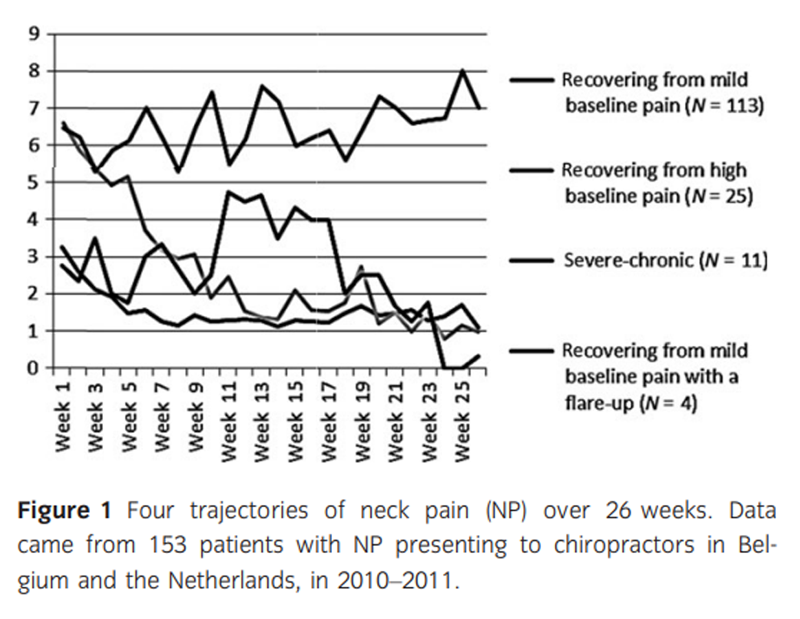
Figure 1
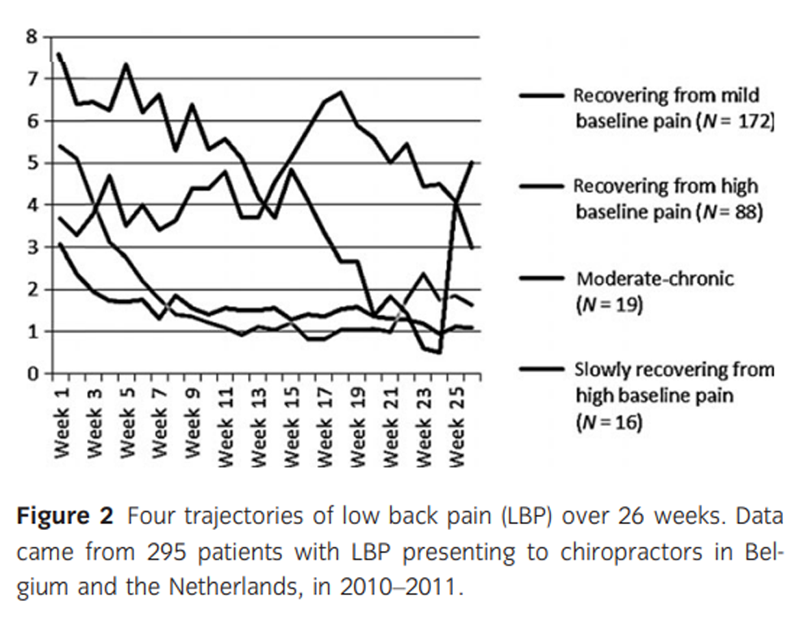
Figure 2 We identified distinct groups of patients with different patterns of NP or LBP in the 6 months following the first consultation with the chiropractor for their problem. Based on the model indices described previously, the final model was a 4-class model for both the neck pain and LBP patients. Table 1 shows the different class solutions. Although the BIC for the 4-class solutions was lower in both the 5-class solutions, posterior probabilities fell below the cutoff point of 0.8. Low posterior probabilities indicate cloudy, or less distinctive classes. Thus, we decided on the 4-class model in both groups. The pain patterns or trajectories of NP and LBP are presented in Figures 1 and 2, respectively. The ‘recovering from mild baseline pain’ and the ‘recovering from severe baseline pain’ classes represent the large majority of patients with NP and LBP, and follow similar trajectories when considered over a period of 6 months.
Within the NP population, the ‘recovering from mild baseline pain’ class was the most prevalent (73.9%), representing those patients who start with mild levels of pain (3.3/10), demonstrate a 30% reduction in pain within 3 weeks and subsequently remain at very low levels of pain throughout the follow-up period of 26 weeks. The ‘recovering from severe baseline pain’ class was the second most prevalent with 16.3%, representing those patients who begin with severe pain (6.6/10), experience a 30% reduction of pain within 6 weeks and subsequently remain at very low levels of pain. The ‘severe-chronic’ class is less common with 7.2%, representing those patients who had permanently high levels of pain. The smallest class with 2.6% is the ‘recovering from mild baseline pain with a flareup’ class. Their pattern more or less followed the pattern of class 1 and showed a flare-up around week 11 lasting for 6 weeks, before evolving to very low levels of pain.
Within the LBP population, the ‘recovering from mild baseline pain’ class was also the most prevalent (58.3%), representing those patients who start with mild levels of pain (3.1/10), demonstrate a 30% reduction in pain within 3 weeks and subsequently remain at very low levels of pain throughout the follow-up period of 26 weeks. The ‘recovering from severe baseline pain’ class was the second most prevalent with 29.8%, representing those patients who begin with moderate pain (5.4/10), experience a 30% reduction of pain within 4 weeks and subsequently remain at very low levels of pain. The ‘moderate-chronic’ class is less common with 6.5%, representing those patients with moderate to high levels of pain. The smallest class with 5.4% is the ‘slowly recovering from high baseline pain’ class, representing those patients who have severe levels of pain (7.6/10) at baseline and experience a 30% reduction of pain within 12 weeks.
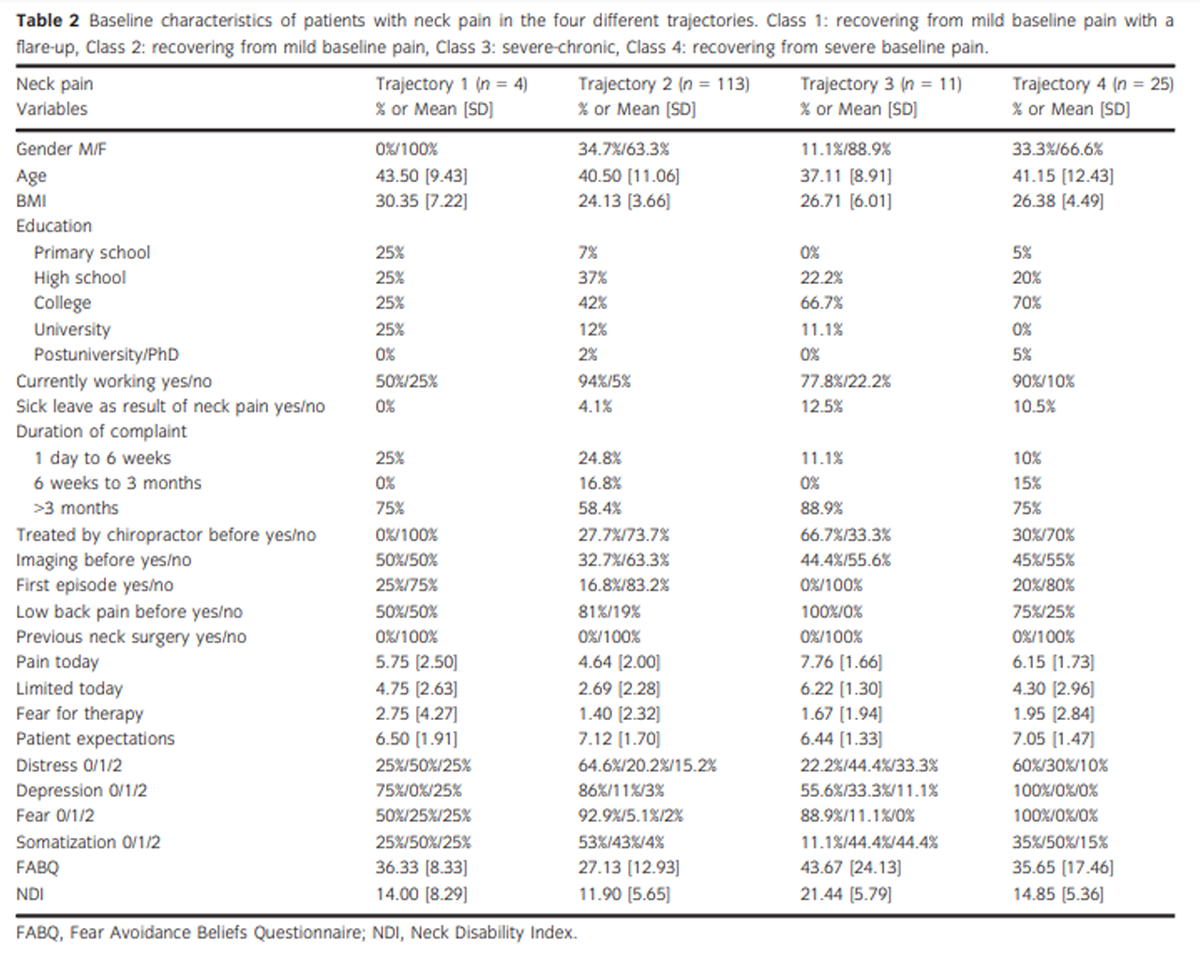
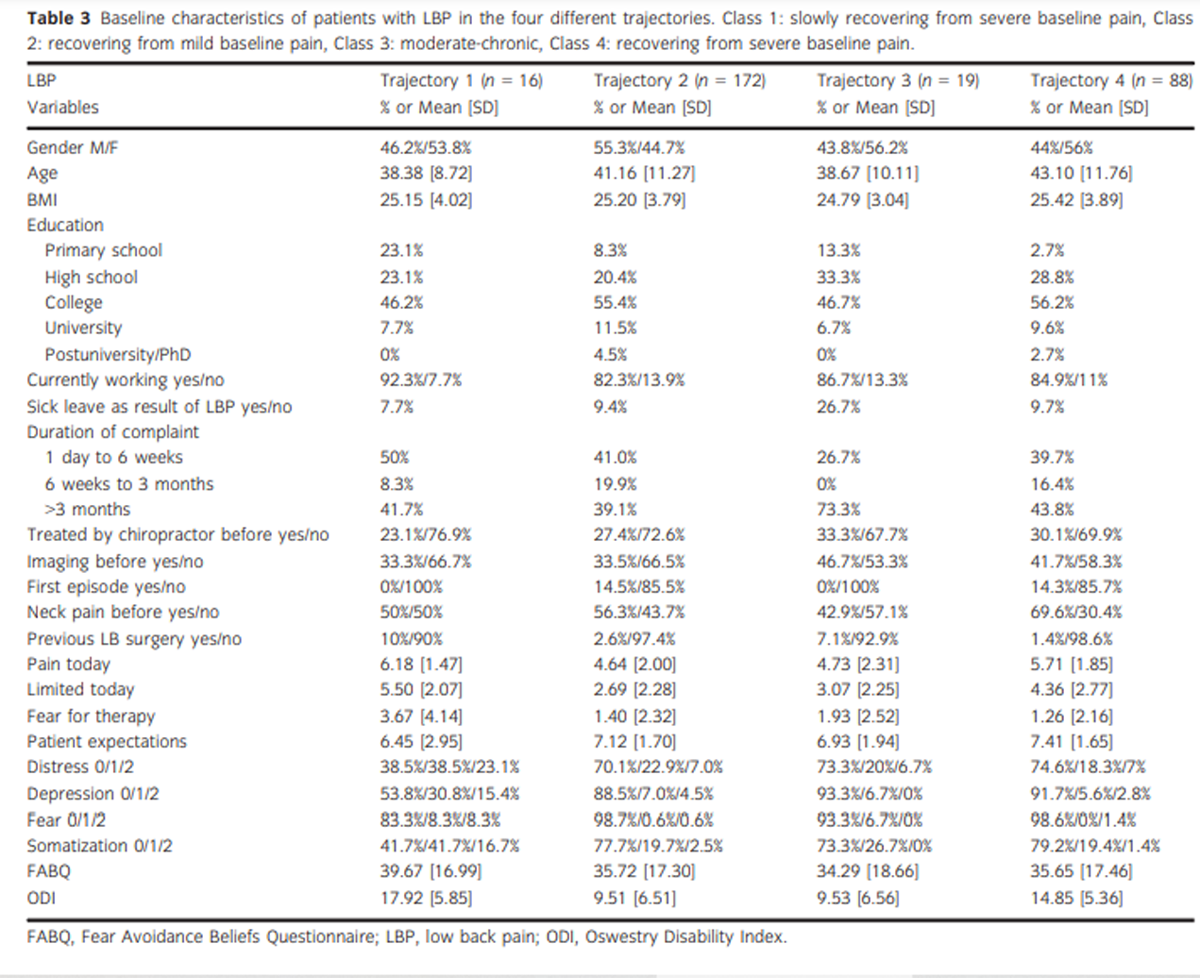
Our results show that the majority of patients treated by chiropractors for nonspecific NP or LBP do get better, regardless of their pain at baseline. Table 2 represents the baseline characteristics of the patients with NP in the different classes, and Table 3 represents the baseline characteristics of the patients with LBP in the different classes.
For NP, the ‘recovering from mild baseline pain’ and the ‘severe-chronic’ classes were different from each other, with different patient characteristics at baseline. Class 4 is a very small group, but their baseline characteristics are different from those of the three other classes. The largest group of NP patients (recovering from mild baseline pain class) is characterized by the lowest pain at baseline and had the lowest percentage of chronic NP patients, the least previous imaging, the lowest subjective functional limitations (NDI score), the lowest score on fear for treatment, the highest patient expectations, the lowest score on the four categories of the FourDimensional Symptom Questionnaire (4DSQ – i.e. distress, depression, fear/anxiety and somatization) and the lowest score on the FABQ. The class on the other end of the spectrum, the ‘severe-chronic’ class, had completely opposite baseline characteristics.
For LBP patients, the distinction between the baseline patient characteristics for the four different groups was less pronounced than for NP patients. For patients with LBP, patients belonging to the ‘slowly recovering from severe baseline pain’ class had baseline characteristics that were clearly different from those in the other three classes. However, also in between these three classes, there were clear differences, such as in the level of education, duration of the complaint, sick leave, previous imaging and previous back pain. The ‘slowly recovering from severe baseline pain’ class, representing the smallest group of LBP patients, was the class characterized by the highest pain at baseline and had the highest subjective functional limitations (ODI score), the highest score on fear for treatment, the lowest patient expectations, the highest score on the four categories of the 4DSQ and the highest score on the FABQ.
We aimed to determine whether membership to each of the trajectories could be explained by characteristics measured at baseline and/or at follow-up. Membership in different classes and its association with subsequent outcome for functional status and pain at 6 and 12 months are presented in Table 4 for patients with NP and in Table 5 for those with LBP. There was very little to no within-class change over time in pain or functional status for patients with LBP at 6 and at 12 months. For patients with NP, classes 1, 2 and 3 display worse scores on functional status at 12 months compared to their scores at 6 months, and classes 1 and 2 have higher pain scores at 12 months than at 6 months.
Comparing the trajectories for LBP patients and NP patients, we see that classes 2 and 4 are the same for NP and LBP and that classes 1 and 3 represent similar but not the same pain trajectories over a period of 26 weeks. Class 1 represents those NP patients recovering from mild pain, and the LBP patients recovering from severe pain. Class 4 represents the stable groups: For NP, it is stable and severe, and for LBP, it is stable and moderate. All four patterns, for both NP and LBP, are encountered in clinical practice.
Discussion
We classified NP and LBP patients into distinct groups using LCGA of detailed longitudinal data on the course of their pain over time. Both NP patients and patients presenting with LBP each demonstrated four distinct groups with different trajectories of pain in the 6 months following the first consultation with the chiropractor.
To our knowledge, it is the first time that the course of NP has been depicted and described based on frequent and detailed longitudinal data over a period of 26 weeks. The NP trajectories we found can therefore not be compared with other models.
We used the same outcome measure, pain intensity, as in Dunn’s study (Dunn et al., 2006). Axen used bothersomeness as outcome measure, whereas Leboeuf-Yde et al. (2013) and Kongsted and Leboeuf-Yde (2009) used number of days with pain.
The trajectories that we found for LBP resemble the patterns found by Axen et al. (2011). On the other hand however, the trajectories that we found differed greatly from the models proposed by Dunn et al. (2006). Our data neither followed the findings from the Nordic back pain subpopulation programme, showing nine different patterns in LBP patients followed over a period of 18 weeks (Kongsted and Leboeuf-Yde, 2009). Also the episodic trajectory, where patients have episodes of LBP and pain free periods of at least one month in between as found by Leboeuf-Yde et al. (2013) in a population of 261 49/50-year-olds, could not be reproduced by our data. Only the ‘recovering from mild baseline pain’ trajectory, albeit the largest group, is similar to the ‘recovering’ trajectory from Dunn et al. (2006). This discrepancy can possibly be explained by the differences in patient population. The study by Dunn et al. (2006) comprised of 342 primary care LBP consulters. Although not specified in the methods section of the studies, one can assume that Dunn’s patient population resembled the patient population of Croft et al. (1998), who did a study in two large general practitioner practices in Manchester. Those patients received ‘usual care’ and were not routinely referred for a specific form of therapy. Croft concluded that ‘since most consulters continue to have long=-term LBP and disability, effective early treatment could reduce the burden of these symptoms and their social, economic, and medical impact’ (Croft et al., 1998). Our study included 448 patients who were treated by a chiropractor.
The identified trajectories in our study reinforce one of the conclusions made by Kongsted and colleagues that, for most patients, LBP is not a condition from which they either experience a rapid complete recovery or develop chronic severe pain. Rather, LBP is a condition of persistent or fluctuating pain of low or medium intensity (Kongsted et al., 2016).
Neck pain and LBP have similar but not the same pain trajectories over a period of 26 weeks. Two trajectories, the ‘recovering from mild baseline pain’ and the ‘recovering from severe baseline pain’, are nearly identical. These two trajectories are also the most common. The other two trajectories show a specific course for NP and LBP. However, both for NP (severe chronic and recovering from mild baseline pain with a flare-up) and for LBP (moderate chronic and slowly recovering from severe baseline pain), these trajectories result from a smaller number of patients. As a result of dropouts, or missing data over a period of time, especially in those classes with a smaller number of patients (classes 3 and 4), the course could be estimated less reliably, and therefore, the trajectory might have a different pattern than depicted in the figures at the end of the 26 weeks. It was the intention of the research team to chart both NP and LBP over a period of 1 year, but large dropout rates up to 80% in the later stages of the study made LCGA impossible.
Strengths and weaknesses
A strength of this study was the use of a relatively novel method of data collection, the use of frequent SMS data collection over a longer period of time. This allowed us to precisely chart the trajectories of NP and LBP. Another major strength of this study was the large number of patients with NP and LBP who participated in this study. This allowed for analyses with great precision. Moreover, it provided the opportunity to examine the consistency of the results by presenting the comparisons for patients with NP and LBP separately. Although some classes were very small (2.6% for Class 4 in NP patients), in LCGA separate classes are statistically corrected from 1% and the posterior probabilities’ value of Class 4 is close to 1 (0.958) and thus very good. In addition, Class 4 describes a pattern where patients with NP experience a flare-up; this is also observed in clinical practice.
The use of text messages via mobile phones to collect frequent data has the advantage of being cheap and user-friendly (Axen et al., 2012); most people nowadays carry their phone with them at all times and thus can respond at any time. Further, it has been shown to be capable of yielding valid data (Whitford et al., 2012; Richmond et al., 2015). However, the questions asked are restricted by the size of the text message (maximum 140 characters). Our study showed that researchers should strictly follow-up on the weekly answers by all the participants: About 20% of those people agreeing to participate in the weekly follow-up by SMS failed to reply to the first set of four questions and never entered the study. Also, technical problems from the provider or the participant can occur, leading to missing data. In our study, due to technical problems the sending of text messages was interrupted for a period of 6–9 weeks. Although this was detected by the research group within 2 weeks, it took many weeks for the providers to come up with a solution. As this was an incident, it is plausible that these missing responses were missing completely at random. LCGA uses multiple imputation to handle these missing data. Latent class growth models assume that the missing values are MAR. Although this assumption is difficult to test, the Mplus software offers robust opportunities to assess the missing data in as much detail as possible. Through the PATTERNS option, we are able to assess the missing data on the individual level (Muthen and Muthen, 2012). Mplus provides information about the number and frequency of missing data patterns, and in fact, several studies have shown that indeed in the case of Missing At Random (MAR) or Missing Completely At Random (MCAR) MAR or MCAR, results of these latent class models are robust, that is resulting in comparable trajectories in sensitivity analyses (Muthen, 2003; Muthen and Muthen, 2010; Hoekstra et al., 2011). To maximize the effectivity of collecting data via SMS, it appears that the system might need a research assistant to closely monitor the entire process, thereby compromising or even undoing the monetary advantages of the follow-up via text messaging. Macedo et al. (2012) found that SMS supplemented by phone interviews for those not responding increased the response rate from 60% to 95%.
Our data show that the majority of patients treated by chiropractors for nonspecific NP or LBP do get better, regardless of their pain at baseline. Patients not responding within 6 weeks of treatment do not seem to benefit from chiropractic care, and thus, treatment should not be continued beyond this point. Axen and colleagues described a cluster of patients in a similar patient population. They called it the ‘typical patient’ group, with medium bothersomeness at baseline and an average improvement over the first 4–5 weeks (Axen et al., 2011). Our data can help primary care physicians and other healthcare clinicians including chiropractors to inform patients on the course of NP or LBP when treated by chiropractic.
Future research efforts to chart musculoskeletal pain in similar and other disciplines working with NP and LBP patients should exert special attention to closely monitor the SMS data collection, as large data sets with very few missing data could provide invaluable information and might challenge or confirm the four-cluster model proposed in this paper.
Conclusion
Most patients with NP or LBP presenting in chiropractic care show a trajectory of symptoms characterized by persistent or fluctuating pain of low or medium intensity. Only a minority either experience a rapid complete recovery or develop chronic severe pain. The two most common classes ‘recovering from mild baseline pain’ and ‘recovering from high baseline pain’ were consistent for both NP and LBP and accounted for 90% of the patients. The other two classes were less frequent and differed between NP and LBP patients. The four different classes showed distinct baseline patient characteristics and outcome in pain and functional status at 6 and 12 months
Supplementary Material
Table S1 Baseline characteristics of patients in the entire cohort versus the baseline characteristics of those patients in the trajectory study.
Appendix 1 Missings patients with low back pain.Author contributions
All authors provided concept/idea/research design and writing. Mr Ailliet provided data collection. Mr Ailliet, Dr Rubenstein, and Dr Hoekstra provided data analysis. Dr Rubenstein, Professor van Tulder, and Professor de Vet provided project management. Mr Ailliet, Dr Rubenstein, and Professor de Vet provided fund procurement. Mr Ailliet and Dr Rubenstein provided participants. Dr Rubenstein and Professor de Vet provided facilities/equipment. Professor de Vet provided institutional liaisons. Dr Rubenstein, Dr Hoekstra, Professor van Tulder, and Professor de Vet provided consultation (including review of manuscript before submitting).
References:
Ailliet, L., Rubinstein, S., Knol, D., van Tulder, W., de Vet, H. (2016).
Somatization is associated with worse outcome in a chiropractic
patient population with neck pain and low back pain.
Man Ther 21, 170–176.Axen, I., Bodin, L., Bergstrom, G., Halasz, L., Lange, F. et al. (2011).
Clustering Patients on the Basis of Their Individual Course
of Low Back Pain Over a Six Month Period
BMC Musculoskelet Disord. 2011 (May 17); 12: 99Axen, I., Bodin, L., Bergstrom, G., Halasz, L., Lange, F. et al. (2012).
The use of weekly text messaging over 6 months was a feasible method
for monitoring the clinical course of low back pain
in patients seeking chiropractic care.
J Clin Epidemiol 65, 454–461.Boonstra, A., Schiphorst Preuper, H., Balk, G., Stewart, R. (2014).
Cut-off Points for Mild, Moderate, and Severe Pain
on the Visual Analogue Scale for Pain in Patients
with Chronic Musculoskeletal Pain
Pain 2014 (Dec); 155 (12): 2545–2550Croft, P., Macfarlane, G., Papageorgiou, A. (1998).
Outcome of low back pain in general practice:
A prospective study
British Medical Journal 1998 (May 2); 316 (7141): 1356–1359Dunn, K., Jordan, K., Croft, P. (2006).
Characterizing the Course of Low Back Pain:
A Latent Class Analysis
American J Epidemiology 2006 (Apr 15); 163 (8): 754–761Dunn, K., Campbell, P., Jordan, K. (2013a).
Long-term Trajectories of Back Pain:
Cohort Study With 7-year Follow-up
BMJ Open. 2013 (Dec 11); 3 (12): e003838Dunn, K., Hestbaek, L., Cassidy, J. (2013b).
Low Back Pain Across the Life Course
Best Pract Res Clin Rheumatol 2013 (Oct); 27 (5): 591-600Eklund, A., Jensen, I., Lohela-Karlsson, M., Leboeuf-Yde, C., Axen, I. (2016).
Absence of Low Back Pain to Demarcate an Episode:
A Prospective Multicentre Study in Primary Care
Chiropractic & Manual Therapies 2016 (Feb 18); 24: 3Enders, C. (2010).
Applied Missing Data Analysis
(New York: The Guildford Press).Feij, J.A., Doorn, C.D., van Kampen, D., van den Berg, P.T., Resing, W.C.M. (1992).
Sensation seeking and social support as moderators of the relationship
between life events and physical illness/psychological distress.
In Lifestyles Stress and Health, J.A.M. Winnubst, S. Maes, eds.
(Leiden: DSWO Press) pp. 285–302.Goodman, L. (2007).
On the assignment of individuals to classes.
Sociol Methodol 37, 1–22.Hoekstra, T. (2013).
Applied latent class models for epidemiology
(PhD thesis. Amsterdam: Mostert).Hoekstra, T., Barbosa-Leiker, C., Koppes, L., Twisk, J. (2011).
Developmental trajectories of body mass index throughout the life course:
An application of Latent Class Growth (Mixture) Modelling.
Longit Life Course Stud 2, 319–330.Hox, J.J. (2010).
Multilevel Analysis Techniques and Applications, 2nd edition
(New York and Hove: Routledge).Jung, T., Wickrama, K. (2008).
An introduction to latent class growth analysis and growth mixture modelling.
Soc Pers Psychol Compass 2, 302–317.Kent, P., Kongsted, A. (2012).
Identifying clinical course patterns in SMS data using cluster analysis.
Chiropr Man Therap 20, 20.Kongsted, A., Leboeuf-Yde, C. (2009).
The Nordic Back Pain Subpopulation Program: Individual Patterns
of Low Back Pain Established by Means of Text Messaging:
A Longitudinal Pilot Study
Chiropractic & Osteopathy 2009 (Nov 17); 17: 11Kongsted, A., Kent, P., Axen, I., Downie, A., Dunn, K. (2016).
What Have We Learned From Ten Years of
Trajectory Research in Low Back Pain?
BMC Musculoskelet Disord. 2016 (May 21); 17 (1): 220Leboeuf-Yde, C., Fejer, R., Nielsen, J., Kyvik, K., Hartvigsen, J. (2012).
Pain in the Three Spinal Regions: The Same Disorder?
Data From a Population-based Sample of
34,902 Danish Adults
Chiropractic & Manual Therapies 2012 (Apr 5); 20: 11Leboeuf-Yde, C., Lemeunier, N., Wedderkopp, N., Kjaer, P. (2013).
Evidence-based Classification Of Low Back Pain
In The General Population: One-year
Data Collected With SMS Track
Chiropractic & Manual Therapies 2013 (Sep 2); 21: 30Little, R., Rubin, D. (2002).
Statistical Analysis With Missing Data.
Probability and Statistics
(Hoboken, NJ: John Wiley and Sons).Macedo, L., Maher, C., Latimer, J., McAuley, J. (2012).
Feasibility of using short message service to collect
pain outcomes in a low back pain clinical trial.
Spine 37, 1151–1155.Muthen, B. (2003).
Statistical and substantive checking in growth mixture modeling.
Psychol Methods 8, 369–377.Muthen, L., Muthen, B. (2010).
Mplus User’s Guide, 5th edition
(Los Angeles, CA: Muthen & Muthen).Muthen, L. and Muthen, B. (2012).
Mplus 7.0 (Computer program).Ostelo, R., Deyo, R., Stratford, P., Waddell, G., Croft, P. (2008).
Interpreting change scores for pain and functional status in low back pain.
Spine 33, 90–94.Potthoff, R., Tudor, G., Pieper, K., Hasselblad, V. (2006).
Can one assess whether missing data are missing
at random in medical studies?
Stat Methods Med Res 15, 213–234.Raftery, A. (1995).
Bayesian model selection in social research.
Sociol Methodol 25, 111–163.Richmond, S., Keding, A., Hover, M., Gabe, R., Cross, B. (2015).
Feasibility, acceptability and validity of SMS text messaging for
measuring change in depression during a randomized controlled trial.
BMC Psychiatry 15, 68.Schwarz, G. (1978).
Estimating the dimension of a model.
Ann Stat 6, 461–466.Tamcan, O., Mannion, A., Eisenring, C., Horisberger, B. (2010).
The course of chronic and recurrent low back pain in the general population.
Pain 150, 451–457.Terluin, B. (1996).
De Vierdimensionale Klachtenlijst (4DKL): Een vragenlijst voor het meten
van distress, depressie, angst en somatisatie.
[the Four-Dimensional Symptom Questionnaire (4DSQ). A questionnaire
to measure distress, depression, fear and somatisation].
Huisarts Wet 39, 538–547.Terluin, B., Duijsens, I. (2002).
4DKL-Handleiding: Handleiding van de Vierdimensionale Klachtenlijst
(Leierdorp: Datec). http://www.datec.nl/4DKL/Vendrig, A., Deutz, P., Vink, I. (1998).
Nederlandse vertaling en bewerking van de Fear-Avoidance Beliefs Questionnaire.
Ned Tijds Pijn en Pijnbestrijding 18, 11–14.Von Korff, M., Ormel, J., Keefe, F. (1992).
Grading the severity of chronic pain.
Pain 50, 133–149.Walton, D., Eilon-Avigdor, Y., Wonderham, M., Wilk, P. (2014).
Exploring the Clinical Course of Neck Pain
in Physical Therapy: A Longitudinal Study
Arch Phys Med Rehabil. 2014 (Feb); 95 (2): 303–308Whitford, H., Donnan, P., Symon, A., Kellett, G. (2012).
Evaluating the reliability, validity, acceptability, and practicality
of SMS text messaging as a tool to collect research data:
Results from the Feeding Your Baby project.
J Am Med Inform Assoc 19, 744–749.
Return to CHRONIC NECK PAIN
Return to TRAJECTORIES OF BACK PAIN
Since 9-24-2023
| Home Page | Visit Our Sponsors | Become a Sponsor |
Please read our DISCLAIMER |