

US Spending on Complementary and Alternative Medicine
During 2002-08 Plateaued, Suggesting Role
in Reformed Health SystemThis section is compiled by Frank M. Painter, D.C.
Send all comments or additions to: Frankp@chiro.org


FROM: Health Affairs 2013 (Jan); 32 (1): 45–52 ~ FULL TEXT
OPEN ACCESS Matthew A Davis, Brook I Martin, Ian D Coulter, William B Weeks
Dartmouth Institute for Health Policy and Clinical Practice,
Lebanon, NH, USA.

FROM: Davis, Health Affairs 2013Complementary and alternative medicine services in the United States are an approximately $9 billion market each year, equal to 3 percent of national ambulatory health care expenditures. Unlike conventional allopathic health care, complementary and alternative medicine is primarily paid for out of pocket, although some services are covered by most health insurance. Examining trends in demand for complementary and alternative medicine services in the United States reported in the Medical Expenditure Panel Survey during 2002–08, we found that use of and spending on these services, previously on the rise, have largely plateaued. The higher proportion of out-of-pocket responsibility for payment for services may explain the lack of growth. Our findings suggest that any attempt to reduce national health care spending by eliminating coverage for complementary and alternative medicine would have little impact at best. Should some forms of complementary and alternative medicine-for example, chiropractic care for back pain-be proven more efficient than allopathic and specialty medicine, the inclusion of complementary and alternative medicine providers in new delivery systems such as accountable care organizations could help slow growth in national health care spending.
From the FULL TEXT Article:
Background
Health care spending growth in the United States continues to be a national concern, despite having slowed somewhat in recent years. [1, 2] Therefore, health care policy makers, payers, and other stakeholders continue to consider strategies aimed at reducing, or at least containing, health care spending. One approach to reducing health care spending is to restructure benefits so as to reduce access to particular health care services. However, to avoid potential unintended consequences, such a strategy must be informed by knowledge of current health care spending.
Complementary and alternative medicine has been immensely popular in the United States since the 1990s and is used regularly by more than one-third of adult Americans. [3–5] Today, complementary and alternative medicine comprises an eclectic mix of self-administered products and activities including herbal medicines, homeopathic remedies, dietary supplements, and yoga, as well as provider-based services such as chiropractic care, massage therapy, and acupuncture.
Largely because of their popularity among the public, some complementary and alternative medicine services are now offered as benefits in state Medicaid programs, Medicare, and private health insurance plans. [6] For instance, chiropractic care — the most established complementary and alternative medicine service in the United States, with more than a 100–year history — is covered to some extent by most private health insurance plans, Medicare, many state Medicaid programs, and military health insurance plans. [6, 7] In the current health policy climate, eliminating complementary and alternative medicine services from health insurance benefits might be considered as a way to help control national health care spending.
However, very little is known about US spending patterns on complementary and alternative medicine services. Recent efforts to estimate the extent to which these services are used have focused on utilization, such as visits for such services, rather than on spending patterns and have altogether neglected payments by third-party payers. [8, 9] It is generally believed that the use of complementary and alternative medicine services has increased in recent years. [10] However, a better understanding of national spending in this arena would inform health policy makers’ decisions regarding future coverage.
A closer examination of spending patterns on complementary and alternative medicine services may also provide insight into how a more “cash-based” health care market, in which patients were responsible for higher out-of-pocket copayments, matures and might fluctuate with changing economic conditions. In many ways the complementary and alternative medicine market is an amalgam of the conventional health care sector and a free-market economy—generally under less governmental influence and with a higher proportion of costs paid out of pocket than is the case in the market for conventional allopathic medicine.
Therefore, we sought to examine recent trends in expenditures on complementary and alternative medicine, with two goals in mind. The first was to define the size of the complementary and alternative medicine market, so that health policy makers could better understand the potential effect of further limiting reimbursement for such services. The second was to determine whether this more cash-based health care market is exhibiting signs of market maturity—the point where demand for services, as indicated by the price consumers are willing to spend—is balanced with the supply of services. [11]
Study Data And Methods
To obtain information on complementary and alternative medicine services use and spending in the United States, we analyzed data from the Medical Expenditure Panel Survey from 2002 to 2008. [12] The Medical Expenditure Panel Survey is a survey of the noninstitutionalized US population that is conducted annually by the Agency for Healthcare Research and Quality. It is a validated source of nationally representative health care information and is frequently used to make national estimates of health care use and spending, health status, and visits to health care providers. [13] It uses an overlapping panel design consisting of household, medical care provider, and insurance provider components.
This study was determined to be exempt from Institutional Review Board review by Dartmouth College’s Committee for the Protection of Human Subjects.
SAMPLE
We analyzed data from all adult participants (age eighteen or older) in the Medical Expenditure Panel Survey from 2002 to 2008. We chose this survey because it is the only ongoing source of data on US complementary and alternative medicine expenditures, and we chose this time period because the survey consistently collected information on such services during those years.
Total survey sample sizes in our time frame ranged from a low of 29,370 subjects in 2007 to a high of 37,418 in 2002. Response rates ranged from 57 percent in 2007 to 65 percent in 2002.
At each interview, survey participants were asked if they had seen a health care provider in the past six months and, if so, what type of provider they visited, how many visits were made, and how much was spent on the service. Starting in 2002 the survey recorded if the provider was an “acupuncturist,” “chiropractor,” “massage therapist,” or “other complementary and alternative medicine care professional,” including “homeopathic, naturopathic, or herbalist.” The number of adult study participants who reported having seen any complementary and alternative medicine provider ranged from a low of 1,236 out of 23,183 in 2008 to a high of 1,597 out of 27,283 in 2002.
If the respondent reported having seen a health care provider, the data collectors proceeded to contact the participant’s provider and health insurance plan to verify information regarding utilization—that is, visit dates and details of office-based or outpatient visits—and expenditures.
COMPLEMENTARY AND ALTERNATIVE MEDICINE SPENDING AND AMBULATORY VISITS
The Medical Expenditure Panel Survey designates ambulatory visits to health care providers as either office-based or outpatient “events.” An out-patient event is an ambulatory visit to an out-patient facility within a hospital; an office-based event is a visit to a health care provider’s office. To acquire information on the total number of annual ambulatory visits and expenditures on complementary and alternative medicine provider services, we combined office-based and outpatient events.
To determine the relative amount spent on complementary and alternative medicine services over time, we calculated the fraction of total national ambulatory health care expenditures and total national health care expenditures accounted for by these services.
ANALYSES
We converted all health care spending data to 2008 dollars using the Consumer Price Index for professional medical services. [14] We used linear regression adjusted for study participants’ age, sex, and health insurance status to test for trends from 2002 to 2008 in the mean number of visits to complementary and alternative medicine providers and inflation-adjusted mean expenditures per user. We examined the significance for the coefficient for year as a categorical variable. For our linear regressions on inflation-adjusted expenditures per user, we transformed complementary and alternative medicine expenditures into a logarithmic scale.
We used complex survey design methods to generate all descriptive analyses of the data sets, using Stata statistical software, version 11.1. Complex survey design methods accounted for the Medical Expenditure Panel Survey’s sampling methodology and applied weights to extrapolate data to national estimates of the US noninstitutionalized adult population. We separately examined trends for acupuncture, chiropractic care, massage therapy, and other complementary and alternative medicine—which included health care provided by homeopaths, naturopathic physicians, herbalists, and all other complementary and alternative medicine professionals—for all analyses.
LIMITATIONS
This study had several limitations. First, it examined use and spending trends for only the most common complementary and alternative medicine services in the adult, civilian, noninstitutionalized US population. Trends may differ for other forms of complementary and alternative medicine or in the population segments not included — that is, children, institutionalized Americans such as nursing home residents, and members of the military.
Second, because our study used a serial cross-sectional design, any potential differences in data collection by the Medical Expenditure Panel Survey during the period of time examined could have affected our findings. However, we are unaware of any changes that occurred during the period 2002–08 in regard to data on complementary and alternative medicine.
Third, the Medical Expenditure Panel Survey collects data on use and spending according to the credentials of the provider. Therefore, our analyses were restricted to credentialed complementary and alternative medicine professionals (such as chiropractors, who must hold both a doctor of chiropractic degree and a state license) and excluded any complementary and alternative medicine services offered by practitioners without professional credentials. Noncredentialed complementary and alternative medicine professionals include providers with informal training — that is, those who did not graduate from an accredited training program or do not hold active state licensure—in such fields as herbal medicine and homeopathy. [15]
Study Results
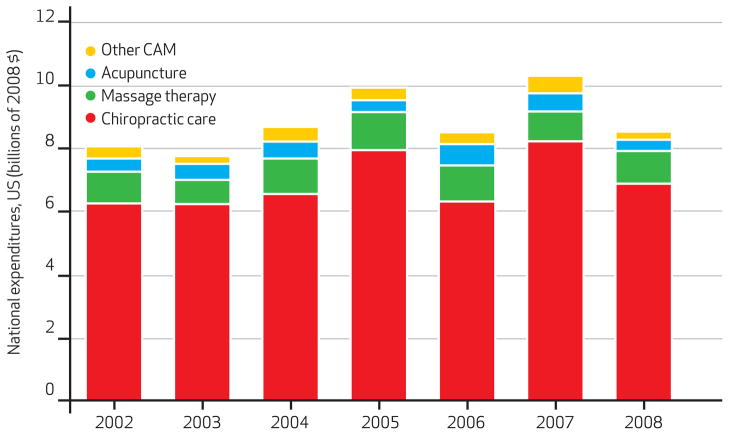
Exhibit 1 NATIONAL SPENDING ON COMPLEMENTARY AND ALTERNATIVE MEDICINE SERVICES
Estimates of total inflation-adjusted national expenditures on complementary and alternative medicine services grew by 6 percent, from $8.1 billion in 2002 to $8.6 billion in 2008 (Exhibit 1). Among specific services, inflation-adjusted expenditures on chiropractic care increased 11 percent, from $6.2 billion in 2002 to $6.9 billion in 2008. Inflation-adjusted expenditures on acupuncture, massage therapy, and other complementary and alternative medicine services were stable.
Expenditures on complementary and alternative medicine services constituted a small fraction of national health care expenditures. National expenditures on these services fluctuated between 2.7 percent and 3.1 percent of national health care expenditures on ambulatory services and were less than 1.0 percent of national health care expenditures at all measurement points between 2002 and 2008.
PATIENTS’ SPENDING ON SPECIFIC SERVICES

Exhibit 2
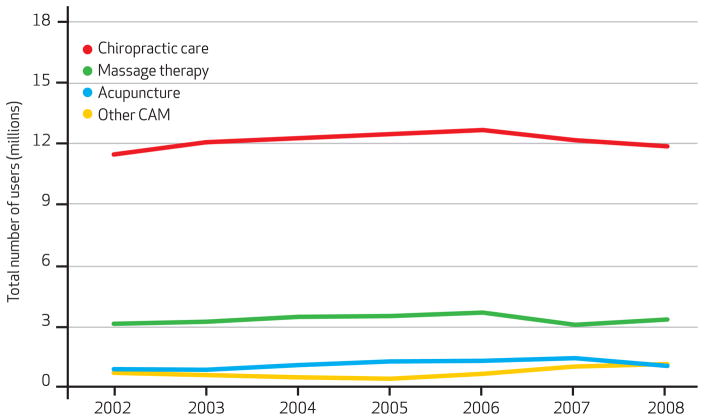
Exhibit 3
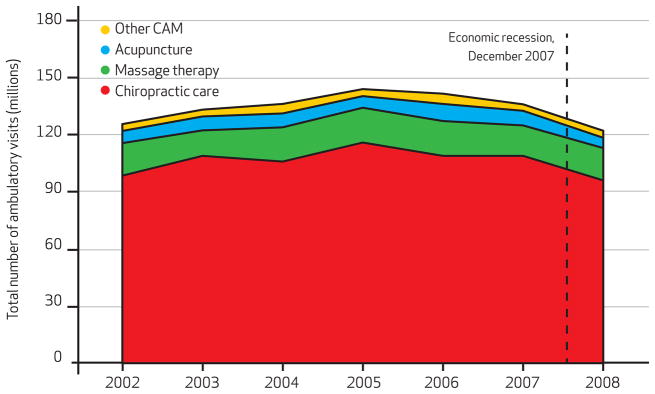
Exhibit 4 During the time period examined, the mean annual inflation-adjusted expenditure per user decreased for acupuncture (from $360 to $325) and other complementary and alternative medicine services (from $301 to $214), while it increased for chiropractic care (from $447 to $582) and massage therapy (from $259 to $305). After adjustment for age, sex, and health insurance status, all changes in expenditures were insignificant except for the increase in expenditures on chiropractic care (Exhibit 2 and Appendix Table 1). [16]
NUMBER OF ADULTS WHO USED SERVICES
The number of adults who visited any complementary and alternative medicine provider at least once during the year increased by 6 percent, from 15.2 million in 2002 to 16.1 million in 2008. Looking at specific services, the number of users was relatively stable except in one case: Users of acupuncture grew by 16 percent, from 950,000 in 2002 to 1.1 million in 2008 (Exhibit 3).
NUMBER OF AMBULATORY VISITS
Despite a slight increase in expenditures on complementary and alternative medicine services between 2002 and 2008, the total number of ambulatory visits to complementary and alternative medicine providers decreased by 3 percent, from 126 million to 122 million (Exhibit 4). The highest number of ambulatory visits, 144 million, occurred in 2005. The number of these visits declined by 15 percent between 2005 and 2008, with the largest decrease from 2007 to 2008.
Chiropractic care was the predominant type of complementary and alternative medicine service used by US adults (Exhibit 4). Chiropractic care accounted for 77–82 percent of total ambulatory visits to complementary and alternative medicine providers from 2002 to 2008, while massage therapy accounted for 10–14 percent; acupuncture, 4–6 percent; and other services, 3–4 percent.
Among specific complementary and alternative medicine services, the number of national visits for acupuncture decreased by 16 percent (from 6.4 million to 5.4 million), and chiropractic care visits decreased by 3 percent (from 98.6 million to 96.1 million) during the same time period (Exhibits 2 and 4). The number of visits for massage therapy was relatively stable, and the number of visits increased slightly for other complementary and alternative medicine services.
In linear regression models adjusted for age, sex, and health insurance status, there was a significant decrease in the mean number of visits for acupuncture per user (Exhibit 2).
Discussion
We used data from the Medical Expenditure Panel Survey to examine trends in use of and expenditures on complementary and alternative medicine services between 2002 and 2008 in the United States. We found that the US market for these services represented only a small part of national health care spending. We also found surprisingly little growth in spending on complementary and alternative medicine services and a 15 percent decrease in the total number of visits to complementary and alternative medicine providers between 2005 and 2008.
The relatively small size of this market suggests that even the complete exclusion of complementary and alternative medicine services from benefit packages would have only modest effects on controlling health care spending.
Because chiropractic care accounted for approximately three-quarters of the US complementary and alternative medicine market, it might be considered the primary service to contemplate excluding from public and private health insurance in cost reduction efforts. [7] Such an elimination could be counted on to make a small dent in national health care spending, assuming that there were no covered services that could replace the newly excluded ones. However, health care policy makers need to consider the potential “offset effects” of patients’ substituting for the excluded services with other covered services at equal or even greater cost.
For example, a substantial number of Americans seek care for back and neck conditions — the primary ailments that chiropractors treat — and tend to get it from primary care physicians, physical therapists, and medical specialists, in addition to chiropractors. [17–19] We recently compared the patient-level costs for managing back and neck conditions and found the cost of chiropractic care for such services to be lower and less susceptible to inflation than medical specialty care. [20] Therefore, excluding the few complementary and alternative medicine services currently funded through public and private health care insurances could inadvertently trigger increased spending overall.
Our estimate of an approximately $9 billion annual market for complementary and alternative medicine services is somewhat smaller than a previously reported estimate, which placed the total national out-of-pocket expenditures on these services at $11.9 billion in 2007 dollars. [21] Our lower estimate probably results from the fact that the Medical Expenditure Panel Survey identifies visits to providers based only on conditions treated. It therefore excludes visits made by adults who use complementary and alternative medicine for health maintenance and promotion. [22, 23]
Our findings suggest that the US complementary and alternative medicine market — an example of a largely cash-based health care economy — might be more self-regulating than the market for mainstream medicine. The recent decline in use of specific services may imply that the market for these services is more sensitive to consumer decision making and may have reflected an early consumer response to the recent recession. Because a higher proportion of complementary and alternative medicine services than of medical services are paid for out of pocket, pricing for the former may better reflect what patients are willing to pay than pricing for other medical services does.
This finding has implications for the future design of health care payment. The higher proportion of out-of-pocket responsibility for payment for services may explain the lack of growth that we saw in total spending on complementary and alternative medicine services. Our findings support the suggestion that health care systems in which patients make educated choices based on a budget may be beneficial in helping control health care spending. [24]
It is possible that the recent recession may explain some of the observed contraction in use of complementary and alternative medicine services in 2008. In fact, there is some evidence that consumers may view these services as luxuries, [25] which may make the services more vulnerable to economic conditions.
Recent reports have found that the recession from December 2007 to June 2009 slowed growth in spending on medical care and had an even larger impact on other health services such as dental care (particularly those services more dependent on out-of-pocket payment). [1] Nevertheless, our findings — that a slight contraction in the market for US complementary and alternative medicine services began in 2005 and that there was little fluctuation in potentially more price-sensitive services such as massage therapy — suggest that additional market factors may have influenced national spending for complementary and alternative medicine.
Complementary and alternative medicine services in the United States are delivered by an eclectic mix of provider types, which vary greatly with respect to their level of professional organization. Moreover, certain complementary and alternative medicine professions have a longer history and a larger presence than others. For these reasons, providers of some forms of complementary and alternative medicine — such as chiropractic care and, in more recent years, naturopathy and acupuncture or Oriental medicine — have been more successful than others in integrating their services into conventional health care delivery systems.
The Affordable Care Act includes provisions that potentially allow complementary and alternative medicine providers to participate in health care delivery teams. This fact has important implications for health reform efforts such as accountable care organizations. [26, 27] Considering that complementary and alternative medicine appears to be relatively inexpensive when compared to allopathic medicine, if medical care providers are willing to collaborate with local complementary and alternative medicine service providers, offering at least some complementary and alternative medicine services could help accountable care organizations achieve their objectives. [28]
As shown by the numerous studies that have demonstrated relatively high patient satisfaction with complementary and alternative medicine services, many patients prefer these services. [29–31] However, historically, there has been limited communication between complementary and alternative medicine providers and providers of other medical services. [32] If complementary and alternative medicine providers joined new payment and delivery system arrangements such as accountable care organizations, care coordination — and the reduced costs associated with it — might be improved.
The inclusion of complementary and alternative medicine providers in traditional health care delivery teams has the potential to improve integration of care, ensure that all of the patient’s needs are met, and reduce dependency on more costly medical specialists. However, this inclusion must be done carefully to ensure a collaborative approach to patient care across disciplines and avoid adding to health care costs.
Conclusion
US spending on complementary and alternative medicine services represents a small fraction of national health care spending. As health care policy makers, payers, and other stakeholders attempt to reduce waste in health care systems, they should recognize that excluding currently covered complementary and alternative medicine services would, at best, produce only meager cost savings. Operating under more free-market conditions, the pricing of complementary and alternative medicine services appears to be more self-regulating than that of the conventional health care sector. This difference suggests that payment systems that encourage consumers to make educated decisions under the constraint of a budget may help constrain health care spending growth.
Examination of the US complementary and alternative medicine market is useful in understanding consumer response to a more cash-based health care economy, which can inform future benefit design. If certain types of complementary and alternative medicine services are proven to be efficient in managing health conditions, those who provide the services may find opportunities to participate in new delivery system models such as accountable care organizations, resulting in a more collaborative approach to health care delivery.
Supplementary Material
Appendix Table 1 (88K, docx)Acknowledgments
Matthew Davis was supported by the National Center for Complementary and Alternative Medicine (Award No. 1K01AT006162), and Brook Martin received consulting support from the center (Grant No. 1R01AT005061). Davis had full access to all of the data in this study and takes responsibility for the integrity of the data and the accuracy of the data analysis. The views expressed herein do not necessarily represent the official views of the National Center for Complementary and Alternative Medicine or the National Institutes of Health.
Biographies
Matthew A. Davis is an instructor at the Dartmouth Institute for Health Policy and Clinical Practice.
In this month’s Health Affairs, Matthew Davis and coauthors report on their study of trends in the use of and spending on complementary and alternative medicine from 2002 to 2008. As seen in the Medical Expenditure Panel Survey, demand for these services plateaued over that period. The authors suggest that the higher proportion of out-of-pocket payment for these services, relative to other medical services, may explain the lack of growth. And should forms of complementary and alternative medicine be proven to be more efficient than allopathic and specialty medicine, the inclusion of complementary and alternative medicine providers in new health delivery systems such as accountable care organizations may help slow growth in health care spending, the authors write.
Davis is an instructor at the Dartmouth Institute for Health Policy and Clinical Practice, an instructor in the Center for Health Policy Research at the institute, and a doctoral student in quantitative biomedical sciences at the Geisel School of Medicine at Dartmouth. He received a career development award from the National Institutes of Health’s National Center for Complementary and Alternative Medicine to study the market for complementary and alternative medicine services.
Davis received a master’s degree in public health from the Dartmouth Institute and a clinical degree from New York Chiropractic College.

Brook I. Martin is an instructor in orthopedic surgery at the Geisel School of Medicine at Dartmouth.
Brook Martin is an instructor in orthopedic surgery at the Geisel School of Medicine at Dartmouth and a health services researcher affiliated with the Department of Orthopaedics at the Dartmouth-Hitchcock Medical Center.
His research focuses on describing the economic burden of back pain, as well as understanding the safety and effectiveness of treatments for back pain, especially spine surgery. He earned a doctorate in health services from the University of Washington.
Ian D. Coulter is a senior health policy analyst at the RAND Corporation.
Ian Coulter is a senior health policy analyst at the RAND Corporation, where he holds the Samueli Institute Chair in Policy for Integrative Medicine. He is also a professor at the University of California, Los Angeles, School of Dentistry and a research professor at the Southern California University of Health Sciences.
Coulter received a master’s degree in sociology from the University of Canterbury, New Zealand, and a doctorate in sociology from the London School of Economics and Political Science, University of London. He also earned a certificate in health policy analysis from the RAND/University of California, Los Angeles, Center for Health Policy Research and a diploma in educational management from the Institute of Educational Management at Harvard University.
William B. Weeks is a professor of psychiatry and of community and family medicine at the Geisel School of Medicine at Dartmouth.
William Weeks is a professor of psychiatry and of community and family medicine at the Geisel School of Medicine at Dartmouth. His research interests focus on business and economic aspects of health services delivery, particularly as they relate to improving the value added by health care delivery systems.
Weeks has also studied dual use of the Department of Veterans Affairs and Medicare for health care among veterans living in rural areas. He was named researcher of the year by the National Rural Health Association in 2009. Weeks holds an MBA from Columbia University and a medical degree from the University of Texas Medical Branch at Galveston.
References:
Martin A, Lassman D, Whittle L, Catlin
A National Health Expenditure Accounts Team.
Recession contributes to slowest annual rate of increase
in health spending in five decades.
Health Aff (Millwood) 2011;30(1):11–22.Martin AB, Lassman D, Washington B, Catlin
A National Health Expenditure Accounts Team.
Growth in US health spending remained slow in 2010; health share
of gross domestic product was unchanged from 2009.
Health Aff (Millwood) 2012;31(1):208–19Eisenberg DM, Davis RB, Ettner SL, Appel S, Wilkey S, Van Rompay M, Kessler RC.
Trends in Alternative Medicine Use in the United States, 1990 to 1997:
Results of a Follow-up National Survey
JAMA 1998 (Nov 11); 280 (18): 1569–1575Eisenberg DM, Kessler RC, Foster C, Morlock FE, Calkins DR, Delbanco TL.
Unconventional Medicine in the United States:
Prevalence, Costs, and Patterns of Use
New England Journal of Medicine 1993 (Jan 28); 328 (4): 246–252Kessler RC, Davis RB, Foster DF, et al.
Long-Term Trends in the Use of Complementary and
Alternative Medical Therapies in the United States
Annals of Internal Medicine 2001 (Aug 21); 135 (4): 262–268Steyer TE, Freed GL, Lantz PM.
Medicaid reimbursement for alternative therapies.
Altern Ther Health Med. 2002;8(6):84–8Meeker, W., & Haldeman, S.
Chiropractic: A Profession at the Crossroads
of Mainstream and Alternative Medicine
Annals of Internal Medicine 2002 (Feb 5); 136 (3): 216–227Barnes PM , Bloom B , Nahin RL:
Complementary and Alternative Medicine Use Among Adults and Children:
United States, 2007
National Center for Health Statistics Report. 2008 (Dec 10); (12): 1–23
US Department of Health and Human Services,
Centers for Disease Control and Prevention, Hyattsville, MD, 2008.Barnes PM , Powell-Griner E , McFann K , Nahin RL:
Complementary and Alternative Medicine Use Among Adults:
United States, 2002
Advance Data 2004 (May 27); 343: 1–19Su D, Li L.
Trends in the use of complementary and alternative medicine in the United States: 2002–2007.
J Health Care Poor Underserved. 2011;22(1):296–310O’Sullivan A, Sheffrin SM.
Economics: principles in action.
Upper Saddle River (NJ): Pearson Prentice Hall; 2003.Agency for Healthcare Research and Quality.
Medical Expenditure Panel Survey: Household Component full-year files 2002 to 2008 [Internet]
Rockville (MD): AHRQ; [cited 2012 Nov 9]. Available for download from:
http://www.meps.ahrq.gov/mepsweb/data_stats/download_data_files.jspCohen JW, Cohen SB, Banthin JS.
The Medical Expenditure Panel Survey: a national information resource
to support healthcare cost research and inform policy and practice.
Med Care. 2009;47(7 Suppl 1):S44–50Bureau of Labor Statistics.
Consumer Price Index [home page on the Internet]
Washington (DC): Department of Labor; [cited 2012 Nov 9]. Available from:
http://www.bls.gov/cpi.Eisenberg DM, Cohen MH, Hrbek A, Grayzel J, Van Rompay MI, Cooper RA.
Credentialing complementary and alternative medical providers.
Ann Intern Med. 2002;137(12):965–73To access the Appendix, click on the Appendix link
in the box to the right of the article online.Cherkin DC, Deyo RA, Sherman KJ, Hart LG, Street JH, Hrbek A, et al.
Characteristics of Visits to Licensed Acupuncturists, Chiropractors,
Massage Therapists, and Naturopathic Physicians
J Am Board Fam Pract 2002; 15 (6):463-480Martin BI. Deyo R. Mirza SK, et al.
Expenditures and Health Status Among Adults With Back and Neck Problems
JAMA 2008 (Feb 13); 299 (6): 656–664Martin BI, Turner JA, Mirza SK, Lee MJ, Comstock BA, Deyo RA.
Trends in Health Care Expenditures, Utilization, and Health Status
Among US Adults With Spine Problems, 1997-2006
Spine (Phila Pa 1976). 2009 (Sep 1); 34 (19): 2077–2084Davis MA, Onega T, Weeks WB, Lurie JD.
Where the United States Spends its Spine Dollars:
Expenditures on Different Ambulatory Services
for the Management of Back and Neck Conditions
Spine (Phila Pa 1976). 2012 (Sep 1); 37 (19): 1693–1701Nahin RL, Barnes PM, Stussman BJ, Bloom B.
Costs of complementary and alternative medicine (CAM) and frequency
of visits to CAM practitioners: United States, 2007.
Natl Health Stat Report. 2009;(18):1–14Davis MA, West AN, Weeks WB, Sirovich BE.
Health behaviors and utilization among users of complementary and
alternative medicine for treatment versus health promotion.
Health Serv Res. 2011;46(5):1402–16Davis MA, Weeks WB, Coulter ID.
A proposed conceptual model for studying the use
of complementary and alternative medicine.
Altern Ther Health Med. 2011;17(5):32–6Herzlinger RE.
America’s $2 trillion medical problem and the consumer-driven cure. New York (NY):
McGraw-Hill; 2007.
Consumer-driven benefits: lessons from other countries and industries.
Chapter 8 in: Who killed health care?Bishop FL, Yardley L, Lewith GT.
Treat or treatment: a qualitative study analyzing patients’
use of complementary and alternative medicine.
Am J Public Health. 2008;98(9):1700–5Fisher ES, Staiger DO, Bynum JPW, Gottlieb DJ.
Creating accountable care organizations: the extended hospital medical staff.
Health Aff (Millwood) 2007;26(1):w44–57. doi: 10.1377/hlthaff.26.1.w44McClellan M, McKethan AN, Lewis JL, Roski J, Fisher ES.
A national strategy to put accountable care into practice.
Health Aff (Millwood) 2010;29(5):982–90Davis MA, Whedon JM, Weeks WB.
Complementary and alternative medicine practitioners and
accountable care organizations: the train is leaving the station.
J Altern Complement Med. 2011;17(8):669–74Hertzman-Miller RP, Morgenstern H, Hurwitz EL, et al.
Comparing the Satisfaction of Low Back Pain Patients Randomized to Receive
Medical or Chiropractic Care: Results From the UCLA Low-back Pain Study
Am J Public Health 2002 (Oct); 92 (10): 1628–1633Marian F, Joost K, Saini KD, von Ammon K, Thurneysen A, Busato A.
Patient satisfaction and side effects in primary care:
an observational study comparing homeopathy and
conventional medicine.
BMC Complement Altern Med. 2008;8:52Oldendick R, Coker AL, Wieland D, Raymond JI, Probst JC, Schell BJ, et al.
Population-based survey of complementary and alternative medicine usage,
patient satisfaction, and physician involvement.
South Carolina Complementary Medicine Program
Baseline Research Team.
South Med J. 2000;93(4):375–81Greene BR, Smith M, Allareddy V, Haas M.
Referral patterns and attitudes of primary care physicians towards chiropractors.
BMC Complement Altern Med. 2006;6:5.
Return to ALT-MED/CAM ABSTRACTS
1-22-2023
| Home Page | Visit Our Sponsors | Become a Sponsor |
Please read our DISCLAIMER |