

US Health Care Spending by Payer
and Health Condition, 1996-2016This section is compiled by Frank M. Painter, D.C.
Send all comments or additions to: Frankp@chiro.org


FROM: JAMA 2020 (Mar 3); 323 (9): 863–884 ~ FULL TEXT
OPEN ACCESS Joseph L. Dieleman, PhD • Jackie Cao, MS • Abby Chapin, BA • Carina Chen, MA
Zhiyin Li, MS • Angela Liu, MPH • Cody Horst, MPH • Alexander Kaldjian, MS, et al
Institute for Health Metrics and Evaluation,
Seattle, Washington.
Key Points
Question: How does spending on different health conditions vary by payer (public insurance, private insurance, or out-of-pocket payments) and how has this spending changed over time?
Findings: From 1996 to 2016, total health care spending increased from an estimated $1.4 trillion to an estimated $3.1 trillion. In 2016, private insurance accounted for 48.0% (95% CI, 48.0%-48.0%) of health care spending, public insurance for 42.6% (95% CI, 42.5%-42.6%) of health care spending, and out-of-pocket payments for 9.4% (95% CI, 9.4%-9.4%) of health care spending. After adjusting for population size and aging, the annualized spending growth rate was 2.6% (95% CI, 2.6%-2.6%) for private insurance, 2.9% (95% CI, 2.9%-2.9%) for public insurance, and 1.1% (95% CI, 1.0%-1.1%) for out-of-pocket payments.
Meaning: Understanding how much each payer spent on each health condition and how these amounts have changed over time can inform health care policy.
Importance: US health care spending has continued to increase and now accounts for 18% of the US economy, although little is known about how spending on each health condition varies by payer, and how these amounts have changed over time.
Objective: To estimate US spending on health care according to 3 types of payers (public insurance [including Medicare, Medicaid, and other government programs], private insurance, or out-of-pocket payments) and by health condition, age group, sex, and type of care for 1996 through 2016.
Design and setting: Government budgets, insurance claims, facility records, household surveys, and official US records from 1996 through 2016 were collected to estimate spending for 154 health conditions. Spending growth rates (standardized by population size and age group) were calculated for each type of payer and health condition.
Exposures: Ambulatory care, inpatient care, nursing care facility stay, emergency department care, dental care, and purchase of prescribed pharmaceuticals in a retail setting.
Main outcomes and measures: National spending estimates stratified by health condition, age group, sex, type of care, and type of payer and modeled for each year from 1996 through 2016.
Results: Total health care spending increased from an estimated $1.4 trillion in 1996 (13.3% of gross domestic product [GDP]; $5,59 per person) to an estimated $3.1 trillion in 2016 (17.9% of GDP; $9,55 per person); 85.2% of that spending was included in this study. In 2016, an estimated 48.0% (95% CI, 48.0%–48.0%) of health care spending was paid by private insurance, 42.6% (95% CI, 42.5%–42.6%) by public insurance, and 9.4% (95% CI, 9.4%–9.4%) by out-of-pocket payments.In 2016, among the 154 conditions, low back and neck pain had the highest amount of health care spending with an estimated $134.5 billion (95% CI, $122.4–$146.9 billion) in spending, of which 57.2% (95% CI, 52.2%–61.2%) was paid by private insurance, 33.7% (95% CI, 30.0%–38.4%) by public insurance, and 9.2% (95% CI, 8.3%–10.4%) by out-of-pocket payments.
Other musculoskeletal disorders accounted for the second highest amount of health care spending (estimated at $129.8 billion [95% CI, $116.3–$149.7 billion]) and most had private insurance (56.4% [95% CI, 52.6%–59.3%]).
Diabetes accounted for the third highest amount of the health care spending (estimated at $111.2 billion [95% CI, $105.7–$115.9 billion]) and most had public insurance (49.8% [95% CI, 44.4%–56.0%]).
Other conditions estimated to have substantial health care spending in 2016 were ischemic heart disease ($89.3 billion [95% CI, $81.1–$95.5 billion]), falls ($87.4 billion [95% CI, $75.0–$100.1 billion]), urinary diseases ($86.0 billion [95% CI, $76.3–$95.9 billion]), skin and subcutaneous diseases ($85.0 billion [95% CI, $80.5–$90.2 billion]), osteoarthritis ($80.0 billion [95% CI, $72.2–$86.1 billion]), dementias ($79.2 billion [95% CI, $67.6–$90.8 billion]), and hypertension ($79.0 billion [95% CI, $72.6–$86.8 billion]).
The conditions with the highest spending varied by type of payer, age, sex, type of care, and year. After adjusting for changes in inflation, population size, and age groups, public insurance spending was estimated to have increased at an annualized rate of 2.9% (95% CI, 2.9%–2.9%); private insurance, 2.6% (95% CI, 2.6%–2.6%); and out-of-pocket payments, 1.1% (95% CI, 1.0%–1.1%).Conclusions and relevance: Estimates of US spending on health care showed substantial increases from 1996 through 2016, with the highest increases in population-adjusted spending by public insurance. Although spending on low back and neck pain, other musculoskeletal disorders, and diabetes accounted for the highest amounts of spending, the payers and the rates of change in annual spending growth rates varied considerably.
There are more articles like this @ our new:
NON-PHARMACOLOGIC THERAPY Page
From the FULL TEXT Article:
Introduction
The United States spends more on health care per person than ever before, and considerably more than nearly all other countries. [1] The system used to finance health care in the United States has evolved over the last century. Changes to the federal tax code led to the emergence of employer-sponsored private insurance in the 1940s and Medicare and Medicaid were created in the 1960s. [2] Since then, numerous public policies have been debated and enacted, and innovative payment models have been formed.
The result of these innovations and reforms is a complex and diffuse US health care system. [3] In 2017, Medicare and Medicaid, which make up the majority of governmental spending on health care, accounted for 21.2% and 17.5% of total health care spending, respectively. [4] Private health insurance, which includes employer-subsidized plans and policies purchased in state or federal marketplaces, accounted for 35.6% of total health care spending. [4] Out-of-pocket payments, which include all household spending on health care including deductibles or co-payments, accounted for 11.0% of total health care spending. [4] The remaining health care financial system includes spending by the Department of Veterans Affairs, the Department of Defense, the Child Health Insurance Program, worker’s compensation, and the Indian Health Service.
Although the Centers for Medicare & Medicaid Services provides annual estimates of total health care spending for each of these programs, little is known about how spending by each type of payer is divided across health conditions. This study aims to fill this gap by estimating annual health care spending for 3 payer categories (public insurance, private insurance, and out-of-pocket payments) for 154 health conditions and by age group and sex from 1996 through 2016.
Methods
Conceptual Framework and Data
The process used to generate spending estimates by payer were based on methods previously developed by the Institute for Health Metrics and Evaluations for the Disease Expenditure Project (DEX) [5, 6] (further details appear in the Supplement). The previously published DEX estimates included health care spending by health condition, age group, sex, and type of care from 1996 through 2013, and measured the associations among health care spending increases and key demographic, epidemiological, and health service factors. [5, 7, 8] This prior research did not disaggregate modeled spending by payer.
The DEX project, including the research conducted for this analysis, received review and approval from the University of Washington institutional review board, but because the data were from a deidentified database, the requirement for informed consent was waived.
The current project used microdata to estimate the amount of health care spending on 154 health conditions, 38 groups for age and sex, 6 types of care (ambulatory, inpatient, nursing care facility, emergency department [ED], dental, and prescribed pharmaceuticals purchased in a retail setting), and 1 category to measure the government administration and net cost of insurance programs. Microdata track information for a single ambulatory, ED, or dental visit; inpatient or nursing care facility stay; or pharmaceutical prescription. The microdata were extracted from household surveys, public and private insurance claims databases, and health facility administrative records and are listed in §2 in the Supplement. [3,9,10–13]
The 38 groups for age and sex used in this study included 19 age groups for each sex, including younger than 1 year, 1 to 4 years, 5 to 9 years, 10 to 14 years, etc. The 154 health conditions were based on categories used in the Global Burden of Disease 2017 study. These 154 health conditions were aggregated into 14 health categories. The health conditions, aggregated health categories, and types of care are listed and further explained in the Supplement (eTable 2.1, eTable 10.1, eTable 10.2, and §12) as well as in preceding publications. [5, 7, 8]
Spending estimates were generated from 1996 through 2016. This period was chosen due to data availability. The Medical Expenditure Panel Survey (MEPS) began in 1996 and few of the data sources extended beyond 2016 at the time this research was conducted.
Estimating Spending
Each outpatient visit, inpatient stay, or prescription recorded in the microdata included at least 1 diagnosis coded using the International Classification of Diseases (ICD), Ninth Revision, or the International Statistical Classification of Diseases and Related Health Problems, Tenth Revision. When a primary diagnosis was not identified in the data, the first diagnosis listed was used. These diagnoses were aggregated, using survey sampling weights, into 154 mutually exclusive health conditions. When the ICD code associated with the primary diagnosis did not provide enough information to match to a single health condition used in this study, the diagnosis listed next was used. If a record had no diagnoses that mapped directly to 1 of the 154 health conditions, the spending was redistributed using methods derived for the Global Burden of Disease study. [14]
Spending estimates were adjusted for comorbidities, which are generally associated with increased spending. To redistribute a portion of the spending initially attributed to a primary diagnosis to a comorbid condition, the excess spending associated with each comorbidity was measured using penalized linear regression. Using microdata, spending associated with a visit or stay for a single health condition was regressed on binary indicators identifying the diagnosis of any other health condition. This was completed separately for 4 age groups (<1–19 years, 20–44 years, 45–64 years, and ?65 years) and for each health condition that had at least 2000 observations for that age group (142 of 154 health conditions). To avoid spurious associations caused by small sample sizes and outlying data points, penalized regressions were used, which constrain coefficient estimates for regressions that have many parameters but few observations. The degree to which the estimated parameters were constrained was determined for each health condition, age, and type of care using generalized cross validation. Additional details on this adjustment appear in the Supplement (§5.1) and in prior publications. [15]
Addressing Data Nonrepresentativeness
In some cases, the microdata required adjustments to make the data representative and appropriate for this study. Seven specific adjustments are briefly discussed in this section and additional details appear in the Supplement (§5.2-§5.7).
The National Inpatient Sample and the Nationwide Emergency Department Sample report facility charges rather than total payments for each stay. [10] To adjust facility charges to reflect total payments, scalars for each health condition, age, and year combination were estimated using nonlinear regressions and data from the MEPS, which reports both charges and payments. [16]
To refine our spending estimates for the inpatient setting and the ED, we adjusted inpatient charges that would have been inclusive of ED charges among patients admitted to the hospital through the ED. Using the Nationwide Emergency Department Sample, we calculated the fraction of spending attributable to the ED for an inpatient stay and removed this allocation from the original inpatient estimate that was calculated using data from the National Inpatient Sample.
The National Ambulatory Medical Care Survey reported visits at which a physician was consulted but excluded all other health care visits. To adjust for these additional visits, scalars for each health condition, age, and year combination were estimated using nonlinear penalized regression and data from the MEPS.
Nursing care facility spending was estimated separately for short-term and long-term care and then aggregated. According to the National Nursing Home Survey, 95.5% of nursing care facility stays lasting less than 100 days were paid, in part, by Medicare. Consequently, short-term care was estimated using Medicare claims data. Spending on long-term care at nursing care facilities was estimated using linear regression and data from the National Nursing Home Survey and the Centers for Medicare & Medicaid Services’ Medicaid Analytic eXtract.
Mental health spending estimates were scaled proportionally to meet the total spending for mental health and substance abuse as ambulatory care and reported by the Substance Abuse and Mental Health Services Administration annual reports because some microdata exclude specialty mental health and substance abuse clinics from their surveys. [17]
To measure spending on specialty drugs, which generally have high costs but are used infrequently and are therefore not well represented in survey data, sales volume, list price, and net price (after discounts and rebates) were extracted from the SSR Health pharmaceutical pricing database for 136 specialty drugs. Spending per drug was estimated by taking the product of the sales volume and the list price or net price (whichever was smaller). Each drug was mapped to a health condition included in this study and was combined with pharmaceutical spending estimates from the MEPS, which captures retail pharmaceutical spending on nonspecialty drugs.
To control for small sample sizes and to leverage the strength of multiple data sources, a hierarchical model was used to smooth spending across space and time. This model was estimated separately for each health condition, sex, and type of care and used a penalized spline to allow the fit to be highly nonlinear across age and time simultaneously.
Generating Payer-Specific Estimates
The type of care, the age and sex of the patient, the diagnosis, and the health care spending by each payer was identified and extracted from the MEPS, which identifies 12 categories of payers. These 12 categories were aggregated into 3 payer categories: public insurance (Medicaid, Medicare, other federal, other public, other state or local, and Veteran’s Affairs), private insurance (other private, TRICARE, and worker’s compensation), and out-of-pocket payments (self or family). Other payer sources accounted for less than 1% of the spending across all years and were excluded from this part of the analysis because it was unclear where to apply this spending.
For each health condition and type of care, nonlinear regression was used to estimate the fraction of health care spending from each type of payer, age group, and year. Spending ratios for men and women were estimated together. All data underwent centered log transformation. [18, 19] This type of transformation ensures that the modeled fractions sum to 1 for each age, sex, health condition, type of care, and year. Nonlinear regression was completed using penalized regression and the penalty was determined using generalized cross validation. More information about this modeling appears in the Supplement (§7).
The sum of the products from modeled payer fractions and the spending amount for each age, health condition, type of care, and year were scaled proportionally to estimate the type of payer and type of care spending amounts reported by the National Health Expenditure Accounts. All spending estimates were adjusted for inflation using economy-wide rates provided by the Bureau of Economic Analysis and were converted to 2016 US dollars. [20]
Estimating Spending on Government Administration and the Net Cost of Insurance Programs
Official US records include the cost of administering insurance programs as health care spending. These costs are reported in the National Health Expenditure Accounts and include all costs associated with the government administration and the net cost of insurance programs. This category includes administrative costs such as salaries and expenses related to the management of insurance. The costs of running public and private insurance were split across health conditions, age groups, and sex for each year based on the proportion of spending estimated for all other types of care and for public and private insurance separately.
Quantifying Uncertainty
The confidence intervals were calculated by using bootstrapping methods 1000 times. Most steps for the estimation were completed for each bootstrap sample, and 1000 spending estimates were created for each health condition, age group, sex, type of care, payer, and year. (The estimation of the spending on specialty drugs and Medicaid spending on long-term stays in nursing care facilities were not bootstrapped because the underlying data we had access to were tabulated.) The spending estimates reported in this article are the mean of these 1000 estimates, whereas the 95% CIs were constructed using the 2.5th and 97.5th percentiles, meaning that this is a percentile interval bootstrap. Bootstrapping methods assume that the empirical distribution of the errors in the sample data approximates the population’s distribution. Although this method has strengths, this assumption may not always be true, especially for rare health conditions.
Moreover, bootstrapping methods only capture a subset of uncertainty and do not reflect the uncertainty associated with some modeling decisions and processes. In addition, the point estimate (ie, the reported value) of a percentile interval bootstrap is not based on the observed data but is instead based on the mean of the bootstrap draws and can be skewed in some cases. The percentile interval bootstrapping method was chosen rather than other bootstrapping methods because it seemed most appropriate for the underlying data (without a single draw reflecting the observed data without uncertainty). Due to these limitations, the 95% CIs should be used as a relative indication of when the measurements are the most precise rather than as exact 95% CIs.
Quantifying Change Over Time
To measure changes in spending across time, annualized rates of change and population-standardized rates of change were calculated from 1996 through 2016. The annualized rate of change is the year-over-year rate of change necessary to reflect the total change in spending observed between 1996 and 2016. The population-standardized rate of change is the annualized rate of change calculated after adjusting for the changing population size, age, and sex structure.
To calculate the population-standardized rate of change, the population size, age, and sex structure from 2016 was multiplied by the 1996 per-person spending rates for each age group and sex category. This process estimates what spending would have been in 1996 had the 2016 population been present. All data adjustments and statistical analyses were completed using Stata version 13.1 (StataCorp), R version 3.5.1 (R Foundation for Statistical Computing), and Python version 3.6 (Python Software Foundation).
Results
In total, 198 source-specific years of microdata were used for this study. Together, these data included 5.9 billion unique insurance claims; information regarding an additional 150.4 million ambulatory, dental, or ED visits; 1.5 billion inpatient and nursing care facility bed-days; and 5.9 million prescribed pharmaceuticals. The data reflected 85.2% of health care spending between 1996 and 2016. Excluded from this study were home health care (2.6% of total health care spending between 1996 and 2016); durable medical equipment and nondurable medical products, which include over-the-counter medicines (3.7%); government public health activities (2.9%); and research and infrastructure investment (5.6%). [3]
Health Care Spending by Payer, Age, and Aggregated Health Condition in 2016
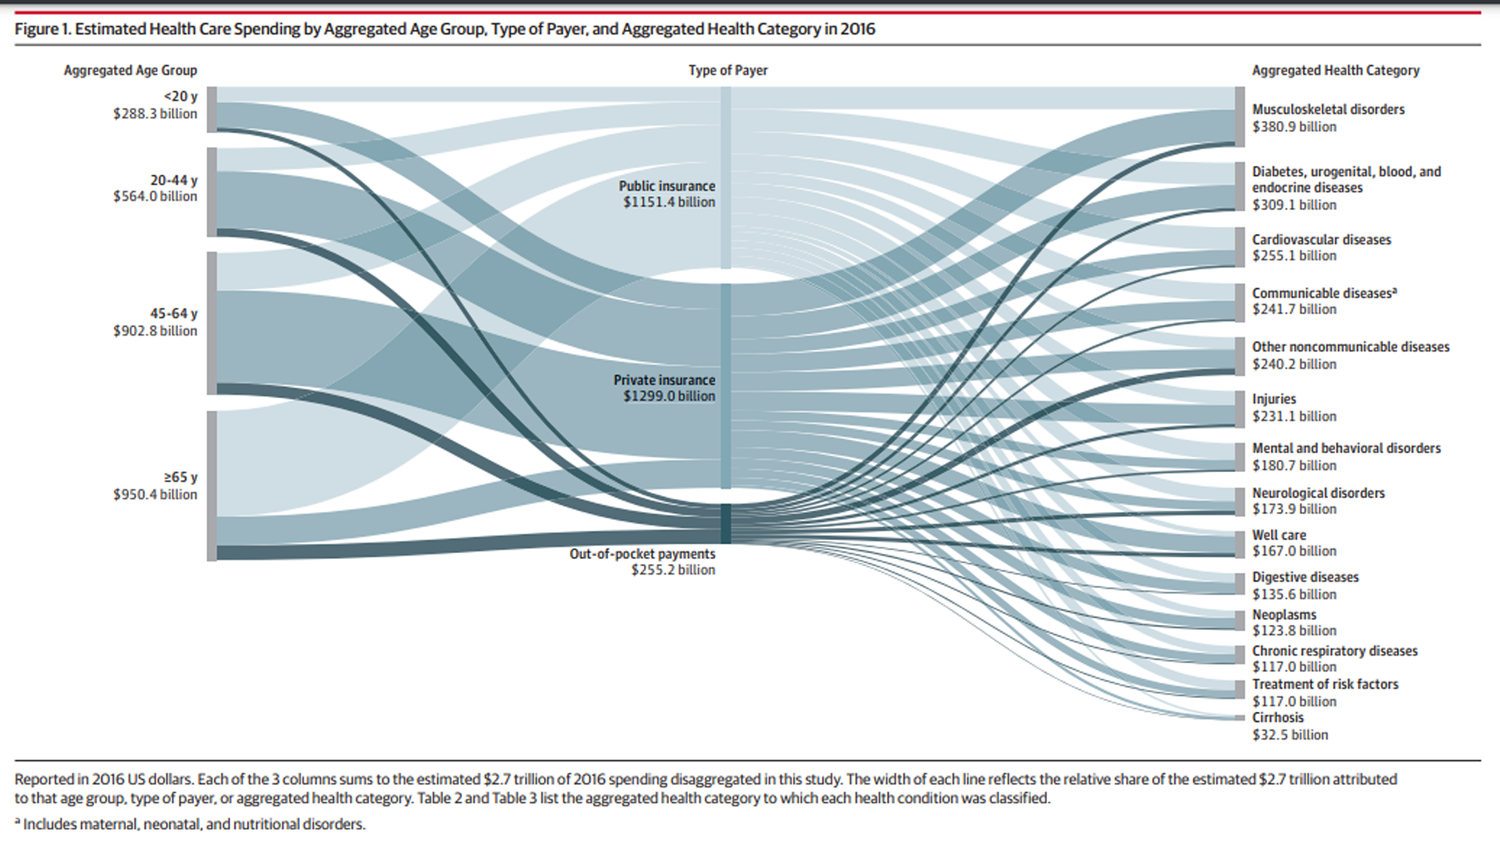
Figure 1 Total health care spending increased from an estimated $1.4 trillion in 1996 (13.3% of gross domestic product [GDP]; $5259 per person) to an estimated $3.1 trillion in 2016 (17.9% of GDP; $9655 per person). During this period, 86.8% of this spending was included in this study. In 2016, an estimated $1.3 trillion (95% CI, $1.3 trillion–$1.3 trillion) or 48.0% (95% CI, 48.0%–48.0%) of total spending was accounted for by private insurance, an estimated $1.2 trillion (95% CI, $1.2 trillion–$1.2 trillion) or 42.6% (95% CI, 42.5%–42.6%) by public insurance, and an estimated $255.2 billion (95% CI, $255.0 billion–$255.2 billion) or 9.4% (95% CI, 9.4%–9.4%) by out-of-pocket payments (Figure 1). The estimates reported in this article can be interactively explored at http://vizhub.healthdata.org/dex/.
Even though the majority (58.6% [95% CI, 57.2%–59.9%]) of public insurance spending was for patients aged 65 years or older, 41.4% (95% CI, 40.1%–42.8%) was for patients aged 64 years or younger. Conversely, 86.0% (95% CI, 85.2%–86.7%) of private insurance spending was for patients aged 64 years or younger. Out-of-pocket payments accounted for a small percentage of spending across age groups, ranging from 1.1% (95% CI, 0.9%–1.2%) for those aged less than 1 year to 12.8% (95% CI, 11.7%–14.0%) for those aged 85 years or older.

Table 1 In 2016, the aggregated health category with the highest modeled spending was musculoskeletal disorders with an estimated $380.9 billion (95% CI, $360.0 billion–$405.4 billion) (Table 1). This spending was concentrated in adults aged 20 to 64 years (61.3% [95% CI, 59.6%–62.8%]), was funded primarily by private insurance (54.0% [95% CI, 51.4%–56.4%]), and was primarily for ambulatory care (49.0% [95% CI, 46.8%–51.5%]). Spending on diabetes, urogenital, blood, and endocrine disorders was the aggregated health category with the second highest spending in 2016, estimated to be $309.1 billion (95% CI, $292.4 billion–$328.4 billion), and the majority of spending was concentrated in adults aged 20 to 64 years (57.5% [95% CI, 56.1%–59.0%]) and for ambulatory care (35.5% [95% CI, 33.0%–37.8%]). Cardiovascular diseases was the aggregated health category with the third highest spending in 2016, estimated to be $255.1 billion (95% CI, $233.4 billion–$282.6 billion). Across all aggregated health categories, the government administration and net cost of insurance programs was 9.8% (range, 8.9%–10.5%) in 2016.
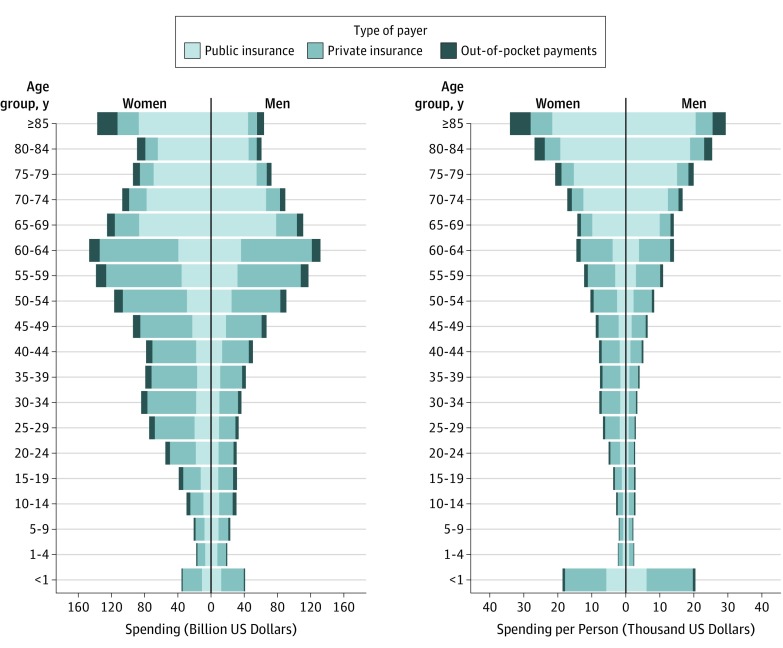
Figure 2 Figure 2 highlights how modeled payer-specific spending varies by age and sex. Across age there is a transition to public insurance from private insurance at older ages and the shift occurs most substantially at the age of 65 years, which is the eligibility age of Medicare for many individuals in the United States. In 2016, public insurance spending was highest for those aged 65 years or older. For those younger than aged 65 years, public insurance spending varied; however, it tended to increase with age for both the total amount of spending and per-person spending. There was also a notable increase in public insurance spending among women during the peak ages of fertility.
Private insurance spending generally increased with age from birth until aged 64 years. The highest amount of private insurance spending in 2016 was for women and men aged 60 to 64 years. For these ages and among both sexes, the highest spending was for musculoskeletal disorders. In per-person terms, the highest private insurance spending was on newborns (aged <1 year), which occurred primarily in inpatient settings during the first few days of life. Out-of-pocket payments varied much less across age and sex than across public and private insurance, with the highest spending found among individuals older than aged 85 years.
Table 2 Health Care Spending by Payer and Health Condition in 2016 In 2016, among the 154 conditions, low back and neck pain had the highest health care spending with an estimated $134.5 billion (95% CI, $122.4–$146.9 billion) in spending, of which 57.2% (95% CI, 52.2%–61.2%) was paid by private insurance, 33.7% (95% CI, 30.0%–38.4%) paid by public insurance, and 9.2% (95% CI, 8.3%–10.4%) paid by out-of-pocket payments (Table 2). In 2016, the health condition estimated to have the next highest health care spending was other musculoskeletal disorders (including joint and limb pain, myalgia, and osteoporosis) at $129.8 billion (95% CI, $116.3 billion–$149.7 billion); diabetes at $111.2 billion (95% CI, $105.7 billion–$115.9 billion); ischemic heart disease at $89.3 billion (95% CI, $81.1 billion–$95.5 billion); falls at $87.4 billion (95% CI, $75.0 billion–$100.1 billion); urinary diseases at $86.0 billion (95% CI, $76.3 billion–$95.9 billion); skin and subcutaneous diseases at $85.0 billion (95% CI, $80.5 billion–$90.2 billion); osteoarthritis at $80.0 billion (95% CI, $72.2 billion–$86.1 billion); dementias at $79.2 billion (95% CI, $67.6 billion–$90.8 billion); and hypertension at $79.0 billion (95% CI, $72.6 billion–$86.8 billion).
Spending varied based on type of care, age, and payer. The majority of the spending on low back and neck pain, other musculoskeletal disorders, and diabetes was among adults between the ages of 20 and 64 years, whereas the majority of spending on dementias, ischemic heart disease, and falls was among those aged 65 years or older. Spending on skin and subcutaneous disorders, low back and neck pain, and other musculoskeletal disorders received the majority of funding from private insurance, whereas hypertension, dementias, and ischemic heart disease received the majority of funding from public insurance.
Among the 10 health conditions with the highest spending, the health condition that had the highest fraction of out-of-pocket payments was dementias. Among those same 10 health conditions, other musculoskeletal disorders, hypertension, low back and neck pain, skin and subcutaneous diseases, and urinary diseases had the highest fraction of spending during ambulatory care; osteoarthritis and ischemic heart disease had the highest fraction of spending during inpatient care; diabetes had the highest fraction of spending on prescribed pharmaceuticals; and dementias had the highest fraction of spending during nursing care facility stays. Spending on falls was distributed relatively evenly across all types of care, with substantial spending during inpatient care, ambulatory care, and nursing care facility stays.
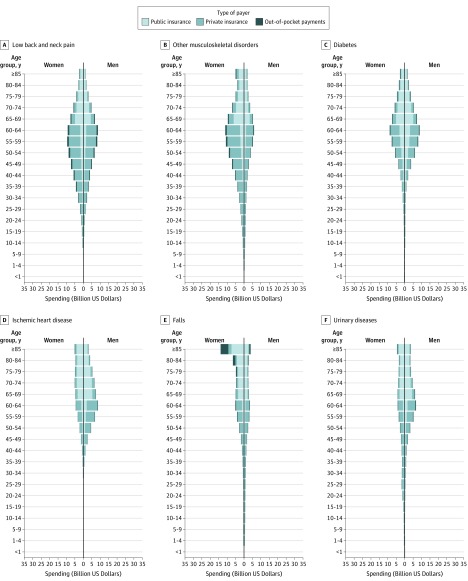
Figure 3 Figure 3A shows that private insurance funded most of the modeled health care spending for low back and neck pain, whereas public insurance played a substantive role for the population aged 65 years or older, and out-of-pocket payments were relatively constant across age groups (when measured as a fraction of the total amount of low back and neck pain spending). Figure 3B shows that other musculoskeletal disorders had a similar funding pattern as low back and neck pain, with more financing from private insurance for those younger than aged 65 years. Unlike low back and neck pain, spending on other musculoskeletal disorders was higher for women than men, especially between the ages of 40 and 70 years. This is partially because of the inclusion of osteoporosis within this category.
Figure 3C shows that spending on diabetes occurs later in life than low back and neck pain and other musculoskeletal disorders and is generally financed by public insurance. Similarly, Figure 3D shows that spending for ischemic heart disease occurs generally later in life. However, there was higher spending for ischemic heart disease among men at younger ages than among women, and higher spending among women at older ages than among men.
Figure 3E shows that spending on falls was greatest at older ages, with a transition from private financing to public financing at aged 65 years, and with more spending on women than men at the oldest ages. A relatively large fraction of this was out-of-pocket payments. Figure 3F shows that while there was higher spending on urinary diseases among women aged 20 to 40 years, there was higher spending among men at older ages with a major increase at aged 55 years.
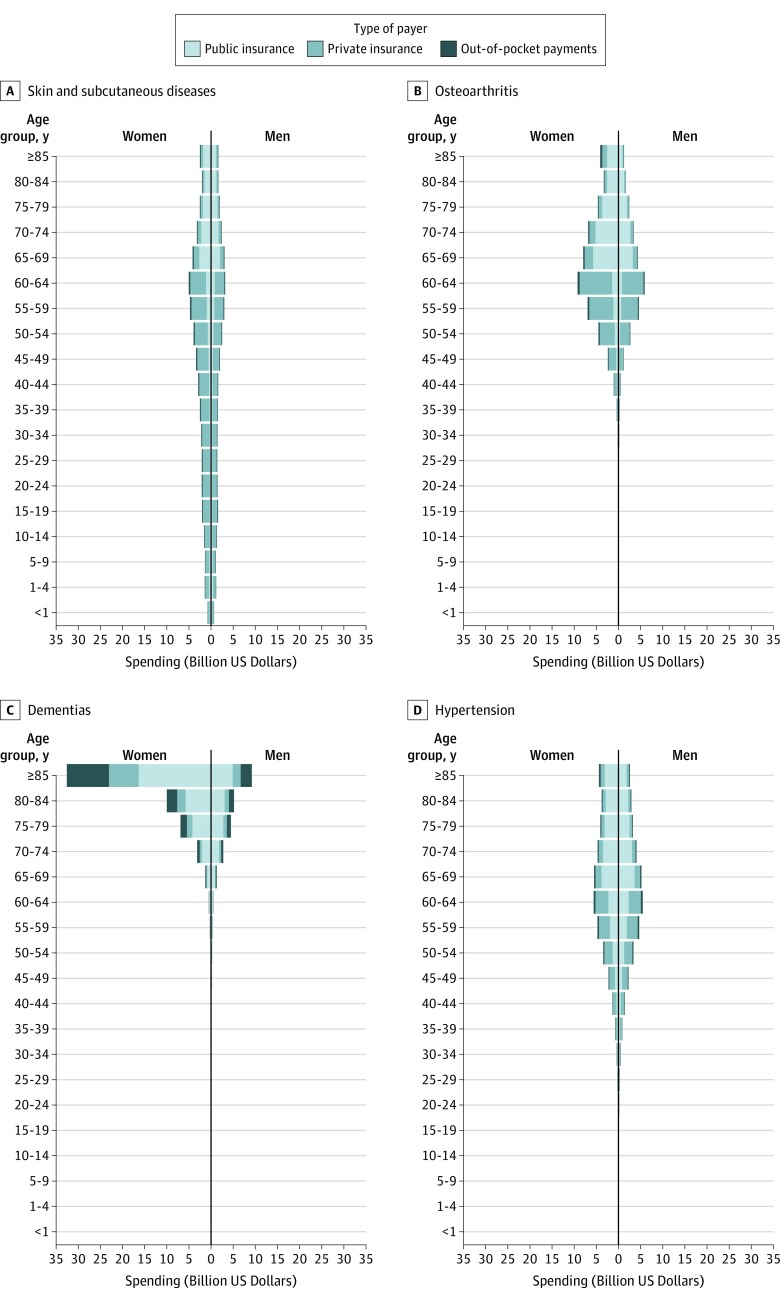
Figure 4
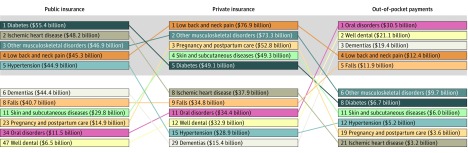
Figure 5 Figure 4A shows that spending on skin and subcutaneous disorders was similar at all ages, with higher spending among women and among those with private insurance. Figure 4B shows spending was higher among women with osteoarthritis, with spending roughly split between public and private insurance. Figure 4C shows that the highest spending was among older women with dementias, and substantially higher spending among women than men because, on average, women live longer than men and are less likely to have an in-home informal caregiver (eg, a spouse), and therefore have substantially higher spending for nursing care facility stays. Because a substantial amount of spending for nursing care facility stays was paid by out-of-pocket payments, a relatively large portion of spending for dementias was paid by out-of-pocket payments. Figure 4D shows that spending for hypertension occurs later in life, roughly even among men and women, and primarily funded by public insurance.
Figure 5 shows that the health conditions with the highest modeled spending for each payer varied. In 2016, the health conditions with the highest spending funded by public insurance were diabetes (an estimated $55.4 billion [95% CI, $49.3 billion–$62.7 billion]), ischemic heart disease (an estimated $48.2 billion [95% CI, $43 billion–$54.6 billion]), and other musculoskeletal disorders (an estimated $46.9 billion [95% CI, $42 billion–$52.6 billion]). In 2016, the health conditions with the highest spending funded by private insurance were low back and neck pain (an estimated $76.9 billion [95% CI, $66.8 billion–$88 billion]), other musculoskeletal disorders (an estimated $73.3 billion [95% CI, $62.2 billion–$87.5 billion]), and pregnancy and postpartum care (an estimated $52.8 billion [95% CI, $46.4 billion-$59.4 billion]). The health conditions with the highest spending paid by out-of-pocket payments were oral disorders (an estimated $30.5 billion [95% CI, $29.1 billion–$32 billion]), well dental care (an estimated $21.1 billion [95% CI, $20 billion–$22.6 billion]), and dementias (an estimated $19.4 billion [95% CI, $7.2 billion–$31.7 billion]).
Table 3. Health conditions routinely coded as secondary or as a comorbidity had spending increased as part of our adjustments if the microdata showed they were systematically associated with higher spending. Spending on dementias, chronic kidney disease, urinary disease, and heart failure increased the most. For health conditions that were routinely coded as a primary diagnosis but frequently had comorbidities present that increased spending, the spending was reduced. Spending on septicemia, falls, and lower respiratory tract infection decreased the most. Of the 154 health conditions with spending estimates, those ranked lower than 100 according to health care spending appear in Table 3.
Health Care Spending by Payer Across Time
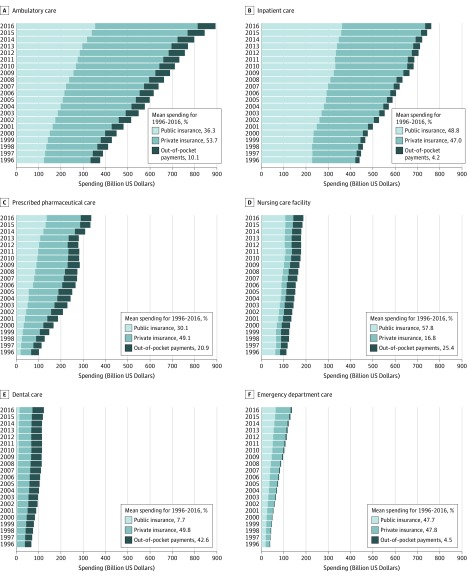
Figure 6 Figure 6 shows that across time, the composition of which payers contributed spending in each type of care has changed little. Between 1996 and 2016, 53.7% (95% CI, 53.7%–53.7%) of ambulatory care was paid by private insurance, with increases from 33.1% (95% CI, 33.1%–33.1%) to 39.6% (95% CI, 39.6%–39.6%) in spending paid by public insurance. Across this period, 48.8% (95% CI, 48.8%–48.8%) of inpatient care and 47.7% (95% CI, 47.7%–47.7%) of ED care were paid by public insurance, with little spending paid by out-of-pocket payments (4.2% [95% CI, 4.2%–4.2%] and 4.5% [95% CI, 4.5%–4.5%], respectively).
Although 49.1% (95% CI, 49.0%–49.1%) of prescribed pharmaceutical care spending was paid by private insurance across all years, spending paid by public insurance increased substantially from 19.1% (95% CI, 19.1%–19.2%) in 1996 to 40.6% (95% CI, 40.4%–40.8%) in 2016 with an increase in 2006 associated with the implementation of Medicare Part D. Spending paid by public insurance was 57.8% (95% CI, 57.8%–57.8%) for nursing care facility stays, whereas 7.7% (95% CI, 7.7%–7.7%) was for dental care.
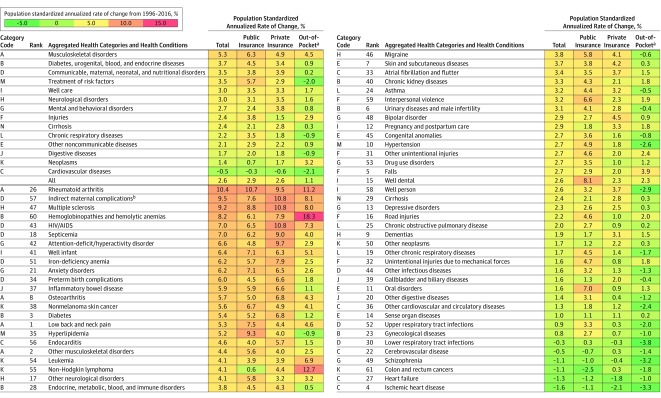
Figure 7 After adjusting for changes in inflation, population size, and age groups, health care spending was estimated to have increased between 1996 and 2016 at an annualized rate of 2.9% (95% CI, 2.9%–2.9%) for public insurance, 2.6% (95% CI, 2.6%–2.6%) for private insurance, and 1.1% (95% CI, 1.0%–1.1%) for out-of-pocket payments (Figure 7). The health conditions with the highest annual spending growth paid by public insurance and at least an estimated $10 billion in spending were rheumatoid arthritis (10.7% [95% CI, 7.6%–13.3%]), hyperlipidemia (9.3% [95% CI, 8.2%–10.4%]), and multiple sclerosis (8.8% [95% CI, 7.1%–10.7%]). The health conditions with the highest annual spending growth paid by private insurance and at least an estimated $10 billion in spending in 2016 were HIV/AIDS (10.8% [95% CI, 4.2%–19.9%]), indirect maternal complications due to a preexisting condition (10.8% [95% CI, 4.6%–18.2%]), and multiple sclerosis (10.8% [95% CI, 7.5%–14.3%]).
The health conditions with the highest annual spending growth paid by out-of-pocket payments and at least an estimated $10 billion in spending in 2016 were hemoglobinopathies and hemolytic anemias (18.3% [95% CI, 7.7%–23.7%]), non-Hodgkin lymphoma (12.7% [95% CI, 8.8%–15.8%]), and rheumatoid arthritis (11.2% [95% CI, 7.8%–14.7%]). Between 1996 and 2016, 108 of the 154 (70.1%) health conditions increased their spending after adjusting for population growth and aging.
Discussion
After adjusting for increases in population size and the aging population, 108 of 154 health conditions had spending increases between 1996 and 2016. After adjusting for these factors, it was estimated that spending increased at an annualized rate of 2.9% (95% CI, 2.9%–2.9%) for public insurance, 2.6% (95% CI, 2.6%–2.6%) for private insurance, and 1.1% (95% CI, 1.0%–1.1%) for out-of-pocket payments. By 2016, the proportion of total health spending was 42.6% (95% CI, 42.5%–42.6%) accounted for by public insurance, 48.0% (95% CI, 48.0%–48.0%) by private insurance, and 9.4% (95% CI, 9.4%–9.4%) by out-of-pocket payments.
In 2016, there was more health care spending on low back and neck pain, other musculoskeletal disorders, diabetes, ischemic heart disease, and falls than other health conditions. The health conditions with the highest public insurance spending were diabetes and ischemic heart disease; the health conditions with the highest private insurance spending were low back and neck pain and other musculoskeletal disorders; and the health conditions with the highest out-of-pocket payments were oral disorders and well dental. These estimates have the potential to augment the understanding of what health conditions are leading to spending for each payer, as well as to allow for population- and age-adjusted comparisons of spending across time for each payer. [21–24]
Several of the health conditions with the highest spending have had substantial spending increases over the past 2 decades. Of the 5 health conditions with the highest spending in 2016, low back and neck pain and diabetes had the highest increases (in absolute terms). The health condition of low back and neck pain is especially notable because the majority of the modeled spending (57.2% [95% CI, 52.2%–61.2%]) was paid by private insurance and a relatively large fraction of the spending was associated with working-aged adults. Although the spending on low back and neck pain increased by 6.7% (95% CI, 6.1%–7.4%) annually between 1996 and 2016, the number of prevalent cases increased by only 1.1% annually and the health burden (measured using disability-adjusted health-years) increased by only 1.3% annually. [25] This finding is particularly concerning given efforts to reduce testing for uncomplicated acute low back pain and the lack of data demonstrating that newer therapies are any more effective than traditional low-cost treatments. [26–28]
Spending on dementias and diabetes also increased substantially. For example, spending on dementias increased from an estimated $38.6 billion (95% CI, $34.1 billion–$42.8 billion) in 1996 to an estimated $79.2 billion (95% CI, $67.6 billion–$90.8 billion) in 2016. Spending on dementias is likely to continue to increase as baby boomers age into the years most affected by the disease. Spending on diabetes also increased, with the recent growth fueled by increases in pharmaceutical spending. [21]
In addition, some of the health conditions with the highest changes in health care spending were also those that had an introduction of specialty drug treatment within the course of the current study, including hepatitis, rheumatoid arthritis, multiple sclerosis, and osteoarthritis. Collectively, it is estimated that specialty drugs contributed to 43% of net pharmaceutical spending across all health conditions despite only being 2% of the volume in 2016. [29]
This study assessed health care spending, which for many reasons differs from actual health system costs. In some cases, individuals do not have the resources to pay for their care (such as those who lack insurance or who have insurance but cannot pay their insurance deductible or co-pay). It was estimated that $74.9 billion of the health care costs in 2013 were for uncompensated care received by those without insurance. [30]
In other cases, insurance reimbursements are not sufficient to cover the full cost of care. These payments are considered underpayments. One published estimate suggested that $68.8 billion in Medicare and Medicaid underpayments existed for hospitals alone in 2016. To offset losses, clinicians and health care entities apply for federal and state grants that serve as supplemental payments. [30] In the current study, the focus was on tracking actual spending (rather than service costs) and the grants were included as public insurance spending and disaggregated proportional to other financing with government spending. However, it is unclear if the health condition, age group, and sex distribution for this spending actually reflects regular health care spending paid by public insurance.
In the current study, spending was attributed to the entity that managed the spending rather than the originating source of the resources. This classification aligns with US government accounting in the National Health Expenditure Accounts, and means that all employer-sponsored insurance, even if the employer was the government, was classified as private insurance. This spending includes federal employee health benefits, which covered between 72% and 75% of each federal employee’s premiums. Even though this insurance consists of more than 250 privately managed plans, the government pays a major portion of these premiums. [31]
In addition, employer-sponsored private insurance, which is heavily subsidized by the government through preferential tax status, was considered as private insurance spending in this study. Recent studies suggest that these subsidies accounted for $146 billion of health care costs in 2017. [32] These subsidies are indirect contributions from the government and provide further explanation as to why these estimates do not account for the health care system’s entire effect on the government.
This study does not provide information about who should pay for US health care. Decades of health policy debate reflect the lack of consensus on this issue. Reinhardt, a health economist, asserted for years that these debates are an inability for society to agree “to what extent should the better-off members of American society be made to be their poorer and sick brothers’ and sisters’ keepers in health care.”33 Although the government and private insurance fund the majority of health care in this country, the 9.4% (95% CI, 9.4%–9.4%) that is financed by out-of-pocket payments (in 2016) is not distributed evenly or in accordance to individuals’ ability to pay. Even though the findings from this study cannot answer who should pay for health care, the data and analysis help to contextualize this debate moving forward by demonstrating payer trends over time.
This study improves on previous reports and has several strengths. In addition to disaggregating spending by type of payer, these new estimates expand and improve on prior published estimates from this team [5, 7, 8] in several key ways: (1) the estimates extend 3 additional years through 2016, (2) additional data sources were used to improve the precision of the estimates, (3) all the methods have been updated and improved, and (4) spending on government administration and the net cost of insurance programs has been included.
The major improvements regarding the data and methods focused on nursing care facility stay, ED care, specialty drugs, and dementias. In addition, the methods used to combine information from different data sources were improved, including to map conditions across differing ICD codes and to generate comparable estimates across time and age for each health condition and sex.
The estimates reported in this article may inform a diverse set of government agencies and private organizations, such as the Bureau of Economic Analysis, which has produced similar, yet distinct research using a different accounting framework. These more granular breakouts provide information about one of the largest and fastest growing segments of the economy.
The strengths of this study relative to existing DEX research are the inclusion of spending categorized by payers and the extension of existing estimates to 2016, both of which provide valuable context for evaluating the changes in the US health care system and continuing policy debates about the restructuring of the health insurance market. In addition, these are the first estimates, to our knowledge, to disaggregate the administrative costs of insurance across health conditions and key patient demographics. These estimates also identify which payer faces the highest burden of spending for a given disease and for each age group. These estimates also provide insight into how spending has changed across time for each payer before and after adjusting for changes in population size and age and can provide informative context for ongoing efforts to evaluate programs and constrain spending.
Limitations
This study has several limitations. First, the data used in this study are imperfect. For example, the MEPS and other data sources exclude active military personnel, incarcerated individuals, and homeless individuals. Similarly, the payers with the highest spending for each health condition may have been underrepresented in the survey data due to the infrequency in which these cases occur. Furthermore, the many statistical adjustments and modeling necessary to complete this study are only as strong as the underlying data. Ongoing investment in all-payer claims data or expansion to existing surveys would be valuable additions for improving the accuracy and tracking of health care spending and outcomes.
Second, although this study broadens the analysis timeline and augments prior work by disaggregating spending by payer, it was unable to delineate spending by geographic region, income, race, or education level, which are characteristics that would help inform health policy. In addition, the study did not provide granular and potentially distinct spending trends associated with the 2 major government insurance programs, Medicare and Medicaid, that comprise the majority of the public insurance payer group. Future analyses should assess spending trends by health condition for each of these different programs.
Third, this study cannot make any claims regarding the efficiency and effectiveness of these spending amounts and whether the trends are best suited in meeting national objectives to optimize the value of health care spending overall. More research is needed to make these judgements, including matching health condition–specific and enrollee-specific health outcomes with these spending estimates.
Fourth, this study spans 1996 through 2016. Even though 21 years is a longer period than previously available for assessing spending by health condition, these estimates are, at the time of publication, 3 years out of date. When the research was conducted (summer of 2019), the MEPS and the National Health Expenditure Accounts were the only data sources that provided 2017 data and these sources were not deemed sufficient to make comprehensive estimates for 2017.
Conclusions
Estimates of US spending on health care showed substantial increases from 1996 through 2016, with the highest increases in population-adjusted spending by public insurance. Although spending on low back and neck pain, other musculoskeletal disorders, and diabetes accounted for the highest amounts of spending, the payers and the rates of change in annual spending growth rates varied considerably.
Additional File
Supplement (7.3M, pdf)
References:
Chang AY, Cowling K, Micah AE, et al. ;
Global Burden of Disease Health Financing Collaborator Network . Past, present, and future
of global health financing: a review of development assistance, government,
out-of-pocket, and other private spending on health for 195 countries, 1995-2050.
Lancet. 2019;393(10187):2233-2260.Morrisey M. Health insurance
In: Health Insurance. 2nd ed Chicago, IL:
Health Administration Press; 1-24.Centers for Medicare & Medicaid Services NHEA related studies.
https://www.cms.gov/Research-Statistics-Data-and-Systems/Statistics-Trends-and-Reports/NationalHealthExpendData/NHEA-Related-Studies.html
Published November 20, 2015. Accessed December 15, 2017.Centers for Medicare & Medicaid Services Historical.
https://www.cms.gov/Research-Statistics-Data-and-Systems/Statistics-Trends-and-Reports/NationalHealthExpendData/NationalHealthAccountsHistorical.html
Published January 8, 2018. Accessed October 17, 2018.Dieleman JL, Baral R, Birger M, et al.
US Spending on Personal Health Care and Public Health, 1996-2013
JAMA 2016 (Dec 27); 316 (24): 2627-2646Institute for Health Metrics and Evaluation DEX home.
http://www.healthdata.org/dex
Accessed December 15, 2017.Dieleman JL, Squires E, Bui AL, et al.
Factors associated with increases in US health care spending, 1996-2013.
JAMA. 2017;318(17):1668-1678Bui AL, Dieleman JL, Hamavid H, et al.
Spending on children’s personal health care in the United States, 1996-2013.
JAMA Pediatr. 2017;171(2):181-189.Agency for Healthcare Research and Quality Medical Expenditure Panel Survey for 2013.
https://www.meps.ahrq.gov/mepsweb/
Accessed January 23, 2020.Agency for Healthcare Research and Quality;
Healthcare Cost and Utilization Project Nationwide Inpatient Sample for 2012.
https://www.hcup-us.ahrq.gov/db/nation/nis/nisdbdocumentation.jsp
Accessed January 23, 2020.Truven Health Analytics United States MarketScan Medicare supplemental and coordination of benefits database for 2010.
http://ghdx.healthdata.org/record/united-states-marketscan-medicare-supplemental-and-coordination-benefits-database-2010
Accessed January 23, 2020.US Centers for Disease Control and Prevention;
National Center for Health Statistics NAMCS and NHAMCS web tables
https://www.cdc.gov/nchs/ahcd/web_tables.htm
Published October 26, 2017. Accessed March 2, 2018.US Centers for Disease Control and Prevention;
National Center for Health Statistics National nursing home survey
https://www.cdc.gov/nchs/nnhs/index.htm
Published January 10, 2018. Accessed March 30, 2018.Foreman KJ, Naghavi M, Ezzati M.
Improving the usefulness of US mortality data: new methods for reclassification of underlying cause of death.
Popul Health Metr. 2016;14:14.Dieleman JL, Baral R, Johnson E, et al.
Adjusting health spending for the presence of comorbidities: an application to United States national inpatient data.
Health Econ Rev.Hamavid H, Birger M, Bulchis AG, et al.
Assessing the complex and evolving relationship between charges and payments in US hospitals: 1996-2012.
PLoS One. 2016;11(7):e0157912.Substance Abuse and Mental Health Services Administration Results from the 2016 national survey on drug use and health: detailed tables.
http://www.samhsa.gov/data/report/results-2016-national-survey-drug-use-and-health-detailed-tables
Published September 7, 2017. Accessed January 23, 2020.Smithson M, Verkuilen J.
A better lemon squeezer? maximum-likelihood regression with beta-distributed dependent variables.
Psychol Methods. 2006;11(1):54-71.Aitchison J.
The Statistical Analysis of Compositional Data.
Caldwell, NJ: The Blackburn Press; 2003.US Department of Commerce Bureau of Economic Analysis.
https://www.bea.gov/data/prices-inflation/gdp-price-index
Published March 2, 2018. Accessed March 1, 2018.Squires E, Duber H, Campbell M, et al.
Health care spending on diabetes in the US, 1996-2013
Diabetes Care. 2018;41(7):1423-1431.Patrick SW, Schumacher RE, Benneyworth BD, Krans EE, McAllister JM, Davis MM.
Neonatal abstinence syndrome and associated health care expenditures: United States, 2000-2009.
JAMA. 2012;307(18):1934-1940Tangka FK, Trogdon JG, Richardson LC, Howard D, Sabatino SA, Finkelstein EA.
Cancer treatment cost in the United States: has the burden shifted over time?
Cancer. 2010;116(14):3477-3484.Hwang W, Weller W, Ireys H, Anderson G.
Out-of-pocket medical spending for care of chronic conditions.
Health Aff (Millwood). 2001;20(6):267-278.GBD 2015 Disease and Injury Incidence and Prevalence Collaborators
Global, Regional, and National Incidence, Prevalence, and Years Lived with
Disability for 310 Diseases and Injuries, 1990-2015: a Systematic
Analysis for the Global Burden of Disease Study 2015
Lancet. 2016 (Oct 8); 388 (10053): 1545–1602Choosing Wisely website
Lumbar spine imaging recommendations from the American College of Emergency Physicians.
http://www.choosingwisely.org/clinician-lists/acep-lumbar-spine-imaging-in-the-ed/
Accessed October 19, 2018.Chou R, Deyo R, Friedly J et al.
Systemic Pharmacologic Therapies for Low Back Pain: A Systematic Review for an
American College of Physicians Clinical Practice Guideline
Annals of Internal Medicine 2017 (Apr 4); 166 (7): 480–492Chou R, Deyo R, Friedly J, Skelly A, Hashimoto R, Weimer M, et al.
Nonpharmacologic Therapies for Low Back Pain: A Systematic Review for an
American College of Physicians Clinical Practice Guideline
Annals of Internal Medicine 2017 (Apr 4); 166 (7): 493–505IQVIA website Understanding the drivers of drug expenditure in the US: November 2017.
https://www.iqvia.com/insights/the-iqvia-institute/reports/understanding-the-drivers-of-drug-expenditure-in-the-us
Accessed October 17, 2018.Coughlin TA, Holahan J, Caswell K
Uncompensated care for the uninsured in 2013: a detailed examination—sources of funding for uncompensated care.
https://www.kff.org/report-section/uncompensated-care-for-the-uninsured-in-2013-a-detailed-examination-sources-of-funding-for-uncompensated-care/
Accessed March 1, 2018.US Office of Personnel Management Healthcare: plan information.
https://www.opm.gov/healthcare-insurance/healthcare/plan-information/plans/
Accessed March 2, 2018.Rae M, Claxton G, Panchal N
Tax subsidies for private health insurance.
https://www.kff.org/private-insurance/issue-brief/tax-subsidies-for-private-health-insurance/
Accessed March 2, 2018.Currie J, Ho K, Kelly BR, Kuziemko I
Who will be our moral conscience now? a tribute to Uwe Reinhardt.
https://www.healthaffairs.org/do/10.1377/hblog20190805.922868/full/
Accessed February 4, 2020.
Return to NON-PHARMACOLOGIC THERAPY
Since 6-08-2021
| Home Page | Visit Our Sponsors | Become a Sponsor |
Please read our DISCLAIMER |